Archived information
Information identified as archived is provided for reference, research or recordkeeping purposes. It is not subject to the Government of Canada Web Standards and has not been altered or updated since it was archived. Please contact us to request a format other than those available.
Departmental Performance Report 2013-2014
PDF Version (1.89 MB)Footnote *
Foreign Affairs, Trade and Development Canada
Table of Contents
- Foreword
- Ministers’ Message
- Section 1: Organizational Expenditure Overview
- Section 2: Analysis of Programs by Strategic Outcome
- Section 3: Supplementary Information
- Section 4: Organizational Contact Information
- Appendix: Definitions
- List of Acronyms
- Supplementary Information Tables
Foreword
Departmental Performance Reports are part of the Estimates family of documents. Estimates documents support appropriation acts, which specify the amounts and broad purposes for which funds can be spent by the government. The Estimates document family has three parts.
Part I (Government Expenditure Plan) provides an overview of federal spending.
Part II (Main Estimates) lists the financial resources required by individual departments, agencies and Crown corporations for the upcoming fiscal year.
Part III (Departmental Expenditure Plans) consists of two documents. Reports on Plans and Priorities (RPPs) are expenditure plans for each appropriated department and agency (excluding Crown corporations). They describe departmental priorities, strategic outcomes, programs, expected results and associated resource requirements, covering a three-year period beginning with the year indicated in the title of the report. Departmental Performance Reports (DPRs) are individual department and agency accounts of actual performance, for the most recently completed fiscal year, against the plans, priorities and expected results set out in their respective RPPs. DPRs inform parliamentarians and Canadians of the results achieved by government organizations for Canadians.
Additionally, Supplementary Estimates documents present information on spending requirements that were either not sufficiently developed in time for inclusion in the Main Estimates or were subsequently refined to account for developments in particular programs and services.
The financial information in DPRs is drawn directly from authorities presented in the Main Estimates and the planned spending information in RPPs. The financial information in DPRs is also consistent with information in the Public Accounts of Canada. The Public Accounts of Canada include the Government of Canada Consolidated Statement of Financial Position, the Consolidated Statement of Operations and Accumulated Deficit, the Consolidated Statement of Change in Net Debt, and the Consolidated Statement of Cash Flow, as well as details of financial operations segregated by ministerial portfolio for a given fiscal year. For the DPR, two types of financial information are drawn from the Public Accounts of Canada: authorities available for use by an appropriated organization for the fiscal year, and authorities used for that same fiscal year. The latter corresponds to actual spending as presented in the DPR.
The Treasury Board Policy on Management, Resources and Results Structures further strengthens the alignment of the performance information presented in DPRs, other Estimates documents and the Public Accounts of Canada. The policy establishes the Program Alignment Architecture of appropriated organizations as the structure against which financial and non-financial performance information is provided for Estimates and parliamentary reporting. The same reporting structure applies irrespective of whether the organization is reporting in the Main Estimates, the RPP, the DPR or the Public Accounts of Canada.
A number of changes have been made to DPRs for 2013−14 to better support decisions on appropriations. Where applicable, DPRs now provide financial, human resources and performance information in Section II at the lowest level of the organization’s Program Alignment Architecture.
In addition, the DPR’s format and terminology have been revised to provide greater clarity, consistency and a strengthened emphasis on Estimates and Public Accounts information. As well, departmental reporting on the Federal Sustainable Development Strategy has been consolidated into a new supplementary information table posted on departmental websites. This new table brings together all of the components of the Departmental Sustainable Development Strategy formerly presented in DPRs and on departmental websites, including reporting on the Greening of Government Operations and Strategic Environmental Assessments. Section III of the report provides a link to the new table on the organization’s website. Finally, definitions of terminology are now provided in an appendix.
Ministers’ Message
 The Honourable
John Baird
Minister of Foreign Affairs
 The Honourable
Ed Fast
Minister of International Trade
 The Honourable
Christian Paradis
Minister of International Development
 The Honorable
Lynne Yelich
Minister of State (Foreign Affairs and Consular)
We are pleased to present the 2013-14 Departmental Performance Report, the first report for the newly unified Foreign Affairs, Trade and Development Canada (DFATD). Over the past year, the new department promoted Canada’s values and interests internationally, enhanced prosperity, alleviated poverty, addressed humanitarian and global security challenges and served Canadians at home and abroad.
Job creation and Canadian prosperity remained at the heart of DFATD’s priorities, with the launch of the Global Markets Action Plan, a comprehensive pro-trade and pro-investment plan that aligns Canada’s trade, development and foreign policy tools to advance our commercial interests globally.
As part of this ambitious pro-export plan, Prime Minister Harper concluded a historic Canada-European Union trade agreement, as well as the Canada-Korea Free Trade Agreement, which, together with Canada’s existing FTAs, will provide Canada with free-trade access to over half of the global marketplace. Canada-U.S. cooperation on economic, security and energy issues was reinforced through the finalization of border pre-clearance arrangements for air, land, marine and rail transportation and the promotion of Canada as a stable and secure source of energy.
In support of international security, DFATD provided assistance to address crises in Syria and Mali, provided principled support for Ukraine’s sovereignty and continued to support the Middle East peace process and Israel’s right to exist. Canada’s leadership on human rights issues received international support through the passage of resolutions on the situation of human rights in Iran and the first standalone resolution on Child, Early and Forced marriage at the UN General Assembly, as well as a Resolution on Elimination of All Forms of Violence Against Women, adopted by the UN Human Rights Council.
Canada continued to lead global efforts to support maternal, newborn and child health and is on track to deliver on its five-year $2.85-billion G-8 Muskoka commitment to countries with high maternal and child mortality. Significant progress was achieved on sustainable economic development, and efforts were made to improve the transparency of development assistance. Canada now ranks eighth in the world in aid transparency—compared to 32nd in 2012.
Global humanitarian needs arising from natural disasters, acute food insecurity and conflict reached record levels over the past year. Canada responded to these needs with its largest contribution ever, providing its partners with $769.5 million to respond to the humanitarian needs of those affected by conflict and food insecurity in 54 countries and by natural disasters in 25 countries. Notably, under the leadership of Prime Minister Harper, Canada has been a world leader in responding to the crises in Ukraine and Iraq, and was one of the first countries to respond when Typhoon Haiyan struck the Philippines in November 2013. The Government of Canada launched a matching fund and through its partners is continuing to make a difference in the lives of those affected as they recover and rebuild from this disaster. Canada contributed to food assistance for up to 4.25 million conflict-affected Syrians, as well as the provision of assistance and protection for some 2.3 million Syrian refugees in neighbouring countries through the United Nations High Commissioner for Refugees.
As chair of the Arctic Council, Canada focused on initiatives that will make a difference in the lives of Northerners, creating the Arctic Economic Council to support environmental protection and social and economic development.
This year saw a number of global crises requiring Canadian consular support, with DFATD’s Standing Rapid Deployment Team assisting Canadians by helping Canada’s Embassies and consulates to provide critical services to Canadians in distress in Kenya, the Philippines, South Sudan and Ukraine.
Canadians love to travel. Today, more and more Canadians explore remote corners of the world, work for foreign–based companies, participate in student exchanges and retire in southern destinations. With the nature of international travel changing, so too are we modernizing Canada’s approach to consular services through the 21st Century Consular Plan so we can focus our attention on helping those who truly need it most, offer assistance more efficiently, and better educate Canadians on how to make smart travel decisions, with the goal of reducing consular issues before they arise.
To find out more about DFATD and its achievements, we invite you to visit the departmental website.
Section 1: Organizational Expenditure Overview
On June 26, 2013, the Budget Implementation Act (Bill C-60) received royal assent, formalizing the amalgamation of the Canadian International Development Agency (CIDA) and Foreign Affairs and International Trade Canada (DFAIT) into Foreign Affairs, Trade and Development Canada (DFATD).
A single department, fully integrated across geography and themes, is ensuring that our diplomatic, trade and development resources and expertise around the world are fully leveraged. It is allowing the Government of Canada to work more effectively abroad, aligning our strategic approaches and achieving greater results for Canadians.
Effective management of amalgamation has been a priority as organization and policies have been re-aligned and refocused while key priorities have been delivered. A change management plan, along with a mechanism for consultations with staff, has been put in place. Progress has been made in merging common services and the department is increasingly delivering coherent foreign policy, trade and development mandates.
Organizational Profile
Appropriate Ministers: John Baird, Minister of Foreign Affairs; Ed Fast, Minister of International Trade; Christian Paradis, Minister of International Development; and, Lynne Yelich, Minister of State (Foreign Affairs and Consular).
Institutional Heads: Daniel Jean, Deputy Minister of Foreign Affairs; Simon Kennedy, Deputy Minister of International Trade; and, Malcolm Brown, Deputy Minister of International Development.
Ministerial portfolio: Foreign Affairs, Trade and Development Canada.
Enabling Instrument: Department of Foreign Affairs, Trade and Development Act, S.C. 2013, c. 33, s. 174.
Year of Incorporation / Commencement: 1909.
Organizational Context
Raison d’être
Under the leadership of the Minister of Foreign Affairs, the Minister of International Trade, and the Minister of International Development, DFATD is responsible for the conduct of Canada’s international relations, including foreign affairs, international trade and commerce, and international development.
DFATD advances Canada’s values and interests internationally, delivers international programs, and manages Canada’s international aid program to alleviate poverty in the developing world and provide humanitarian assistance. The department provides commercial and consular services to Canadians at home and abroad, and manages the Government of Canada’s global network of missions.
Responsibilities
DFATD’s legal responsibilities are detailed in the 2013 Department of Foreign Affairs, Trade and Development Act, and can be summarized as follows.
The department manages Canada’s diplomatic and consular relations with foreign governments and international organizations, engaging and influencing international players to advance Canada’s political and economic interests and the values of freedom, democracy, human rights and the rule of law.
To improve and maintain market access for Canadian businesses, DFATD leads the negotiation of international trade agreements and the management of international trade dispute-resolution mechanisms. DFATD also provides advice and services to help Canadian businesses succeed abroad, fosters foreign direct investment in Canada, and supports international innovation, science and technology.
DFATD delivers consular services and the most up-to-date travel information through travel.gc.ca to Canadians so that they can make safe and smart travel decisions. The department supports global peace and stability, addresses security threats such as terrorism, transnational organized crime, and the proliferation of weapons and materials of mass destruction. DFATD also leads coordinated Canadian responses to crises and natural disasters abroad, including the provision of humanitarian assistance.
To foster sustainable international development and poverty reduction in developing countries, and provide humanitarian assistance during crises, the department manages the vast majority of Canada’s official development assistance. DFATD also manages Canada’s international platform—a global network of missions in 107 countriesFootnote 1 that supports the international work of DFATD and 25 other partner departments and agencies.
Strategic Outcomes and Program Alignment Architecture (PAA)
This DPR was prepared on the basis of DFATD’s interim 2014-15 PAA, which is a combination of the 2013-14 DFAIT and CIDA PAAs. A new and integrated DFATD PAA has been developed for 2015-16.
- Strategic Outcome 1: The international agenda is shaped to Canada's benefit and advantage in accordance with Canadian interests and values.
- Program: International Policy Advice and Integration
- Sub-program: International Information and Analysis
- Sub-program: Integrated International Policy Advice
- Program: Diplomacy and Advocacy
- Sub-program: Bilateral and Regional Diplomacy and Advocacy
- Sub-program: Summitry and Multilateral Diplomacy and Advocacy
- Sub-program: Contributions to International Organizations
- Sub-program: Trade Policy, Negotiations, Dispute Settlement and Controls
- Sub-program: International Assistance Program Governance
- Sub-sub-program: Global Peace and Security Fund
- Sub-sub-program: Global Partnership Program
- Sub-sub-program: Capacity Building Programs
- Sub-sub-program: Investment Cooperation Program
- Sub-sub-program: Canada Fund for Local Initiatives
- Sub-sub-program: Religious Freedom Fund
- Program: International Policy Advice and Integration
- Strategic Outcome 2: Canadians are satisfied with commercial and consular services.
- Program: International Commerce
- Sub-program: International Business Development
- Sub-program: Foreign Direct Investment in Canada
- Sub-program: International Innovation, Science and Technology
- Program: Consular Services and Emergency Management
- Sub-program: Safe Travel Promotion
- Sub-program: Consular Assistance for Canadians
- Sub-program: Emergency Preparedness and Response
- Program: International Commerce
- Strategic Outcome 3: Reduction in poverty for those living in countries where Canada engages in international development.
- Program: Fragile Countries and Crisis-affected Communities
- Sub-program: Humanitarian Assistance
- Sub-program: Afghanistan
- Sub-program: Haiti
- Sub-program: South Sudan
- Sub-program: West Bank and Gaza
- Program: Low-income Countries:
- Sub-program: Bangladesh
- Sub-program: Ethiopia
- Sub-program: Ghana
- Sub-program: Mali
- Sub-program: Mozambique
- Sub-program: Pakistan
- Sub-program: Senegal
- Sub-program: Tanzania
- Sub-program: Vietnam
- Sub-program: Other low-income Countries Assistance Programs
- Program: Middle-income Countries:
- Sub-program: Bolivia
- Sub-program: Caribbean Region
- Sub-program: Colombia
- Sub-program: Honduras
- Sub-program: Indonesia
- Sub-program: Peru
- Sub-program: Ukraine
- Sub-program: Other Middle-income Countries Assistance Programs.
- Program: Global Engagement and Strategic Policy
- Sub-program: International Development Policy
- Sub-program: Multilateral Strategic Relationships
- Sub-sub-program: International Financial Institutions
- Sub-sub-program: International Development Institutions
- Sub-sub-program: Political Organizations
- Sub-sub-program: Humanitarian Assistance Organizations
- Sub-program: Multilateral and Global Programming
- Sub-sub-program: Health Programming
- Sub-sub-program: Sectors/Themes Other Than Health
- Program: Canadian Engagement for Development
- Sub-program: Partners for Development
- Sub-program: Global Citizens
- Program: Fragile Countries and Crisis-affected Communities
- Strategic Outcome 4: DFATD maintains a mission network of infrastructure and services to enable the Government of Canada to achieve its international priorities.
- Program: Governance, Strategic Direction and Common Service Delivery
- Sub-program: Mission Platform Governance and Common Services
- Sub-program: Real Property
- Sub-program: Security
- Sub-program: Information Management/Information Technology
- Sub-program: Other Government Department Locally Engaged Staff
- Program: Government of Canada Benefits
- Sub-program: Foreign Service Directives Payments
- Sub-program: Employer Contributions to Locally Engaged Staff Pension, Insurance and Social Security Programs
- Social Security Programs
- Program: Governance, Strategic Direction and Common Service Delivery
- Program: Internal Services
Organizational Priorities
DFATD’s organizational priorities reflect areas in which the department delivered significant and tangible results in 2013-14. This section presents results achieved against the six priorities (numbers 1-6 below) identified in the former DFAIT’s 2013-14 Report on Plans and Priorities (RPP) and the four priorities (numbers 7-10 below) identified in the former CIDA’s 2013-14 RPP prior to the amalgamation into DFATD. These priorities are ordered as follows for clarity of presentation only.
Following the March 2013 Budget announcement that the two former departments would amalgamate, DFATD supported the passage of its constituting legislation on June 26 of that year, and made sure that its planning, programming, business processes and human resources were integrated to support organizational priorities. While the amalgamation of two organizations of the size and scope of the former DFAIT and CIDA is a complex process, major progress and many efficiencies have been made. At this stage, the department has established a new governance framework and implemented a new organizational structure that has been critical in driving policy and program coherence. The department continues to align how it manages its people, how it coordinates its activities, and how it integrates its various tools to seize on all the opportunities offered by amalgamation. These efforts have found their concrete expression in, among other examples, the elaboration of our New Directions policy on development, the agility of our response to natural disasters such as Typhoon Haiyan and major foreign policy crises such as Ukraine, the new role of heads of mission in driving the objectives of amalgamation, a new approach to the management of our amalgamated executive group, and the consolidation of a number of our business tools. The department will be undertaking further steps to increase policy coherence across business lines at headquarters, to build a cohesive workforce, and to take measures at missions abroad to ensure greater integration under head of mission leadership.
1) Contribute to economic prosperity and job creation through continued implementation of the Global Commerce Strategy, with an emphasis on expanding and diversifying commercial relationships with emerging and high-growth markets. Ongoing Priority Aligned to SO 1/SO 2
Summary of Progress: All of the plans aligned with this priority were fully achieved. A total of 27 free trade, air transport, and foreign investment promotion and protection agreements were concluded over the past year. Building on the success of its Global Commerce Strategy, DFATD launched Canada’s new Global Markets Action Plan, a comprehensive pro-trade and pro-investment plan that focuses on core Canadian strengths, aligns Canada’s trade, development and foreign policy tools to advance commercial interests around the world, and sets concrete targets to grow the presence of Canada’s small and medium-sized enterprises (SMEs) in emerging markets.
The Canada-EU Comprehensive Economic and Trade Agreement (CETA)—Canada’s most ambitious trade initiative to date—was concluded. As a result of CETA, countries with which Canada has free trade agreements will triple—from 14 to 43—providing Canada with free-trade access to over half of the global marketplace, representing a potential 20-percent boost in bilateral trade and a $12-billion boost to Canada’s annual income.
The Canada-Korea Free Trade Agreement is projected to grow Canada’s economy by $1.7 billion annually and increase Canadian exports to South Korea by 32 percent. Free trade negotiations within the Canada-Japan Economic Partnership Agreement and the Canada-India Comprehensive Economic Partnership Agreement were advanced, as were discussions with Israel to modernize the Canada-Israel Free Trade Agreement.
To deepen commercial relations with Africa, Canada concluded foreign investment promotion and protection agreements with Côte d’Ivoire, Guinea and Nigeria. Canada’s reputation as a responsible and reliable supplier of natural resources was enhanced through the Prospectors & Developers Association of Canada convention and the Global Petroleum Show, where Canadian suppliers and expertise were profiled for targeted global buyers.
2) Promote democracy and respect for human rights, and contribute to effective global governance and international security. Ongoing Priority Aligned to SO 1
Summary of Progress: All of the plans aligned with this priority in the 2013-14 RPP were fully achieved. DFATD provided international leadership on a range of human rights issues, including:
- Advancing the rights of women and girls through the first ever standalone resolution on child, early and forced marriage at the UN General Assembly as well as a Canada-led Resolution on Elimination of All Forms of Violence Against Women, which was adopted by the UN Human Rights Council;
- Leading the annual resolution at the UN General Assembly on the Situation of Human Rights in Iran;
- Support to international efforts to shed light on the grave human rights abuses in Syria;
- Focusing international attention on human rights violations in Sri Lanka, Syria and North Korea at the Human Rights Council and through the Universal Periodic Review process;
- Support for the Commission against Impunity in Guatemala to crack down on narco-terrorism and improve the rule of law;
- Engagement with the Government of Tunisia to reinforce the use of positive language on human rights, religious rights and the rights of women during the drafting of Tunisia’s new Constitution; and
- Advocacy on human rights issues in Angola, Eritrea, Ethiopia, Sudan, Zimbabwe and Uganda through high-level bilateral and multilateral engagement.
In support of international security, DFATD contributed $14.5 million to the International Atomic Energy Agency for ongoing investigations of the Iranian, North Korean and Syrian nuclear programs. Threats related to terrorism and the proliferation of weapons of mass destruction were mitigated through initiatives to secure and destroy chemical, biological, radioactive and nuclear materials.
Canada is providing ongoing, principled support for Ukraine’s sovereignty and democratic freedom in the face of Russian aggression through a range of measures, including targeted economic sanctions against officials and entities responsible for the crisis, leading the largest bilateral mission to observe the presidential election to ensure a free and fair vote, together with extensive programming advancing Ukraine’s democracy, security, and economic stability. By September 2014, Canada had imposed sanctions under the Special Economic Measures Act against 179 Russian and Ukrainian individuals and entities, and at the request of the Ukrainian government, imposed asset freezes and travel bans against 18 Ukrainians under the Freezing Assets of Corrupt Foreign Officials Act (FACFOA).
Humanitarian, development and security assistance continues to be provided in response to the crisis in Syria. This includes significant funds to assist refugees and displaced persons, social media communications and dialogue with Syrians, as well as contributions to the destruction of Syria’s chemical weapons arsenal, countering terrorism and preventing movement of foreign fighters into the region.
To address security crises in Africa, DFATD contributed to the UN-mandated African Union mission in the Central African Republic, to the UN mission in South Sudan, and continued to co-chair the Sahel Working Group of the Global Counter-Terrorism Forum. Canada continues to contribute significant resources to South Sudan to reduce the burden of the political crisis on civilians. To support peace and security in Mali, $10 million was provided through the UN and the African Union.
DFATD actively defended Israel’s right to exist and defend itself, advocating for a two-state solution negotiated directly between the parties. Minister Baird’s visit to the region underscored Canadian support for Israel and ongoing support was provided to the Palestinian Authority to bolster the security and justice sectors and to foster an environment conducive to the resumption of peace talks.
The Office of Religious Freedom was fully operationalized, and Canada’s Ambassador for Religious Freedom raised awareness through engagement in over 38 countries on the need to promote and defend religious freedom worldwide, including calling attention to egregious violations of religious freedoms in Iran, Iraq, Pakistan, Sri Lanka and Syria.
The department is taking steps to promote and defend Canada’s internet-related economic, security and foreign policy interests.
3) Reinforce the Canada-U.S. relationship and expand Canada's engagement in the hemisphere. Ongoing Priority Aligned to SO1/SO2
Summary of Progress: All of the plans aligned with this priority were fully achieved. Commercial relationships with the United States were enhanced through Trade Commissioner Service support for innovation and foreign investment, resulting in 48 foreign direct investments in Canada from the United States. An extensive advocacy campaign that focused on the promotion of Canada as a stable and secure source of energy and energy technology included ten tours of Canadian oil sands projects to inform and engage key U.S. decision makers. Oil Sands Matchmaking Seminars, hosted by the Canadian consulates general in New York City and Detroit, brought together Canadian oil sands operators with U.S. companies, and a pilot social media project on energy issues provided significant exposure to Canada’s key messages on energy and the environment.
DFATD supported the implementation of the Canada-U.S. Shared Vision for Perimeter Security and Economic Competitiveness, including finalizing negotiations toward a new pre-clearance agreement with the United States on air, land, marine and rail transportation. Canada-U.S. regulatory cooperation was reinforced through the conclusion of the Canada-U.S. Foreign Account Tax Compliance Act Agreement and the amendment of domestic Canadian legislation to bring to conclusion the 29 initiatives within the Canada-U.S. Regulatory Cooperation Council Joint Action Plan.
Political and commercial engagement with the Americas was reinforced by more than 30 high-level visits to the region by the Prime Minister and Canadian ministers, as well as by the conclusion of the Canada-Panama Free Trade Agreement and the Canada-Honduras Free Trade Agreement.
DFATD supported a range of initiatives to address transnational organized crime in the Caribbean and Central America. Deeper economic partnerships with Brazil and Pacific Alliance countries were facilitated by ministerial leadership at the Pacific Alliance Leaders’ Summit in Colombia and at the annual Strategic Partnership Dialogue in Brazil.
4) Increase Canada's economic and political engagement in Asia. Ongoing Priority Aligned to SO1
Summary of Progress: Substantial progress was achieved on all of the plans aligned with this priority. In cooperation with Canada’s provinces, the private sector and key stakeholders, DFATD began development of a comprehensive plan to deepen economic, security, and governance partnerships in Asia and to promote Canada as a secure energy partner. Prime Minister Harper announced support for the Asia-Pacific Economic Cooperation (APEC) Public Private Partnership Centre in Indonesia to facilitate greater private investment in infrastructure, which could lead to commercial opportunities for Canadian firms.
Canada supported the expansion of the Trans-Pacific Partnership (TPP) to include Japan, and progress was achieved within TPP negotiations and bilateral Canada-Japan Economic Partnership Agreement talks. Reducing barriers improved market access to China for a range of Canadian products, including cherries, wheat, barley, soybeans, canola and live swine.
Canada and India completed the final steps to bring into force the 2010 Canada-India Nuclear Cooperation Agreement. DFATD continued to pursue foreign investment promotion and protection agreements with Cambodia, Indonesia and Mongolia. In strengthening Canada’s engagement with Association of Southeast Asian Nations (ASEAN), Minister Fast participated in the first annual meeting of the Canada-ASEAN Business Forum. Minister Baird attended the ASEAN-Canada Post Ministerial Conference and ASEAN Regional Forum and announced support for the ASEAN Infrastructure Centre of Excellence on public-private partnerships and funding for training on financial regulation.
Canada’s development programs were increased in Asia with Burma, Mongolia and the Philippines being designated countries of focus. As a result of Typhoon Haiyan Canada invested significant funds into emergency relief and long-term rebuilding, including a visit to affected areas by Minister Paradis.
In support of private sector development, the Canada-Asia Trade and Investment for Growth Program leveraged over $93 million in private equity investment to help grow small and medium-sized enterprises in six countries in Asia.
5) Consular Services: Enhance safety awareness for Canadians abroad. Ongoing Priority Aligned to SO2
Summary of Progress: All plans aligned with this priority were fully achieved. To mitigate the need for emergency consular assistance, public awareness of DFATD’s international travel information was significantly improved through the creation and ongoing use of the Travel smart app as well as public awareness campaigns targeting specific audiences. Tailored campaigns on the 3Rs of International Travel including publications on safe travel, advice on travel insurance, a consent letter for children travelling abroad, and a safe travel video featured in Service Canada centres and airline inflight programming have sought to empower travelling Canadians to help themselves and ensure a safe travel experience. The number of visitors to Travel.gc.ca increased by 1.2 million over the previous year, demonstrating strong public awareness of the website.
Over 2,000 updates to country Travel Advice and Advisories pages were provided to ensure Canadians had the most up-to-date travel information, which prepared them for when they made the decision to travel. DFATD used its Twitter Travel account—which posted a 332-percent increase in the number of followers since last year—to provide Canadians with up-to-date travel information.
Canada’s emergency response capabilities were enhanced by strengthening DFATD’s Standing Rapid Deployment Team, which now includes 80 skilled officers who can be deployed within hours to respond to emergencies or critical incidents affecting Canadians during times of distress or Canadian interests abroad. The Emergency Watch and Response Centre function, which includes 24/7 monitoring of world events and consular emergency assistance for Canadians abroad during international crisis or natural disasters, was reinforced with the creation of a new Watch Unit, providing early detection of emergency and security events that could impact the safety and security of Canadians, Canadian missions or Canadian interests abroad.
Under the leadership of Minister of State Yelich, DFATD modernized Canada’s approach to consular services through the 21st Century Consular Plan, which features four key initiatives: 1) Focus on Children; 2) Targeted Outreach; 3) Go Digital!; 4) Strengthen our response network. The new plan focuses attention on helping those who truly need it most, offering assistance more efficiently, better educating Canadians on how to make smart travel decisions, with the goal of reducing consular issues before they arise and improving the alignment of resources to address complex consular cases.
6) Implement Canada's Arctic foreign policy to exercise sovereignty in the Arctic, in support of the Northern Strategy. Ongoing Priority Aligned to SO1
Summary of Progress: All of the plans aligned with this priority were fully achieved. Over the past year, under the leadership of the Minister for the Arctic Council, Leona Aglukkaq, Canada as chair of the Arctic Council focused on initiatives that would make a difference in the lives of Northerners. In support of Canada’s Northern Strategy, DFATD concluded negotiations within the Arctic Council to create the Arctic Economic Council, which will foster sustainable Arctic economic development, environmental protection and social development.
DFATD supported work to increase regional and global awareness of the importance of traditional ways of life among Arctic indigenous peoples, including the promotion of mental wellness in Northern communities and adaptation to climate change. To secure international recognition of the full extent of Canada’s continental shelf, Canada filed a submission in December 2013 with the UN Commission on the Limits of the Continental Shelf regarding its continental shelf in the Atlantic Ocean and preliminary information regarding its continental shelf in the Arctic Ocean.
The government knows that securing international recognition of Canada’s offshore boundaries is fundamental to long-term economic prosperity, and to exercising Canada’s sovereignty. Canadian officials and scientists are doing the additional, necessary work to ensure that a submission for the full extent of the continental shelf in the Arctic includes Canada’s claim to the North Pole.
7) Stimulate sustainable economic growth to reduce poverty. Ongoing Priority Aligned to SO3
Summary of Progress: Substantial progress was achieved on the plans aligned with this priority. DFATD’s sustainable economic growth efforts focused on building economic foundations, growing businesses and investing in people, setting the conditions for sustainable private-sector-led growth as a means to increase social stability and decrease poverty.
In recognition of Canadian leadership on innovative financing, Minister Paradis was appointed as Chair of the Redesigning Development Finance Steering Committee. The Steering Committee, which operates as part of the World Economic Forum – Organisation for Economic Co-operation and Development, will promote a more systematic approach to testing and scaling up financial innovations and blending capital from philanthropists, private and commercial investors, and development institutions in order to accelerate progress towards development objectives.
With DFATD’s support, the Inter-American Development Bank trained over 22,000 public trade officials and private entrepreneurs in trade and investment in 2013 and financed more than 1,300 international trade transactions. The Asian Development Bank provided 831,000 borrowers, mostly women, with microfinance loans and enhanced the quality of education for more than 19 million students in 2013.
DFATD supported extractive sector opportunities in developing countries, including fostering innovation, improving regulations and enhancing oversight of resources extraction. Recognized as a global leader in promoting transparency and accountability in the extractive sector, DFATD supported 14 countries in Africa, Asia and Latin America to enhance the transparency and governance of their extractive industries.
The Federal Government set up the Canadian International Institute for Extractive Industries and Development. The Institute aims to help resource-rich developing countries make better use of and derive more benefit from their extractive sectors in order to reduce poverty and stimulate sustainable economic growth. The Institute acts as an independent centre for Canadian and world-class expertise in improving and strengthening resource governance to help developing country governments manage their extractive sectors.
Through the World Bank, DFATD assisted 32 countries to implement Extractive Industries Transparency Initiative (EITI) standards. In 2013, technical assistance and grants to governments and civil societies in Africa totalled over $24 million for 20 EITI-implementing countries, 15 of which are now EITI compliant. Through hosting the Secretariat of the Intergovernmental Forum on Mining, Minerals, Metals and Sustainable Development (IGF), the Department is supporting the 49 member countries to strengthen the responsible management of their mineral sectors.
In June 2013, Canada announced Tanzania and Peru as G-8 ‘Fast Track’ Partnerships for Extractives and Transparency. This led, for example, to DFATD providing technical support to 30 municipalities in Peru to enhance their capacity to manage mining royalties, benefiting as many as 183,466 Peruvians through the reinvestment of mining revenues into 139 education, health and infrastructure projects.
In February 2014, Minister Paradis announced the creation of the Extractives Cooperation for Enhanced Economic Development (EXCEED) Program. With an initial budget of $25 million per year, this funding will build the capacity of African governments and non-government institutions to better govern the extractives sector, promote sustainable extractives-related economic opportunities, and maximize the benefits while mitigating the risks (in particular for women and youth) arising from extractives sector development.
8) Securing a future for children and youth with a focus on maternal, newborn and child health. Ongoing Priority Aligned to SO3
Summary of Progress: Over the past year, DFATD continued making substantial progress in implementing its Children and Youth Strategy, focusing on child survival, including maternal health, access to quality education, and the safety and security of children and youth.
Four years into Canada's five-year, $2.85-billion commitment to the G-8 Muskoka Initiative on Maternal, Newborn and Child Health (MNCH), DFATD, under the leadership of Prime Minister Harper, is on target to deliver on its entire commitment, having disbursed more than 80 percent of the funding and making a real difference in countries where maternal and child mortality are high.
In 2013-14, DFATD supported the Prime Minister in hosting the Saving Every Woman, Every Child: Within Arm’s Reach Summit in Toronto May 28-30 at which Canada announced $3.5 billion in funding for the 2015-2020 period. This high-level summit that included presentations from the Secretary General of the United Nations, Melinda Gates and the Queen of Jordan re-focused attention on this issue and built consensus on ensuring MNCH is a prominent element of the Post-2015 Development Agenda. This included working with the office of the United Nations Secretary General on the hosting of a high-level event on MNCH at the 69th UN General Assembly (UNGA) in September 2014.
The Department also led efforts with the World Bank to create a Global Financing Facility in support of Every Woman Every Child, announced at UNGA. This Facility will help finance efforts in developing countries to improve the health of women and children and to build the civil registration and vital statistics (CRVS) systems critical to accountability in MNCH. The Prime Minister announced Canada’s commitment of $200 million to the facility, of which $100 million was dedicated to CRVS.
In anticipation of a new call-for-proposals in the fall of 2014, DFATD supported Minister Paradis in conducting a national series of roundtables with civil-society organizations and private-sector participants on how best to address MNCH issues.
Funding provided to the Canadian Network for Maternal, Newborn and Child Health (CAN-MNCH) improved coordination among 70 Canadian organizations actively engaged in MNCH programs. In 2013, the Network hosted a two-day symposium to improve Canada’s ability to deliver MNCH programming by sharing success stories, exchanging knowledge and increasing program coordination.
With significant DFATD support, the Micronutrient Initiative ensured that more than 180 million children received two doses of vitamin A—a nutritional element key to healthy development, immunity and eyesight. More than 300 million people were provided with iodized salt to prevent iodine deficiency, and nearly 2 million pregnant women received iron and folic acid supplements to support healthier pregnancies. Through a large contribution from DFATD to the Global Fund and the GAVI Vaccine Alliance and other donors, approximately 48 million children were immunized with life-saving vaccines.
DFATD aims to ensure that all girls, boys and youth are able to access a quality education in safe and secure environments and have the opportunity to learn the skills they need to become productive adults. For example, DFATD participates in the Global Partnership for Education, the main global mechanism for fostering policy dialogue and promoting aid effectiveness in basic education, which, by the end of 2014, has helped 19.9 million additional children enter primary school. DFATD has also contributed to strong education results in countries of focus such as Tanzania and Haiti. In Tanzania, DFATD’s support to the education system over the past 12 years has helped to increase primary school enrolment rates to 92%. DFATD is also supporting a five-year Aga Khan Foundation of Canada project to strengthen teacher education systems to improve learning outcomes for students at pre-primary and primary levels in southern Tanzania. In Haiti, DFATD contributes to government efforts to develop the education system and improve access to quality basic education for all children through school building, tuition grants, provision of school kits, and through large-scale school feeding programs.
Education and child protection in emergency contexts are also a priority. DFATD supports the “No Lost Generation Initiative”, which helps to ensure that a generation of Syrian children are provided with the protective environment and learning opportunities they need to reclaim their childhood. Through this initiative, it is expected that 650,000 children will be reached.
From 2005 onwards, significant gains of up to 50 percent in primary school enrolment for girls and boys were observed in the majority of Canada's countries of focus. For example, northern Africa, which had enrolment rates of 80 percent in 1990, had almost achieved universal primary education by 2012. Western Asia and Southern Asia have also closed the gap towards universal primary education, especially since 2000. In addition, the Department has focused on programming to ensure children are well nourished and protected from debilitating disease as well as efforts to advance the protection and rights of children to ensure that they are able to seize educational opportunities by providing safe and nurturing places to learn. DFATD helped strengthen national systems to support the rights and protection of children and youth, particularly girls, from violence, exploitation and abuse. In Colombia, approximately 1,400 children, adolescents and parents received training on how to prevent sexual abuse and commercial sexual exploitation, enhancing their ability to create a protective environment for vulnerable girls and boys.
In Afghanistan, Canada funded programming to address the causes and consequences of child, early and forced marriage through increasing women’s access to justice, legal and medical advice as well as awareness building of women’s rights within Afghan and Islamic law. Projects have also been implemented to address gender-based violence among displaced and returnee communities providing support to 9,900 survivors (5,300 women and 4,600 girls).
9) Increasing food security in support of development. Ongoing Priority Aligned to SO3
Summary of Progress: Substantial progress was achieved on this priority, with DFATD’s efforts concentrated in the following areas: sustainable agricultural development; food assistance and nutrition; and research and development.
Through DFATD’s support, the International Fund for Agricultural Development trained more than 4.46 million people in crop production practices and technologies, and 5.48 million people benefited from enhanced access to rural financial services. Support for the Consultative Group for International Agricultural Research helped 385,153 more farmers use new agricultural technologies and farming innovations such as improved crop varieties and land management practices.
Through the Scaling Up Nutrition Movement and other global initiatives, Canada continued to provide policy leadership on nutrition issues and was the top international donor for nutrition-specific interventions. Canada's increased investment in nutrition through the Muskoka Initiative has been a critical component of global nutrition efforts.
DFATD funding in Ethiopia trained 12,085 farmers (4,063 women) and 368 agricultural extension officers (119 women) in the use of new agricultural technologies, in addition 3,587 (1,339 women) beneficiaries were supported in market oriented agricultural activities in both crop and livestock production and 1,806 farmers (679 women) have increased their income by selling more than 70,000 kgs of their sesame through their cooperative unions. Additionally, DFATD support in Honduras resulted in a significant reduction in child malnutrition and increases in corn and bean yields, as well as the installation 22 irrigation schemes benefitting more than 1700 producers.
DFATD supported efforts by the World Food Programme (WFP) to distribute 3.1 million tons of food and US$506 million in cash and vouchers to more than 80.9 million people in 75 countries, 67.9 million of whom were women and children. DFATD’s support through the Canadian International Food Security Research Fund benefited more than 75,000 farmers involved in 21 projects, with challenges ranging from revitalizing crops such as indigenous vegetable and small millets, to vaccines for livestock diseases, and the role of nanotechnology in reducing fruit losses in storage and shipping.
10) Increase management and program delivery efficiency in support of Canada’s Aid Effectiveness Agenda. Ongoing Priority Aligned to SO3
Summary of Progress: In 2013-14, DFATD completed the implementation of the new Authorized Programming Process (APP), which standardizes programming procedures to increase efficiency and strengthen the focus on achievement of development results. Following amalgamation, DFATD is piloting the use of APP by select Foreign Affairs and Trade programs, with the objective of standardizing grants and contributions programs procedures throughout the new department.
DFATD strengthened transparency of program delivery through the APP, the International Aid Transparency Initiative, and Canada’s Open Government Initiative. The APP captures all development project data more efficiently and accurately, allowing DFATD to report to ministers, Parliament, the public and the Organization of Economic Cooperation and Development (OECD), as well as meeting obligations under the International Aid Transparency Initiative and Canada's Open Government Initiative.
DFATD was ranked eighth in the world in aid transparency in 2013, compared to 32nd in 2012. The Government of Canada’s Aid Effectiveness Agenda included regular reporting to Canadians, partners and international audiences on international development work through the International Development Project Browser, which contains profiles of almost 3,000 projects and received 230,000 visits and 1.2 million page views over the past year.
Risk Analysis
From natural disasters and security threats to a changing international landscape, DFATD is exposed to a range of risks related to international realities largely beyond its control. The amalgamation of CIDA and DFAIT created new risk considerations, and an interim DFATD 2013-14 Corporate Risk Profile (CRP) was put in place with risk response strategies being carried forward from 2012-13 for both organizations. A comprehensive review of the risks facing the new department was conducted in fall 2013, and a new, integrated DFATD Corporate Risk Profile is in place for 2014-15.
DFATD’s 2013-14 CRP identified five significant external risks to the department’s ability to deliver results against its 2013-14 plans and priorities. These risks were actively managed by senior managers, who reported bi-annually to the Deputy Ministers and governance boards on their progress in reducing the department’s exposure to these risks.
Risk Table: DFATD’s 2013-14 External Corporate Risks and Risk Response Strategies
Corporate Risk 1: Emergency Response - Simultaneous and/or significant natural disasters, hostile actions or civil unrest at mission(s) could disrupt departmental operations on a corporate-wide scale.
Link to PAA: SO1; SO2; SO3; SO4
Risk Response Strategies
Completed
- Standing Rapid Deployment Teams of trained emergency personnel deployed to provide critical services to Canadians in distress during emergencies established.
- 24/7 scanning capacity within the Emergency Watch and Response Centre created.
- Heads of Missions’ accountabilities for emergency preparedness clarified.
- Emergency management training improved and mainstreamed for Canada-based staff.
Ongoing
- Enhance proactive outreach to Canadians on safe travel practices, including the Travel smart app and the DFATD Travel twitter account.
Corporate Risk 2: Personnel Security - Operating in complex and challenging security environments abroad may lead to the severe injury or death of Canadian personnel, dependents, contractors or clients.
Link to PAA: SO1; SO2; SO3; SO4
Risk Response Strategies
Completed
- Measures to address individual behaviors that disregard DFATD security and safety policies reviewed.
- Increased numbers of professionally trained Mission Security Officers deployed to high-risk missions.
Ongoing
- Work with partners to improve security training and offer it to all employees deployed overseas.
- Complete enhancements to the physical security infrastructure of chanceries, official residences and staff quarters at high-risk missions.
- Continue implementation of a risk-prioritized approach to completing strategic baseline threat assessments at missions.
- Work toward the establishment of a Hazard Prevention Program to improve the relevance of security considerations in the workplace.
Corporate Risk 3: Cyber Threats - A cyber-attack or individual exfiltration of information could result in a breach of government-owned information, block access to IT systems, interrupt communications and/or service delivery and create a perception that DFATD is not to be trusted with sensitive information.
Link to PAA: SO1; SO2; SO3; SO4
Risk Response Strategies
Completed
- Worked with Shared Services Canada to develop investment plans to ensure timely implementation of the IT Infrastructure Renewal Program.
- Infrastructure Renewal Program completed to support essential replacement and redesign of DFATD’s SIGNET network.
- Reviewed measures to improve compliance through better enforcement and to discourage individual behaviours that disregard regulations on security of information.
Corporate Risk 4: Reputation - Perceived performance or events may affect DFATD’s reputation and the confidence of stakeholders in the department’s ability to fulfill its mandate.
Link to PAA: SO1; SO2; SO3; SO4
Risk Response Strategies
Completed
- Improved grants and contributions program performance reporting.
- Progress in meeting the International Aid Transparency Initiative benchmarks.
- Incorporated management of reputation risk into high-risk programs.
- Established mechanisms for rapid response to disasters.
Ongoing
- Improve communications and engagement strategies (Facebook, Twitter, etc.).
- Analyze feedback from stakeholders including the public, organizations, companies and politicians.
- Draft new Strategic Communication Framework to address project risks and opportunities.
- Make use of a credible third party in reputation crisis situations.
Corporate Risk 5: Fiduciary - There is a risk that DFATD funds will not be used for their intended purposes, funds will not be properly accounted for, and/or do not achieve the value-for-money objectives of the programs they finance.
Link to PAA: SO1; SO2; SO3; SO4
Risk Response Strategies
Completed
- Enhanced due diligence process in design and approval of initiatives and overall programming framework
- Ensured full assessment of country, partner or international organizations as per the department’s new Policy on Fiduciary Risk for International Assistance Envelope (IAE) programming.
- Made use of the Risk-Based Administration Matrix for IAE programming to tailor the administrative burden of the recipient and department based on risk.
- Established clear conditions for disbursement and exit.
- Provided training for project officers and managers on fraud awareness.
Risk Narrative and Results Achieved
Corporate Risk 1: Emergency Response
DFATD maintains a global network of 174 missions in 107 countries, many of which are located in areas vulnerable to natural disasters or in countries with elevated threats associated with terrorism or civil unrest. Canadians continue to make the decision to travel overseas in increasing numbers, and many use DFATD’s services to make safe and informed travel decisions through travel.gc.ca. In 2013-14, DFATD fully implemented four risk response strategies to ensure an effective Canadian response to international emergencies, including support to Canadians abroad, as summarized above. A fifth risk response strategy (i.e. proactive outreach to Canadians on safe travel practices) was deemed a recurring initiative and formally built into department operations as an ongoing commitment.
Corporate Risk 2: Personnel Security
DFATD’s first priority is the security of over 7,500 Canada-based and locally engaged Government of Canada employees working at missions abroad as well as dependents of Canadian officials posted abroad. To ensure the safety and security of its personnel, DFATD continued its multi-year implementation of six initiatives. By March 2014, updated baseline assessments had been completed for 70 percent of critical/high-risk missions. Additional work is on schedule to complete these baseline threat assessments for the remaining 30 percent of missions. Substantial progress was made in enhancing physical security of chanceries, official residences and staff quarters at high-risk missions. Six additional Security Program Managers, for a total of 31 by the end of March 2014, were posted to provide support to high-risk missions. A departmental infractions policy was implemented to reinforce staff compliance with safety and security policies. Additionally, the Hazard Prevention Program was approved. One risk response strategy (i.e. improving security training) was deemed a recurring response strategy and formally built into department operations as an ongoing commitment.
Corporate Risk 3: Cyber Threats
In cooperation with SSC, DFATD maintains a 24/7 communications network that connects the department and its international partners to 174 Canadian missions abroad. DFATD relies on IT systems to ensure effective delivery of Canada’s foreign policy, consular, development and trade objectives throughout its network. The department, like other foreign affairs ministries, is a target for cyber-attacks at home and abroad. The loss or unauthorized release of sensitive information could have significant negative consequences for Canada and Canadians. DFATD fully implemented the three risk response strategies summarized above.
Corporate Risk 4: Reputation
DFATD’s international assistance mandate includes providing opportunities for children and youth, increasing food security, and stimulating sustainable economic growth. A lack of awareness and easily accessible performance information could impact the level of confidence among Canadians and partners in the effectiveness and efficiency of the department’s work. DFATD implemented eight initiatives summarized above. All International Aid Transparency Initiative requirements were met, including the provision of improved program performance reporting. New mechanisms were put in place to strengthen Canadian responses to disasters. Progress was made in analyzing feedback from stakeholders using a Strategic Communication Framework. Finally, one initiative (i.e. communications and engagement strategies) was deemed a recurring response strategy and formally built into department operations as an ongoing commitment.
Corporate Risk 5: Fiduciary
DFATD disburses close to $3 billion annually in Grants and Contributions funding to achieve its international assistance mandate. Over half of the disbursements take place in fragile states, communities affected by crisis and low-income countries, through partner organizations. DFATD successfully reduced the risk that DFATD funds may not be used for their intended purposes or provide value-for-money. Project risk due diligence and assessments were enhanced through the implementation of tools such as the Risk-Based Administration Matrix and the Financial Risk Evaluation Tool for International Assistance Envelope programming. Training for project officers, managers and technical advisors on fiduciary risk management was also increased.
Actual Expenditures
| (Main Estimates) 2013-14 | Planned Spending 2013-14 | Total Authorities (Available for use) 2013-14 | Actual Spending (Authorities used) 2013-144 | Difference 2013-14 (actual minus planned) |
|---|---|---|---|---|
2 Financial and Human Resource information reflect the full year amounts for former CIDA. | ||||
| 5,470,977,834 | 5,544,863,662 | 6,242,556,591 | 5,757,743,713 | 212,880,051 |
| Planned 2013-14 | Actual 2013-14 | Difference 2013-14 (actual minus planned) |
|---|---|---|
5 FTEs are a measure of the extent to which an employee represents a full person-year charge against a departmental budget. FTEs are calculated as a ratio of assigned hours of work to scheduled hours of work. Scheduled hours of work are set out in collective agreements. | ||
| 11,586 | 11,084 | -502 |
Budgetary Performance Summary for Strategic Outcomes and Programs (dollars)
Strategic Outcome 1: Canada’s International Agenda
| Programs | Main Estimates 2013-14 | Planned Spending | Total Authorities (available for use) 2013-2014 | Actual Spending (authorities used) | ||||
|---|---|---|---|---|---|---|---|---|
| 2013-14 | 2014-15 | 2015-16 | 2013-14 | 2012-13 | 2011-12 | |||
| 1.1: International Policy Advice and Integration | 77,104,515 | 75,304,515 | 88,774,491 | 80,995,726 | 104,026,780 | 98,858,328 | 92,434,881 | 99,300,160 |
| 1.2: Diplomacy and Advocacy | 928,211,597 | 903,900,597 | 985,542,151 | 974,817,932 | 1,014,280,061 | 939,594,606 | 940,538,085 | 1,063,589,745 |
| SO 1 Sub-Total | 1,005,316,112 | 979,205,113 | 1,074,316,642 | 1,055,813,658 | 1,118,306,841 | 1,038,452,934 | 1,032,972,966 | 1,162,889,905 |
Strategic Outcome 2: International Services for Canadians
| Programs | Main Estimates 2013-14 | Planned Spending | Total Authorities (available for use) 2013-14 | Actual Spending (authorities used) | ||||
|---|---|---|---|---|---|---|---|---|
| 2013-14 | 2014-15 | 2015-16 | 2013-14 | 2012-13 | 2011-12 | |||
| 2.1: International Commerce | 154,135,951 | 154,135,951 | 169,850,188 | 148,829,520 | 160,918,756 | 156,811,144 | 160,582,217 | 167,454,635 |
| 2.2: Consular Services and Emergency Management | 46,582,770 | 46,582,770 | 50,646,046 | 49,112,360 | 55,257,695 | 54,306,686 | 54,470,658 | 67,959,797 |
| SO 2 Sub-Total | 200,718,721 | 200,718,721 | 220,496,234 | 197,941,880 | 216,176,451 | 211,117,830 | 215,052,875 | 235,414,432 |
Strategic Outcome 3: International Development and Humanitarian Assistance
| Programs | Main Estimates 2013-14 | Planned Spending | Total Authorities (available for use) 2013-14 | Actual Spending (authorities used) | ||||
|---|---|---|---|---|---|---|---|---|
| 2013-14 | 2014-15 | 2015-16 | 2013-14 | 2012-13 | 2011-12 | |||
| 3.1: Fragile States and Crisis-Affected Communities | 590,680,214 | 690,680,214 | 689,532,601 | 687,262,805 | 971,317,978 | 866,291,228 | 602,412,281 | 788,201,321 |
| 3.2: Low-income Countries | 917,574,328 | 917,574,328 | 758,805,142 | 723,776,613 | 966,445,870 | 791,652,540 | 786,424,294 | 873,386,696 |
| 3.3: Middle-income Countries | 337,884,532 | 337,884,532 | 351,070,532 | 362,707,668 | 324,116,753 | 322,974,722 | 279,461,152 | 297,083,788 |
| 3.4: Global Engagement and Strategic Policy | 955,135,772 | 955,135,772 | 973,759,140 | 976,979,354 | 1,145,186,733 | 1,143,250,475 | 1,370,525,021 | 1,578,607,671 |
| 3.5: Canadian Engagement for Development | 267,942,474 | 267,942,474 | 266,529,251 | 270,745,850 | 242,245,091 | 241,527,494 | 271,384,693 | 282,321,595 |
| SO 3 Sub-Total | 3,069,217,320 | 3,169,217,320 | 3,039,696,666 | 3,021,472,290 | 3,649,312,425 | 3,365,696,459 | 3,310,207,441 | 3,819,601,071 |
Strategic Outcome 4: Canada's International Platform
| Programs | Main Estimates 2013-14 | Planned Spending | Total Authorities (available for use) 2013-14 | Actual Spending (authorities used) | ||||
|---|---|---|---|---|---|---|---|---|
| 2013-14 | 2014-15 | 2015-16 | 2013-14 | 2012-13 | 2011-12 | |||
| 4.1: Governance, Strategic Direction & Common Service Delivery | 650,086,910 | 650,086,910 | 690,357,458 | 580,810,807 | 714,341,149 | 620,548,489 | 716,016,050 | 654,591,115 |
| 4.2: Government of Canada Benefits | 201,565,520 | 201,565,519 | 194,307,264 | 188,094,768 | 229,870,882 | 229,133,960 | 220,037,627 | 212,015,924 |
| SO 3 Sub-Total | 851,652,430 | 851,652,429 | 884,664,722 | 768,905,575 | 944,212,031 | 849,682,449 | 936,053,677 | 866,607,039 |
| Programs | Main Estimates 2013-14 | Planned Spending | Total Authorities (available for use) 2013-14 | Actual Spending (authorities used) | ||||
|---|---|---|---|---|---|---|---|---|
| 2013-14 | 2014-15 | 2015-16 | 2013-14 | 2012-13 | 2011-12 | |||
| Internal Services | 273,700,251 | 273,697,079 | 273,530,148 | 267,823,640 | 300,970,624 | 279,215,822 | 287,009,954 | 305,687,847 |
| Sub-Total | 273,700,251 | 273,697,079 | 273,530,148 | 267,823,640 | 300,970,624 | 279,215,822 | 287,009,954 | 305,687,847 |
| Programs | Main Estimates 2013-14 | Planned Spending | Total Authorities (available for use) 2012-13 | Actual Spending (authorities used) | ||||
|---|---|---|---|---|---|---|---|---|
| 2013-14 | 2014-15 | 2015-16 | 2013-14 | 2012-13 | 2011-12 | |||
6 Actual spending allocated to programs not included in the 2013-14 PAA is related to Passport Canada, which was transferred to Citizenship and Immigration Canada (CIC) as part of Budget 2013. As a result, actual spending was $56.8 million lower than planned spending. Actual spending reflects expenditures incurred by DFATD prior to transferring the responsibility for Passport Canada to CIC, effective July 2, 2013. | ||||||||
| Funds allocated to programs not included in the 2013-14 PAA6 | 70,373,000 | 70,373,000 | Not applicable | Not applicable | 13,578,219 | 13,578,219 | 23,139,633 | 19,528,819 |
| Total | 5,470,977,834 | 5,544,863,662 | 5,492,704,412 | 5,311,957,043 | 6,242,556,591 | 5,757,743,713 | 5,804,436,546 | 6,409,729,113 |
Explanation of Variances
The variance between the main estimates ($5,471.3 million), planned spending ($5,544.9 million) and total authorities ($6,242.6 million) is due to the timing differences of these three financial processes, the way in which the department is expected to report revenues and the fact that a portion of funding was not approved until after the publication of the 2012-13 RPP. The variance ($212.6 million) between planned spending ($5,544.9 million) and actual spending ($5,757.7 million) in 2013-14 is explained by program below.
The variance between planned and actual full-time equivalents is mainly attributable to the implementation of the Budget 2012 Spending Review. Prudent management of staffing is also a factor.
Explanation of Variances by Programs
1.1 International Policy Advice and Integration
Actual spending was $23.6 million higher than planned spending, mainly due to supplementary funding received through Treasury Board central votes, such as Operating Budget Carry forward amounts and paylist expenditures.
1.2 Diplomacy and Advocacy
Actual spending was $35.7 million higher than planned spending, mainly due to supplementary funding received for the Global Peace and Security Fund. The increase in spending was offset by the lapse of funds related to the Global Partnership Program and softwood lumber litigation. In addition, resources were reallocated between programs.
2.1 International Commerce
Actual spending was $2.7 million higher than planned spending due to internal reallocation between programs to implement the Global Markets Action Plan.
2.2 Consular Services and Emergency Management
Actual spending was $7.7 million higher than planned spending, mainly due to supplementary funding received for the Temporary Resident and Citizenship programs, as well as through Treasury Board central votes, such as Operating Budget Carry forward amounts and paylist expenditures.
3.1 Fragile Countries and Crisis-affected Communities
Actual spending was $175.6 million higher than planned spending. The variance was caused by a number of international crises and natural disasters requiring Canadian assistance. These included amongst others, Typhoon Haiyan in the Philippines, political instability in the Central African Republic and South Sudan, as well as the large number of displaced persons related to fighting in Syria.
3.2 Low-income Countries
Actual spending was $125.9 million lower than planned spending. The variance reflects a shift in several low-income countries to crisis/disaster funding, as well as the unused portion of the Pakistan-Canada Debt for Education Conversion initiative, the funding received to forgive the debts related to the 1976 loan made to the Government of Burma as well as internal reallocations to meet new DFATD and Government of Canada priorities.
3.3 Middle-income Countries
Actual spending was $14.9 million lower than planned spending. The variance mostly reflects internal reallocations to meet new DFATD and Government of Canada priorities as well as an inability by certain partners to spend these monies in this fiscal year.
3.4 Global Engagement and Strategic Policy
Actual spending was $188.1 million higher than planned spending. The variance is mainly attributable to internal reallocation of funds to fund multilateral efforts to work in crisis affected regions as well as payments to the World Bank for the Advance Market Commitment for pneumococcal vaccines.
3.5 Canadian Engagement for Development
Actual spending was $26.4 million lower than planned spending, which was the result of some implementing partners not being able to receive or spend allocated funds during this fiscal year.
4.1 Governance, Strategic Direction and Common Service Delivery
Actual spending was $29.5 million lower than planned spending. The department received additional funds through Treasury Board central votes such as Operating and Capital Budget Carry forward amounts. These additional funds were mainly offset by unused funds from Special Purpose Allotments.
4.2 Government of Canada Benefits
Actual spending was $27.5 million higher than planned spending, due to funding received for expenditure fluctuations for allowances provided to CBS working abroad, as well as through Treasury Board central votes such as Operating Budget Carry forward amounts.
5.1 Internal Services
Actual spending was $5.5 million higher than planned spending, due to additional funding received through Treasury Board central votes, such as Operating Budget Carry forward amounts and paylist expenditures.
Alignment of Spending With the Whole-of-Government Framework
| Strategic Outcomes | Programs | Spending Area | Government of Canada Outcomes | Actual Spending 2013−14 |
|---|---|---|---|---|
| SO1: Canada’s International Agenda - The international agenda is shaped to Canada’s benefit and advantage in accordance with Canadian values and interests. | 1.1: International Policy Advice and Integration | International Affairs | A safe and secure world through international engagement | 98,858,328 |
| 1.2: Diplomacy and Advocacy | International Affairs | A safe and secure world through international engagement | 939,594,606 | |
| SO2: International Services for Canadians – Canadians are satisfied with commercial and consular services. | 2.1: International Commerce | International Affairs | A prosperous Canada through global commerce | 156,811,144 |
| 2.2: Consular Services and Emergency Management | International Affairs | A safe and secure world through international engagement | 54,306,686 | |
| SO3: International Development and Humanitarian Assistance – Reduction in poverty for those living in countries where Canada engages in international development. | 3.1: Fragile Countries and Crisis-affected Communities | International Affairs | Global poverty reduction through international sustainable development | 866,291,228 |
| 3.2: Low-income Countries | International Affairs | Global poverty reduction through international sustainable development | 791,652,540 | |
| 3.3: Middle-income Countries | International Affairs | Global poverty reduction through international sustainable development | 322,974,722 | |
| 3.4: Global Engagement and Strategic Policy | International Affairs | Global poverty reduction through international sustainable development | 1,143,250,475 | |
| 3.5: Canadian Engagement for Development | International Affairs | Global poverty reduction through international sustainable development | 241,527,494 | |
| SO4: Canada's International Platform – The department maintains a mission network of infrastructure and services to enable the Government of Canada to achieve its international priorities. | 4.1: Governance, Strategic Direction and Common service Delivery | International Affairs | A safe and secure world through international engagement | 620,548,489 |
| 4.2: Government of Canada Benefits | International Affairs | A safe and secure world through international engagement | 229,133,960 |
| Spending Area | Total Planned Spending | Total Actual Spending |
|---|---|---|
| Economic Affairs | 0 | 0 |
| Social Affairs | 0 | 0 |
| International Affairs | 5,544,863,662 | 5,757,743,713 |
| Government Affairs | 0 | 0 |
Expenditure Profile
The department’s total actual spending in 2013-14 of $5,757.7 million was within its total authorities of $6,242.6 million granted by Parliament. The actual spending trend over the past three years is illustrated below.
Departmental Spending Trend

This bar graph has the title “Departmental Spending Trend Graph” at the very top. It demonstrates the spending trend for DFATD from 2011-12 to 2016-17. The vertical axis indicates the figures in millions of dollars, with a low of $0 and a high of $7 billion, while the horizontal axis displays the six years. The first three bars in the graph represent the actual spending during the past three years. The graph shows a notable decrease from $6.41 billion in 2011-12 to $5.804 billion in 2012-13, followed by a much more moderate decrease to $5.758 billion in 2013-14. The final three bars in the graph show the projected spending from 2014-15 to 2016-17, and are also broken into two sections; voted spending and sunset programs. These three bars show a moderate decrease in overall spending over the next three years. Projected spending decreased from $5.493 billion in 2014-15 to $5.352 billion in 2015-16, followed by another decrease to $5.245 billion in 2016-17. Sunset program funding will also decline over the next three year period, but at an accelerated rate in comparison to voted spending. Sunset program spending is projected at $136 million in 2014-15, followed by $113 million in 2015-16 and $72 million in 2016-17.
The $46.7-million decrease in actual spending from 2012-13 to 2013-14 is mainly related to the consolidation of the High Commission of Canada in the United Kingdom, located at Trafalgar Square, London, which was offset by Canada’s forgiveness of the Government of Pakistan’s debt.
The decrease of $605.3 million from 2011-12 to 2012-13 is due to efficiencies related to the Budget 2012 Spending Review, as well as a decrease in the level of funding toward the three-year commitment to the Fast Start Climate Change initiative. The decrease is also attributable to the funds not required from the Crisis Pool Quick Release Mechanism as the department was able to respond effectively to international crises and disasters using existing resources.
For the period 2014-15 to 2016-17, the planned spending reflects currently approved funding to support the departmental strategic outcomes. Reductions in planned spending are mainly attributable to carry forward amounts to be received in 2014-15 only, in accordance with Treasury Board policies.
Estimates by Vote
For information on DFATD’s organizational votes and statutory expenditures, consult the Public Accounts of Canada on the Public Works and Government Services Canada website.
Section 2: Analysis of Programs by Strategic Outcome
Strategic Outcome 1: Canada’s International Agenda - The international agenda is shaped to Canada’s benefit and advantage in accordance with Canadian interests and values.
Program 1.1: International Policy Advice and Integration
Description: DFATD draws upon its expertise at missions and headquarters to establish integrated and coherent foreign policy and international trade priorities and to provide information, intelligence and advice to ministers, senior officials and key partners to support informed decisions that advance Canadian values and interests internationally.Footnote 7
| Main Estimates 2013-14 | Planned Spending 2013-14 | Total Authorities 2013-14 | 2013–14 Actual Spending | Difference between planned and actual spending 2013-14 |
|---|---|---|---|---|
| 77,104,515 | 75,304,515 | 104,026,780 | 98,858,328 | 23,553,813 |
| Planned 2013–14 | Actual 2013-14 | Difference 2013-14 |
|---|---|---|
| 771 | 860 | 89 |
| Expected Result | Performance Indicator | Target | Result |
|---|---|---|---|
| Government of Canada decision makers establish integrated and well-informed policies on how to advance Canada’s interests and values. | Degree to which, on a scale of 1 to 5, the Government of Canada is satisfied with the information, intelligence and advice provided by the department. | 4 | 4 |
Performance Analysis and Lessons Learned
Over the past year, this program met one of its performance targets and established baseline information for two of its performance indicators. The government’s satisfaction with the information and policy advice provided by the department was evident through the approval by ministers and senior officials of strategies and plans to guide Canada’s international engagement, including:
- DFATD’s Global Markets Action Plan, a comprehensive pro-trade, pro-investment plan that will concentrate Canada’s efforts on the markets that hold the greatest promise for Canadian business;
- an International Education Strategy, focused on maintaining and enhancing Canada’s global leadership position in higher education and supporting prosperity, innovation and competitiveness;
- an International Science, Technology and Innovation Strategy to enhance access to capital, technology and markets, strengthen bilateral relationships and attract foreign direct investment;
- an Export Strategy for Defence Procurement to support international sales opportunities and participation in defence production global value chains;
- legal and policy advice was provided to develop and implement multiple rounds of sanctions against Russia for its actions in Ukraine, as well as to develop and manage the implementation of over 20 sanctions regulations, including against Iran, North Korea and Syria; and
- ongoing work, supported by Minister Yelich, modernized Canada’s approach to consular services through the 21st Century Consular Plan. The new plan focuses attention on helping those who truly need it most, offering assistance more efficiently, better educating Canadians on how to make smart travel decisions, with the goal of reducing consular issues before they arise and improving the alignment of resources to address complex consular cases.
- Through the development of DFAIT’s and CIDA’s 2013-14 RPPs, the department set out a coherent strategic plan to advance Canada’s foreign affairs, trade and development interests. Following amalgamation of DFAIT and CIDA in June 2013, accountabilities for the implementation of these two RPPs were aligned to the new department’s organizational structure.
Sub-Program 1.1.1: International Information and Analysis
Description: Government of Canada decision makers are provided with information products such as mission reports, information memoranda, and political and economic research so that they are well informed on issues related to Canada’s international values and interests.
| Planned Spending | Actual Spending | Difference | Planned | Actual | Difference |
|---|---|---|---|---|---|
8 The variance is mainly due to additional funding received through Treasury Board (TB) Central Votes (i.e. Budget Carry Forward amounts from 2012-13 to 2013-14, and Paylist Expenditures). | |||||
| 18,067,285 | 23,064,430 | 4,997,1458 | 173 | 193 | 20 |
| Expected Result | Performance Indicator | Target | Result |
|---|---|---|---|
9 This performance indicator was revised from a percentage to a five-point scale to allow for more flexibility and greater accuracy. | |||
| Government of Canada decision makers are well informed on issues related to Canada’s international values and interests. | Degree to which, on a scale of 1 to 5, Government of Canada decision makers indicated that DFATD’s information and analysis products met their expectations for content and relevance to Canada’s international values and interests.9 | Baseline | 4.8510 |
Performance Analysis and Lessons Learned
Baseline performance data were established for this sub-program over the past year. Analysis of 1,343 unclassified reports concluded that 97 percent met expectations for content and relevance to Canadian values and interests. Feedback from end users of 1,179 classified reports was consistently positive, with analysis of the quality of this reporting to be further refined.
Over the past year, DFATD’s network of officers at headquarters and at 174 missions abroad produced over 2,500 classified and unclassified reports related to Canada’s international engagement. Decision making was supported through the provision of information products to senior management, including 445 information memorandums to ministers.
To inform strategic planning and the development of departmental priorities, a comprehensive environmental scan was completed that evaluated emerging global and domestic trends shaping the department’s operating context over the next five years. A Global Operating Environment Assessment was also undertaken to examine the implications of global trends for DFATD’s operations.
DFATD’s policy research agenda focused on a range of topics, including: natural resources and foreign policy; networked societies and foreign policy; global rebalancing and the emergence of Asia; and, migration, diversity and foreign policy.
Through DFATD’s Office of the Chief Economist, statistics and research were provided in support of DFATD’s commercial priorities, including monthly statistical trade reports, global value chain research, and research on the impact of trade commissioner services (TCS) on exporter performance.
Sub-Program 1.1.2: Integrated International Policy Advice
Description: Through this sub-program, Government of Canada decision makers are provided with decision products such as action memoranda, briefing notes, memoranda to Cabinet, and presentations so that they are well advised on options for actions and policies regarding Canada's international values and interests.
| Planned Spending | Actual Spending | Difference | Planned | Actual | Difference |
|---|---|---|---|---|---|
11 The variance is mainly due to additional funding received through TB Central Votes (i.e. Budget Carry Forward amounts from 2012-13 to 2013-14, and Paylist Expenditures). | |||||
| 57,237,230 | 75,793,898 | 18,556,66811 | 598 | 667 | 69 |
| Expected Result | Performance Indicator | Target | Result |
|---|---|---|---|
12 This performance indicator was revised from a percentage to a five-point scale to allow for more flexibility and greater accuracy. | |||
| Government of Canada decision makers are well advised on options for actions and policies affecting Canada’s international values and interests. | Degree to which, on a scale of 1 to 5, Government of Canada clients/decision makers agreed that the policy advice provided by DFATD met the quality criteria for content and relevance to Canada’s international values and interests.12 | Baseline | 4 |
Performance Analysis and Lessons Learned
Baseline performance data were established for this sub-program over the past year. Analysis of action memorandums provided to ministers over the past year indicated a high degree of alignment with government priorities.
In 2013-14, the Government of Canada’s Committee on Global Trends, Foreign Affairs and Defence Issues and DFATD’s Policy Committee were supported through the provision of integrated policy advice on Canada’s international agenda.
DFATD provided integrated policy advice to the Prime Minister, ministers and senior managers to support decision making on actions and policies affecting Canada’s international agenda, including:
- 1,035 action memorandums to ministers and 51 memorandums to Cabinet;
- 308 briefing binders/products, 902 meeting notes, 20,631 items of correspondence processed and 342 Question Period notes
Timely, high-quality legal and policy advice was provided to senior management across government on a variety of international issues, including: international trade and investment law; international human rights and humanitarian law; Canada’s engagement with international criminal tribunals, including the International Criminal Court; legal issues at the United Nations; consular and diplomatic law, including as part of Common Service Delivery; Canada’s Arctic Council Chairmanship; securing international recognition of Canada’s extended continental shelf; international environmental law, including a new global agreement on mercury, and, the conclusion of international instruments on sustainable fisheries with France and the U.S.
Program 1.2: Diplomacy and Advocacy
Description: DFATD uses diplomacy, advocacy, and program delivery, informed by consultations with domestic stakeholders, to engage and influence international players in order to advance Canadian interests and values.
| Main Estimates 2013-14 | Planned Spending 2013-14 | Total Authorities 2013-14 | 2013–14Actual Spending (authorities used) | 2013–14 Difference (actual minus planned) |
|---|---|---|---|---|
| 928,211,597 | 903,900,597 | 1,014,280,061 | 939,594,606 | 35,694,009 |
| Planned 2013-14 | Actual 2013-14 | Difference 2013-14 |
|---|---|---|
| 1,598 | 1,620 | 22 |
| Expected Result | Performance Indicator | Target | Result |
|---|---|---|---|
| International actors are engaged and influenced to build support for actions consistent with Canada’s interests and values. | Degree to which, on a scale of 1 to 5, Canadian positions are reflected in bilateral agreements/initiatives. | 4 | 4.12 |
| Degree to which, on a scale of 1 to 5, Canadian positions are reflected in multilateral agreements/initiatives. | 4 | 4.67 | |
| # of agreements concluded (including free trade agreements, air transport agreements and foreign investment promotion and protections agreements). | 10 | 27 |
Performance Analysis and Lessons Learned
In 2013-14, this program exceeded all three of its performance targets. DFATD engaged international partners to conclude a significant number of multilateral negotiations, agreements and initiatives that advanced Canada’s interests and values internationally, notably:
- agreement at the June 2013 G-8 Summit in Lough Erne to partner with resource-rich developing countries, the private sector and civil society to strengthen capacity and increase transparency in the extractive sector;
- a contribution of $28 million, announced by Prime Minister Harper at the March 2014 Nuclear Security Summit, enhancing the physical security of nuclear facilities and combating illicit trafficking of nuclear and radiological materials in Africa, the Americas, the Middle East and Southeast Asia demonstrated Canada’s leadership of international efforts to enhance nuclear security and prevent nuclear terrorism and promote implementation of UNSC Resolution 1540;
- passage of a UN General Assembly resolution, led by Canada, on the Situation of Human Rights in Iran, and the first-ever stand-alone resolution on child, early and forced marriage;
- interventions at the UN Human Rights Council to focus international attention on human rights violations in North Korea, Sri Lanka and Syria, and Canadian leadership of a resolution on the elimination of violence against women;
- a contribution of $15 million to international efforts to destroy Syria’s chemical weapons arsenal;
- a contribution of $5 million to the African-led international Support Mission to Mali, established under UNSC Resolution 2085 to support the Government of Mali against extremist forces;
- finalization of an agreement to keep the International Civil Aviation Organization headquarters in Montréal, as announced by Minister Baird in May 2013;
- the creation of an Arctic Economic Council, which will foster sustainable development, including economic growth, environmental protection and social development; and
- a $200 million low-interest loan was provided to stabilize Ukraine’s economy and support programming consistent with Canadian development priorities.
Bilateral and regional partners were engaged to achieve a number of agreements that advanced Canada’s economic and political interests internationally, including:
- the conclusion of the Comprehensive Economic and Trade Agreement with the EU, which is expected to add $12 billion annually to Canada’s economy and expand bilateral trade by 20 percent;
- negotiation with the EU of a Strategic Partnership Agreement, which will strengthen cooperation in a number of areas, including education, transport, energy and the Arctic;
- conclusion of a Canada-Korea Free Trade Agreement, announced by Prime Minister Harper in March 2014, which is predicted to add $1.7 billion annually to Canada’s economy and increase Canadian exports to South Korea by 32 percent;
- successful market access negotiations with China to reduce technical barriers for a range of Canadian products, including cherries, wheat, barley, soybeans, canola and live swine;
- finalization of Foreign Investment Promotion and Protection Agreements with Albania, Côte d’Ivoire, Guinea, Moldova, Nigeria and Serbia;
- conclusion or expansion of Air Transport Agreements/Arrangements with Algeria, Azerbaijan, Bangladesh, Burundi, China, Ecuador, Ethiopia, Haiti, Israel, Japan, Macedonia, Malaysia, Mexico, Mongolia, Panama, Peru, South Africa, Taiwan, Tanzania, Togo and Turkey;
- negotiation of a new pre-clearance agreement with the U.S. for air, land, marine and rail travel, in support of the Canada-U.S. Shared Vision for Perimeter Security and Economic Competitiveness, and four pieces of legislation were amended to facilitate the Regulatory Cooperation Action Plan;
- a Canada-U.S. Foreign Asset Tax Compliance Act Agreement;
- completion of the Third Canada-Mexico Joint Action Plan (2014-16), which prioritized sustainable economies, security, engagement and strengthened cooperation;
- conclusion of an extension for three years of the treaty between Canada and the United States on the harvesting of albacore tuna on the Pacific coast; and
- Canada and Senegal signed a mutual accountability framework to increase transparency and accountability for both partners on the development assistance provided to Senegal by Canada.
Sub-Program 1.2.1: Bilateral and Regional Diplomacy and Advocacy
Description: Through this sub-program, démarches, official visits, public diplomacy, and other access and advocacy initiatives are used to make bilateral and regional decision makers aware of Canada’s international policies and priorities. It delivers grants and contribution programs, such as Understanding Canada, International Scholarships, and Youth Mobility Programs, to support bilateral educational partnerships and improved awareness of Canada.
| Planned Spending | Actual Spending | Difference | Planned | Actual | Difference |
|---|---|---|---|---|---|
13 The variance is due to internal reallocation between programs. | |||||
| 130,381,957 | 152,357,912 | 21,975,95513 | 1,117 | 1,094 | -23 |
| Expected Result | Performance Indicator | Target | Result |
|---|---|---|---|
| Bilateral and regional foreign decision makers are aware of Canada’s international policies and priorities. | Degree to which, on scale of 1 to 5, key influencers were reached through events, visits and outreach programs. | 4 | 4.27 |
| Degree to which, on scale of 1 to 5, key influencers were engaged through events, visits and outreach programs. | 4 | 4.13 | |
| Degree to which, on scale of 1 to 5, protocol services facilitated interactions between Canadian and foreign decision makers. | 5 | 5 |
Performance Analysis and Lessons Learned
This sub-program met or exceeded all three of its performance targets for 2013-14. Extensive engagement in the United States promoted Canada’s role as a secure source of energy, comprising ten energy tours to raise U.S. awareness of Canada’s energy sector, including the oil sands, conventional oil and gas, uranium, clean coal, hydroelectricity and energy-related technology.
Canada-U.S. border issues were advanced through contributions to the Columbia River Treaty review and continued advocacy on the Canada-U.S. Shared Vision for Perimeter Security and Economic Competitiveness, Country of Origin Labelling and “Buy American” issues.
Defence cooperation was strengthened through regular, high-level Canada-U.S. security consultations, engagement with the Canada-U.S. Permanent Joint Board on Defence and support for the North American Aerospace Defense Command and the Tri-Command Framework for Arctic Cooperation.
DFATD led Canada’s Strategy for Engagement in the Americas, including over 30 high-level visits by the Prime Minister and Canadian ministers to increase mutual economic opportunity, address insecurity and strengthen institutions, and foster lasting relationships. This included deepening bilateral relations with key partners such as Brazil, Chile, Colombia, Mexico and Peru, as well as engagement with emerging regional trading blocs like the Pacific Alliance.
Canadian economic competitiveness and security interests were advanced at the North American Leaders’ Summit, as reflected in the Joint Leaders’ Statement. Relations with Mexico were deepened through bilateral cooperation and high-level visits, including by the Prime Minister.
Canada’s commitment to deepening regional economic, security, and governance partnerships in Asia was supported by more than 330 high-level visits, including by the Governor General, the Prime Minister, DFATD ministers, Cabinet members and numerous provincial premiers and ministers.
Several high-level visits to the Middle East, including by the Prime Minister, Minister Baird, and Minister Paradis underscored Canadian support for Israel and a two-state solution. Canada continued to provide support to the Palestinian Authority to encourage the resumption of peace talks, including hosting Palestinian Authority Foreign Minister Riyad Maliki in Ottawa.
Canada demonstrated international leadership on Iran’s nuclear program through three outreach visits to influential UN Security Council and International Atomic Energy Agency (IAEA) Board of Governors member capitals.
Minister Baird participated in the ASEAN-Canada Conference and ASEAN Regional Forum, where Canada contributed to regional security initiatives, including projects to counter illicit trafficking of chemical, biological, nuclear and radiological materials.
Canada demonstrated international leadership on democracy and the rule of law through strong support for Ukraine’s sovereignty and democratic choice in the context of Russian aggression, including imposing sanctions, restricting bilateral engagement with Russia, together with extensive programming advancing Ukraine’s democracy, security, and economic stability highlighted by high-level visits to Ukraine by Prime Minister Harper and Minister Baird.
Diplomatic protocol services were provided to the Governor General, the Prime Minister and DFATD ministers for official visits, including 50 official visits to Canada, 170 official visits abroad and 106 official diplomatic events within Canada.
Sub-Program 1.2.2: Summitry and Multilateral Diplomacy and Advocacy
Description: Through this sub-program, démarches, official visits, public diplomacy, and other access and advocacy initiatives are delivered to make summit and multilateral decision makers aware of Canada’s international policies and priorities.
| Planned Spending | Actual Spending | Difference | Planned | Actual | Difference |
|---|---|---|---|---|---|
14 The variance is mainly attributable to the unused funds for the Annual Voluntary Contribution to the UN Office on Drugs and Crime and internal reallocation of resources between programs. | |||||
| 73,555,543 | 68,639,124 | -4,916,41914 | 151 | 155 | 4 |
| Expected Result | Performance Indicator | Target | Result |
|---|---|---|---|
| Summit and multilateral decision makers are aware of Canada’s international policies and priorities. | Degree to which, on scale of 1 to 5, key influencers were reached through events, visits and outreach programs. | 4 | 4.27 |
| Degree to which, on scale of 1 to 5, key influencers were engaged. | 4 | 3.95 | |
| Degree to which, on scale of 1 to 5, protocol services facilitated interactions between Canadian and foreign decision makers at summit and multilateral events. | 5 | 5 |
Performance Analysis and Lessons Learned
Over the past year, this sub-program exceeded one of its performance targets, met one of its targets, and is on track to meet one of its targets by next year.
High-profile political diplomacy and advocacy, including by ministers Baird and Aglukkaq, was undertaken with European counterparts to build support for Canada’s Northern Strategy and for Canada’s Presidency of the Arctic Council (2013-15).
Canada’s UN priorities were communicated through Minister Baird’s September 2013 address to the UN General Assembly, including the human rights of women and girls, supporting a peaceful, democratic and pluralistic Syria and maintaining pressure on Iran to improve its human rights record and end its nuclear ambitions and support for terrorism. DFATD continued to encourage effective governance and value-for-money at the UN.
As donor chair of the Deauville Partnership Middle East and North Africa (MENA) Transition Fund, Canada supported the democratic and economic transition process in Arab countries in transition, including Egypt, Jordan, Libya, Morocco, Tunisia, and Yemen. Through the G-8’s Roma-Lyon Group, Canada advanced coordination on counter-terrorism, transnational crime and migration integrity.
Within the G-8 and G-20, Canada advocated for improved global standards in transparency on taxation and the extractives sector, the prevention of sexual violence, tackling the issue of child, early and forced marriage, global economic stability and anti-corruption, including by co-chairing the G-20 Anti-Corruption Working Group.
Canada demonstrated international leadership within the IAEA and the G-8/G-7 through strong factual and technical statements on Iran’s nuclear program.
Canada participated in the 2013 High Level Political Meeting of the Proliferation Security Initiative and reaffirmed its commitments to work with partners to enhance the capabilities and authorities required for effective weapons of mass destruction (WMD) interdiction. DFATD continued to co-chair the Sahel Working Group of the Global Counter-Terrorism Forum and hosted the Global Counter-Terrorism Forum Sahel Working Group meeting in June 2013. Canada assumed the Chair of the Inter-American Committee Against Terrorism of the Organization of American States (OAS), focusing the committee’s priorities and providing key financial support to OAS counter-terrorism and cyber security.
Security, freedom, democracy, human rights and the rule of law were advanced by DFATD through support for security system reform, high-level engagement, programming and advocacy in multilateral forums, including through the OAS, the UN and the Human Rights Council. DFATD addressed security crises in Africa, contributing $5 million to the UN trust fund to support the international mission led by the African Union in the Central African Republic. DFATD made a $10-million contribution through the UN and the African Union to support peace and security in Mali and lifted the suspension of direct aid to the Government of Mali in February 2014.
Over the past fiscal year, under the leadership of Minister Baird, DFATD coordinated Canada’s delivery of all the commitments made by the government to the International Civil Aviation Organization (ICAO) during the April-May 2013 retention campaign. These included the organization of an annual ministerial-level meeting with ICAO senior management and the implementation of an invigorated outreach program to the ICAO community.
Sub-Program 1.2.3: Contributions to International Organizations
Description: This sub-program enables timely payment of assessed and voluntary contributions and membership dues to maintain Canada’s access to over 40 international and multilateral organizations.
| Planned Spending | Actual Spending | Difference | Planned | Actual | Difference |
|---|---|---|---|---|---|
15 The variance is due to internal reallocation of contribution funds between programs. | |||||
| 496,752,276 | 522,093,069 | 25,340,79315 | 13 | 13 | 0 |
| Expected Result | Performance Indicator | Target | Result |
|---|---|---|---|
| Canada is able to access international organizations to contribute to and share responsibility for the management of international issues. | % of payments of assessed contributions to multilateral organizations of which Canada is a member that are paid in full. | 100% | 100% |
| % of payments of assessed contributions to multilateral organizations of which Canada is a member that are made on time. | 100% | 100% |
Performance Analysis and Lessons Learned
All performance targets for this sub-program were met in 2013-14. Canada was again on the UN’s Honour Roll for assessments paid in full and on time, and Canada also fully paid its assessed contributions to the Commonwealth and La Francophonie. The largest share ($214 million) of Canada’s 2013-14 assessed contributions went to support UN operations in Afghanistan, Cyprus, Côte d’Ivoire, Haiti, Kosovo, Liberia, South Sudan, Sudan and the Democratic Republic of Congo.
Canada made other substantial contributions, including:
- the Organization of La Francophonie ($14.4 million);
- the Organisation for Economic Co-operation and Development ($11 million);
- the Organization for Security and Cooperation in Europe ($11.9 million);
- the Organization of American States ($10.4 million);
- the International Criminal Court ($9.2 million); and
- the World Trade Organization (WTO) ($6.3 million).
For a full listing of all assessed contributions paid in 2013-14, please see Section 3 of this report.
Sub-Program 1.2.4: Trade Policy, Negotiations, Dispute Settlement and Controls
Description: Through this sub-program, DFATD works to mitigate market access barriers for Canadian industry by negotiating trade, investment and air transportation agreements, addressing trade policy issues through diplomacy and international dispute settlement mechanisms, and managing Canada’s international obligations under the Export and Import Permits Act to control trade in specific goods and technologies.
| Planned Spending | Actual Spending | Difference | Planned | Actual | Difference |
|---|---|---|---|---|---|
16 The variance is due to unused funds for the Softwood Lumber Litigations. | |||||
| 46,574,962 | 26,317,337 | -20,257,62516 | 254 | 261 | 7 |
| Expected Result | Performance Indicator | Target | Result |
|---|---|---|---|
| The negotiation of international trade agreements at the bilateral, regional and multilateral levels maintain or improve global market access for Canada. | Degree to which, on a scale of 1 to 5, progress was made in advancing negotiation milestones. | 4 | 5 |
| Market access barriers faced by Canadian industry abroad and international trade disputes are addressed or mitigated. | Degree to which, on a scale of 1 to 5, systemic market access barriers, disputes or other strategic policy issues were addressed in conjunction with partners, stakeholders and foreign interests. | 4 | 4 |
| Canada’s obligations to control trade in specific goods and technologies are met in accordance with established service standards. | % of permits and other documents processed in accordance with service delivery standards. | 94% | 94% |
Performance Analysis and Lessons Learned
Over the past year, this sub-program exceeded one and met two of its performance targets. In addition to the conclusion of the CETA and the Canada-Korea Free Trade Agreement DFATD enhanced market access for Canadian exporters by advancing a number of international bilateral and multilateral trade agreements, including free trade agreements (FTAs), foreign investment protection and promotion agreements (FIPAs) and air transport agreements.
We continue to focus on expanding relationships with dynamic and fast-growing economies around the world. Canada’s interests were advanced during negotiations with India, Japan and the countries of the Trans-Pacific Partnership.
Canada continued to promote a competitive air transport industry that meets the needs of travelling Canadians and businesses, by concluding or expanding Air Transport Agreements/Arrangements with Algeria, Azerbaijan, Bangladesh, Burundi, China, Ecuador, Ethiopia, Haiti, Israel, Japan, Macedonia, Malaysia, Mongolia, Panama, Peru, South Africa, Tanzania, Togo, Taiwan and Turkey.
The Canada-Chile FTA, a comprehensive agreement covering trade in goods and services that has been the cornerstone of Canada’s strong trade and investment relationship with Chile since 1997, was amended to reflect Canada’s more recent FTAs.
Canada and Israel launched negotiations to modernize and expand the Canada-Israel FTA, which will enhance bilateral trade by reducing technical barriers, enhancing cooperation, increasing transparency in regulatory matters and reducing transaction costs.
Canada advanced a more transparent and predictable investment environment for Canadian companies abroad by launching FIPA negotiations with Macedonia and Kenya and advancing Canadian interests in negotiations with nine additional FIPA partners (Burkina Faso, Ghana, India, Indonesia, Kazakhstan, Mongolia, Pakistan, Tunisia and Vietnam).
Canada’s nuclear industry was helped by bringing the Canada-India Nuclear Cooperation Agreement (NCA) into force, advancing negotiations on the Canada-Kazakhstan NCA, receiving Cabinet approval for the transfer of tritium removal technology to China, reviving an NCA negotiation process with South Africa, and making progress on modernizing NCAs with EURATOM and Romania in order to permit new sales. Canada joined 13 WTO members in negotiations toward a plurilateral agreement on environmental goods and contributed to the conclusion of the WTO Bali Package including the Trade Facilitation Agreement.
Canadian interests were advanced during six rounds of negotiations towards a Trade in Services Agreement (TISA), involving 23 WTO members aiming to further liberalize trade in services.
Following a WTO dispute settlement ruling, the Government of Canada continued to defend the interests of Canadian Inuit and sealing communities against the EU ban on seal products by appealing the decision to the WTO Appellate Body.
DFATD ensured that the administration of trade controls under the Export and Import Permits Act was managed effectively, including by processing over 431,000 export/import permit applications and meeting published service standards for over 94 percent of applications.
Sub-Program 1.2.5: International Assistance Program Governance
Description: Through this sub-program the governance of former DFAIT’s portion of the IAE is managed effectively. Its sub-sub-programs include DFATD’s Global Peace and Security Fund, the Global Partnership Program, Capacity Building Programs, the Investment Cooperation Program, the Canada Fund for Local Initiatives, and the Religious Freedom Fund. See Section 3 of this report for additional details on DFATD’s transfer payment programs.
| Planned Spending | Actual Spending | Difference | Planned | Actual | Difference |
|---|---|---|---|---|---|
17 The variance can be explained by the net incremental spending for all sub-sub-programs. | |||||
| 156,635,859 | 170,187,163 | 13,551,30417 | 63 | 97 | 34 |
| Expected Result | Performance Indicator | Target | Result |
|---|---|---|---|
| International assistance programming is leveraged to advance Canada’s values and interests abroad. | Degree to which, on a scale of 1 to 5, DFATD’s management of the International Assistance Envelope reflects Canadian international priorities. | 4 | 4 |
Performance Analysis and Lessons Learned
This sub-program met its performance target for 2013-14. Canada’s IAE was effectively managed, ensuring that international assistance programming was aligned with Government of Canada priorities and leveraged to advance Canada’s values and interests abroad. The integration of foreign policy and development considerations into decision making and program delivery was supported through collaboration and consultation with central agencies and other federal departments involved in the management of IAE funding.
Sub-Sub-Program 1.2.5.1: Global Peace and Security Fund
Description: This sub-sub-program improves crisis-response capacity in affected states, by the international community and the Government of Canada. It includes the Global Peace and Security Program, which supports timely and coherent programming in priority fragile states; the Global Peace Operations Program, which provides contributions to the G-7 global peace operations initiative to enhance global capacity for peace operations, with a focus on Africa; and the Glyn Berry Program, which funds projects that support democracy, the rule of law, and human rights.
| Planned Spending | Actual Spending | Difference | Planned | Actual | Difference |
|---|---|---|---|---|---|
18 The variance can be explained by Funding received through Supplementary Estimates B. | |||||
| 0 | 69,539,946 | 69,539,94618 | 0 | 33 | 33 |
| Expected Result | Performance Indicator | Target | Result |
|---|---|---|---|
| Institutions and civil society organizations in affected states are able to respond to crises. | Degree to which, on a scale of 1 to 5, the program contributes to develop capacities of institutions and civil society organizations in affected states to respond to crises in affected states. | 4 | 4 |
| The international community is able to respond to crises in affected states. | Degree to which, on a scale of 1 to 5, international consensus and coordination to respond to crises in affected states is achieved. | 4 | 4 |
| The Government of Canada is able to respond to crises in affected states. | Degree to which, on a scale of 1 to 5, the Government of Canada responded to crises in affected states in a timely manner. | 4 | 5 |
Performance Analysis and Lessons Learned
This sub-sub-program exceeded one and met two of its performance targets. The Global Peace and Security Fund programming provides timely, focused, effective and accountable international assistance in response to peace and security challenges which implicate Canadian interests and reflect Canadian foreign policy priorities. Through DFATD’s Stabilization and Reconstruction Task Force (START), Canada and the international community coordinated political and humanitarian responses to crises, such as Typhoon Haiyan in November 2013.
Jordanian security services managing Syrian refugees were provided assistance to transport refugees from the shared border to refugee registration centres. Funding was also provided to help address human rights violations against women, including the deployment of a gender advisor to the UN Commission of Inquiry on Syria.
DFATD supported peace and democratic reform in Burma by helping to enhance knowledge of decentralization, democracy and civil-military relations and improve Burmese political parties. Human rights and democratization in Iran was supported through funding for free, uncensored dialogues, including creation of an online platform for dialogue accessed by 4.5 million users inside Iran since May 2013.
Projects were also supported in Africa, including support for the African-led International Support Mission to the Central African Republic (MISCA). In the Americas, DFATD helped improve transparency awareness and practices amongst legislators and the executive branch, and bolster civil society groups’ abilities to monitor transparency issues in Paraguay.
Sub-Sub-Program 1.2.5.2: Global Partnership Program
Description: This sub-sub-program contributes to international security by developing capacities to secure and destroy weapons of mass destruction, employ former weapons scientists, and provide enhanced security and disease surveillance. It delivers grants and contributions programs to support projects in global partnership priority areas: the destruction of chemical weapons, dismantling of decommissioned nuclear submarines, nuclear and radiological safety, redirection of former weapons scientists and biological non-proliferation.
| Planned Spending | Actual Spending | Difference | Planned | Actual | Difference |
|---|---|---|---|---|---|
19 The variance is due to the unused funds for the Global Partnership Program. | |||||
| 73,050,036 | 52,839,540 | -20,210,49619 | 26 | 27 | 1 |
| Expected Result | Performance Indicator | Target | Result |
|---|---|---|---|
| Capacities of beneficiaries are developed or strengthened to secure, weapons and materials of mass destruction. | Degree to which, on a scale of 1 to 5, security and safety measure for storing and transporting weapons and materials of mass destruction were improved. | 4 | 4 |
| Capacities of beneficiaries are developed or strengthened to destroy and dispose of weapons and materials of mass destruction. | Degree to which, on a scale of 1 to 5, capabilities to detect, destroy, and reduce weapons and materials of mass destruction were improved. | 4 | 4 |
| Capacities of beneficiaries are developed or strengthened to counter WMD knowledge proliferation. | Degree to which, on a scale of 1 to 5, awareness, expertise, policies, and legislation to address threats or incidents related to weapons and materials of mass destruction were developed or enhanced. | 4 | 4 |
Performance Analysis and Lessons Learned
This sub-sub-program met all of its performance targets for 2013-14. The proliferation of weapons and materials of mass destruction was mitigated by securing and destroying chemical, biological, radioactive and nuclear materials. The IAEA was supported in its efforts to monitor Iran’s nuclear obligations, and two regional workshops were held in Central America and the Middle East to advance efforts to enhance the security of radioactive sources used in medical applications.
DFATD helped strengthen storage and bio-containment of dangerous infectious disease agents at vulnerable biological laboratories in Nigeria and Ghana and provided a Biosafety Level 3 laboratory to the Caribbean Public Health Agency to strengthen biological security. DFATD contributed $15 million through the Organisation for the Prohibition of Chemical Weapons and the U.S. Department of Defense to destroy Syria’s chemical weapons.
Sub-Sub-Program 1.2.5.3: Capacity Building Programs
Description: This sub-sub-program supports international security and stability by enhancing counter-terrorism and anti-crime capacities of beneficiary states, international organizations, government entities and regions. The Counter-Terrorism Capacity Building Program provides training, equipment, and expertise to build the capacity of beneficiary states to respond to terrorist activities. The Anti-Crime Capacity Building Program, focused on the Americas, enhances the ability of beneficiary states and international organizations to prevent and respond to threats posed by transnational organized crime.
| Planned Spending | Actual Spending | Difference | Planned | Actual | Difference |
|---|---|---|---|---|---|
20 The variance is due to the unused funds for the Afghanistan Counter-Narcotics Program | |||||
| 37,414,436 | 31,330,951 | -6,083,48520 | 17 | 17 | 0 |
| Expected Result | Performance Indicator | Target | Result |
|---|---|---|---|
| Personnel in beneficiary states are knowledgeable and skilled in anti-crime and counter-terrorism policies, procedures and enforcement. | Degree to which, on a scale of 1 to 5, projects aimed at increasing knowledge and skills of beneficiary state personnel in relation to anti-crime and counter-terrorism policies, procedures and enforcement met their objectives. | 4 | 5 |
| Beneficiary states have anti-crime and counter-terrorism legal instruments, controls and frameworks. | Degree to which, on a scale of 1 to 5, projects supporting the development, improvement and implementation of anti-crime and counter-terrorism legal instruments, controls and frameworks met their objectives. | 4 | 5 |
| Beneficiary states and international organizations have anti-crime and counter-terrorism tools, equipment, infrastructure and networks for prevention and response to criminal and terrorist activities in place. | Degree to which, on a scale of 1 to 5, projects supporting the provision of anti-crime and counter-terrorism tools, equipment, infrastructure and networks in beneficiary states and international organizations met their objectives. | 4 | 5 |
Performance Analysis and Lessons Learned
Over the past year, this sub-sub-program exceeded all of its performance targets. For example, through the Counter-Terrorism Capacity Building Program (CTCBP), DFATD supported regional anti-terrorism capacities in the Sahel, including counter-terrorism training and mentoring to enhance operational capacities, interoperability and civilian-military cooperation. Of note, the CTCBP provided $5 million for communications, logistics, facilities and vehicles for the African-led International Support Mission to Mali.
The Anti-Crime Capacity Building Program (ACCBP) funding supported efforts in the Americas to detect and intercept illicit drugs through the deployment of a Criminal Justice Advisor to Trinidad and Tobago, support to the Royal Canadian Mounted Police (RCMP) to deliver JetWay behavioural-based training in partnership with the OAS, and provision of communications and avionics equipment to enhance maritime surveillance and increase seizures. The ACCBP also strengthened the capacity of authorities in Southeast Asia to address human smuggling and trafficking operations.
Sub-Sub-Program 1.2.5.4: Investment Cooperation Program
Description: This sub-sub-program contributes to sustainable prosperity in developing countries. It works to enhance program partners’ awareness of business opportunities offered by developing-country markets, and improves project sustainability by supporting responsible, private-sector investment in developing countries to promote sustainable economic growth leading to poverty reduction.
| Planned Spending | Actual Spending | Difference | Planned | Actual | Difference |
|---|---|---|---|---|---|
21 For mt of toshe reporting period, the program was closed to applications as it is undergoing a re-design. | |||||
| 21,730,562 | 3,329,883 | -18,400,67921 | 10 | 10 | 0 |
| Expected Result | Performance Indicator | Target | Result |
|---|---|---|---|
22 Due to program suspension in 2012, only 5 companies undertook sustainability activities. | |||
| Potential and existing program partners pursuing business opportunities offered by developing country markets are well informed on program participation criteria. | % of recipients who considered that they had sufficient information to make a decision as to whether to proceed with investments. | 100% | 100% |
| Potential and existing program partners undertake efforts to improve the sustainability of their projects. | % of funded firms (phase 1 or 2) which undertook targeted activities to improve the sustainability of their investments. | 50% | Not available22 |
Performance Analysis and Lessons Learned
This sub-sub-program met one of its performance targets for 2013-14. Support was provided to 32 Canadian companies concerning productive investments in 16 developing countries, of which 24 indicated that they would proceed with investments. The number of Canadian companies supported by this work declined from 2013-14 due to the suspension of the program in 2012—with only five companies undertaking sustainability improvements in 2013-14.
Sub-Sub-Program 1.2.5.5: Canada Fund for Local Initiatives
Description: This sub-sub-program supports contributions, delivered through DFATD missions, to fund locally designed, small-scale international development projects. It helps beneficiary countries improve local capacities to support security and stability and encourage sustainable economic prosperity.
| Planned Spending | Actual Spending | Difference | Planned | Actual | Difference |
|---|---|---|---|---|---|
23 The variance is due to the unused funds for the Canada Fund for Local Initiatives. | |||||
| 19,514,133 | 11,642,917 | -7,871,21623 | 4 | 4 | 0 |
| Expected Result | Performance Indicator | Target | Result |
|---|---|---|---|
| Local stakeholders are aware of Canadian values and have enhanced capacities to support security and stability, crisis response efforts and community political-economic sustainability. | # of media mentions with items with messaging on Canada’s values and interests. | 1 per project | 38.6 per project |
| % of ‘significant project/partners’ still active 1 year after project completion. | 50% | 36% | |
| Ratio of participants benefiting from projects per funding allocated. | 50 x $10,000 | 2,663 x $10,000 |
Performance Analysis and Lessons Learned
This sub-sub-program exceeded two of its performance targets for 2013-14 (number of media mentions and number of participants benefiting from projects), demonstrating excellent value for money. As concerns the third target, initial indications suggest that close to 50% of projects/partners were still active one year after project completion. However, these results were impacted by the shift in responsibility to DFATD from former CIDA and as such full results for this indicator will be available next fiscal year.
Through the Canada Fund for Local Initiatives, DFATD supported 292 projects promoting freedom and human rights, including: religious freedom; lesbian, gay, bisexual, and transgender (LGBT) rights; the prevention of sexual violence; and child and early forced marriage; democratic transition, expanded democratic participation by women; entrenchment of the rule of law; and projects addressing urgent humanitarian needs. DFATD improved local participation in humanitarian assistance efforts, targeting communities affected by natural disasters and emergencies, through more than $642,000 in funding for projects presenting immediate responses to humanitarian emergencies such as Typhoon Haiyan.
Sub-Sub-Program 1.2.5.6: Religious Freedom Fund
Description: This sub-sub-program enhances international awareness regarding religious freedom and supports efforts to defend the freedom of religion and the beliefs of religious minorities. It helps defend religious minorities, monitors religious freedom, and calls attention to religious persecution.
| Planned Spending | Actual Spending | Difference | Planned | Actual | Difference |
|---|---|---|---|---|---|
24 The variance is due to internal reallocation of contribution funds between programs. | |||||
| 4,926,692 | 1,503,926 | -3,422,76624 | 6 | 6 | 0 |
| Expected Result | Performance Indicator | Target | Result |
|---|---|---|---|
| Partners and international stakeholders are aware of issues of religious freedom in targeted countries and regions. | # of activities, conferences or events on religious freedom and beliefs attended by the Ambassador for advocacy and outreach purposes. | baseline | 5 |
| Organizations (NGO’s, international, religious, and universities) in targeted counties have the capacity to address violations of freedom of religions or beliefs. | Degree to which, on a scale of 1 to 5, organizations have developed their capacity to support awareness, dialogue and expertise on freedom of religion or belief through research, education, conferences and workshops. | 4 | 5 |
| Degree to which, on a scale of 1 to 5, organizations have developed their capacity to provide training on freedom of religion or belief, including legal services to religious minorities and specialized services to their defenders. | 4 | 5 |
Performance Analysis and Lessons Learned
Canada’s Ambassador for Religious Freedom raised awareness regarding the promotion and defence of religious freedom worldwide through a number of activities including:
- domestic outreach and advocacy with Ottawa-based Ambassadors, religious leaders, diaspora groups, academics;
- bilateral engagement with 38 countries, including Hungary, Pakistan, Poland, Turkey, and Ukraine; and
- the issuance of statements and demarches calling attention to egregious violations of religious freedom, including in Iran, Iraq, Pakistan, Sri Lanka and Syria.
The Religious Freedom Fund was implemented and fully operational in August 2013. During the last 6 months of the fiscal year, 14 projects were identified, developed and/or approved. These projects aimed at improving the dialogue between religious communities to promote tolerance and pluralism, research and monitoring of violence or actions against religious communities, improving access to justice for targeted religious communities or support to constitutional changes to improve religious freedom. Inception missions to Bangladesh, Burma, Hong Kong, Nigeria, Pakistan, and Poland took place to meet with officials and identify partners for the Religious Freedom Fund in these countries.
Strategic Outcome 2: International Services for Canadians - Canadians are satisfied with commercial and consular services.
Program 2.1: International Commerce
Description: Through this program, DFATD delivers commercial services and advice to Canadian business and supports its pursuit of international business opportunities.
| Main Estimates 2013-14 | Planned Spending 2013-14 | Total Authorities 2013-14 | 2013–14 Actual Spending (authorities used) | 2013–14 Difference (actual minus planned) |
|---|---|---|---|---|
25 Actual spending was $2.7 million higher than planned spending due to supplementary funding received for the implementation of the Global Markets Action Plan. | ||||
| 154,135,950 | 154,135,950 | 160 918 756 | 156,811,145 | 2,675,19525 |
| Planned 2013-14 | Actual 2013-14 | Difference 2013-14 |
|---|---|---|
| 1,378 | 1,219 | -87 |
| Expected Result | Performance Indicator | Target | Result |
|---|---|---|---|
26 These results are unavailable as a result of incomplete data capture due to a changeover of reporting systems. | |||
| Canadian exporters, innovators, and investors are successful in their international business development efforts. | # of concluded agreements facilitated by the Trade Commissioner Service. | 1,000 | Not available26 |
| % of clients who were satisfied with commercial services provided by the Trade Commissioner Service. | 75% | 85% | |
| Foreign direct investment is facilitated, expanded or retained. | # of successful FDI projects (Wins) facilitated by the Trade Commissioner Service. | 100 | 146 |
Performance Analysis and Lessons Learned
In November 2013, the Government of Canada launched Canada’s Global Markets Action Plan, an ambitious pro-trade, pro-export plan to support Canadians through the pursuit of deeper trade and investment ties with many of the largest, most dynamic and fastest-growing markets in the world.
The Global Markets Action Plan also includes a new trade promotion plan that entrenches the concept of “economic diplomacy” as the driving force behind the Government of Canada’s activities through its international network of missions abroad.
The prosperity of Canadians depends on economic expansion beyond Canada’s borders into new markets that serve to grow Canada’s exports and investments. In support of international business development and foreign direct investment (FDI), the international commerce program exceeded its performance targets for nine of eleven performance indicators.
Throughout the year, DFATD’s Trade Commissioner Service (TCS) worked with Canadian clients to conclude a total of 775 commercial agreements. The TCS also facilitated 146 successful FDI projects, which led to $3.65 billion in investments and an estimated 5,543 new jobs within Canada.
In January 2014, Minister Fast launched DFATD’s International Education Strategy to maintain and enhance Canada’s global position in education. The strategy seeks to attract more international researchers and students to Canada, deepening the research links between Canadian and foreign educational institutions. Over the past year, this strategy supported more than 170 education fairs abroad, resulting in a substantial increase in the number of international students in Canada. DFATD also provides promotion and coordination support to Mitacs, a national not-for-profit organization that received a federal contribution to help the next generation of innovators develop vital scientific and business skills through two-way research and training opportunities
The enhanced Canadian Technology Accelerators (CTA) initiative was approved under the Global Markets Action Plan. In March, a pilot CTA program—CTA@India—was launched simultaneously in Canada and India for a total of 8 CTAs active in 2013-14 in key global markets. A total of 104 TCS clients (SMEs) participated in CTA activities in 2013-2014. Clients reported a combined total of $29 million in additional capital raised through this initiative.
Minister Fast led a trade mission to China and Japan, which included 18 Canadian companies and organizations, to collaborate with Chinese and Japanese companies and institutions in the information and communications technologies and medical imaging sectors.
Commercial relations with Asia were further enhanced through the first meeting of the Canada-ASEAN Business Forum, a major initiative of the Canada-ASEAN Business Council to expand private-sector cooperation between Canadian and Southeast Asian businesses.
Minister Paradis led the Canadian delegation to the Indaba mining conference where he met with African ministers, Canadian mining industry representatives, and South African government officials to build greater cooperation in the extractives sector.
Sub-Program 2.1.1: International Business Development
Description: This sub-program helps link Canadian business clients to services, contacts and leads that increase access to international commerce opportunities.
| Planned Spending | Actual Spending | Difference | Planned | Actual | Difference |
|---|---|---|---|---|---|
| 120,133,152 | 118,920,393 | -1,212,759 | 1,351 | 1,234 | -81 |
| Expected Result | Performance Indicator | Target | Result |
|---|---|---|---|
27 These results are unavailable as a result of incomplete data capture due to a changeover of reporting systems. | |||
| Canadian business clients gain access to services, contacts and leads that increase access to international commerce opportunities. | # of business/trade leads disseminated. | 5,000 | Not Available27 |
| % of clients actively pursuing commercial agreements_ | 50% | 61% | |
| % of clients indicating the Trade Commissioner Service helped them connect with customers, partners or other contacts who otherwise would have been difficult to identify/access. | 60% | 64% | |
Performance Analysis and Lessons Learned
Over the past year, the TCS helped disseminate nearly 4,000 business/trade leads to potential Canadian clients, with 61 percent of those clients actively pursuing commercial agreements. Over 60 percent of clients reported that the TCS helped their international business-development efforts.
The TCS network was expanded to include officers co-located within Canadian industry associations across the country, enhancing the Government of Canada’s knowledge and understanding of key sectoral opportunities and challenges and increasing the accessibility of TCS services for businesses across Canada. The Global Opportunities for Associations program disbursed over $3 million to 39 industry associations for international business development activities, increasing the associations’ ability to access opportunities in foreign markets.
Canada’s reputation as a responsible and reliable supplier of resources and related technology was enhanced through Canada’s flagship resource shows, the Prospectors & Developers Association of Canada convention and the Global Petroleum Show, where the TCS introduced Canadian suppliers and expertise to targeted buyers from around the world. Canada’s network of trade commissioners abroad conducted over 2,500 outreach calls in the mining, oil and gas, and forest products sectors in 2013-14.
Through the global value chains initiatives, the TCS, in cooperation with Export Development Canada (EDC), targeted and uncovered trade/supply chain opportunities for Canadian SMEs with multinational enterprises. Coordinated buyers programs were organized with EDC at key events, including the Globe, Mobile World Congress and Singapore International Water Week.
DFATD, in collaboration with the Canadian Commercial Corporation, EDC and other departments including the Department of National Defence, developed the Export Strategy for the Defence Procurement Strategy, launched in February 2014, which supports international sales opportunities and participation in global value chains.
Consistent with the changes announced in the Global Markets Action Plan, going forward this sub-program will increase its focus on the promotion of exports and trade in Canada and abroad. By increasing the visibility of the Government’s trade promotion tools, including the Trade Commissioner Service, Export Development Canada and the Canadian Commercial Corporation, Canadian companies will be better placed to compete in the global marketplace.
Sub-Program 2.1.2: Foreign Direct Investment in Canada
Description: This sub-program helps ensure that foreign investors are aware of Canada as a competitive investment location and supports efforts to ensure that foreign direct investment (FDI) is facilitated, expanded or retained.
| Planned Spending | Actual Spending | Difference | Planned | Actual | Difference |
|---|---|---|---|---|---|
| 23,788,907 | 24,187,852 | 398,945 | 20 | 18 | -2 |
| Expected Result | Performance Indicator | Target | Result |
|---|---|---|---|
| Foreign investors are aware of Canada as a competitive investment location. | # of participants at investment-specific events. | 400 | 1,612 |
| % of participants who increased their awareness of Canada as a competitive investment location. | 75% | 92% | |
| Foreign investors demonstrate interest in Canadian investment locations. | # of investment visits to Canada facilitated by the Trade Commissioner Service. | 175 | 316 |
Performance Analysis and Lessons Learned
Foreign investors’ knowledge and awareness of Canadian investment opportunities was increased over the past year. Through DFATD’s FDI Program, meetings were conducted that reached over 1,600 participants and assistance was provided to arrange for 316 exploratory visits to Canadian companies by prospective foreign investors.
A total of 593 companies attended investment FDI outreach seminars in Europe and Asia, and of those, 276 companies were identified as leads or prospects. Of the 358 companies that attended investment-specific events that were held on the margins of global events, 128 companies were identified as leads or prospects. The FDI program supported 21 mission-led investment events, resulting in 198 investment leads and prospects, securing 194 business meetings and facilitating seven investment projects.
Through the FDI program, senior private sector executives in priority sectors and markets delivered 103 Investment Champions speaking engagements, generating 205 leads and 89 prospects. The program promoted Canada as an investment location at 14 signature events, including the Chinese Enterprise Overseas Investment Conference, the APEC CEO Summit, the IESE Business School’s Global Alumni Reunion and the World Economic Forum.
The Invest Canada-Community Initiatives program supported 358 projects, helping 83 municipalities and community organizations in every region of Canada attract, retain and expand FDI.
The new Foreign Trade Zones-Marketing Program (FTZ-MP), part of the Global Commerce Support Program, was launched. This program is designed to provide funding to support Canadian regional organizations and non-profit organizations in their promotion of local FTZ-MP type benefits to attract FDI.
Sub-Program 2.1.3: International Innovation, Science and Technology
Description: This sub-program helps Canadian business clients gain access to networks, partners and resources that enhance their ability to innovate.
| Planned Spending | Actual Spending | Difference | Planned | Actual | Difference |
|---|---|---|---|---|---|
28 The variance is due to internal reallocation within the International Commerce program. | |||||
| 10,213,891 | 13,702,900 | 3,489,00928 | 43 | 39 | -4 |
| Expected Result | Performance Indicator | Target | Result |
|---|---|---|---|
29 At the request of the program this target was adjusted from 750 to 250. | |||
| Canadian clients gain access to networks, partners and resources that enhance their ability to innovate. | # of international research and innovation partnerships facilitated by the TCS. | 100 | 110 |
| # of international research innovation leads disseminated. | 25029 | 260 | |
Performance Analysis and Lessons Learned
To ensure Canadian businesses remained at the leading edge of innovation, the TCS exceeded its target last year, disseminating 260 innovation leads and facilitating 110 international research and innovation partnerships.
Canada co-chaired key bilateral science and technology meetings with Brazil, China, France, Germany and India to highlight Canada’s excellence in science, technology and innovation to increase innovation and investment opportunities. Bilateral meetings were leveraged to support the Government of Canada’s objectives, and related action plans were developed for priority countries to support enhanced commercial outcomes.
Increased innovation successes were facilitated in knowledge-intensive, export-driven sectors aligned with the Global Markets Action Plan by strengthening strategic engagement with the National Research Council, implementing the Trade Commissioner Service/Industrial Research Assistance Program client service delivery model and formalizing cooperation with key partners (e.g. a memorandum of understanding with Canadian Digital Media Network, the Association of University Research Parks Canada and the Canada Science and Technology Museum Corporation) to facilitate access by Canadian businesses to international technology networks, partners and resources to enhance their ability to compete, innovate and secure new markets.
Program 2.2: Consular Services and Emergency Management
Description: Through this program, DFATD delivers consular services and advice to Canadians and provides a coordinated Government of Canada’s response to emergencies abroad affecting Canadians.
| Main Estimates 2013-14 | Planned Spending 2013-14 | Total Authorities 2013-14 | 2013-14 Actual Spending (authorities used) | 2013–14 Difference (actual minus planned) |
|---|---|---|---|---|
| 46,582,770 | 46,582,707 | 55,257,695 | 54,306,686 | 7,723,916 |
| Planned 2013-14 | Actual 2013-14 | Difference 2013-14 |
|---|---|---|
30 The variance in 2013-14 is a result of internal reallocation due to the increasing demand for consular and emergency management services throughout the year. | ||
| 319 | 354 | 3530 |
| Expected Result | Performance Indicator | Target | Result |
|---|---|---|---|
| Canadians are better informed and well prepared to travel safely and responsibly, and receive satisfactory assistance abroad. | Ratio of Canadians travelling abroad in distress situation. | 3/100,000 (for cases per visits to the U.S.). 38/100,000 (for cases per visits outside the U.S.). | 3/100,000 (for cases per visits to the U.S.). 33/100,000 (for cases per visits outside the U.S.). |
| % of Canadians satisfied with routine consular services. | 90% | 96% | |
| % of Canadians satisfied with the Emergency Watch and Response Centre (EWRC) service delivery. | 75% | 80% |
Performance Analysis and Lessons Learned
Over the past year, Canadians traveling abroad were provided with access to up-to-date travel, safety and security information and the best possible consular services abroad. All performance indicators used by the department to assess the performance of this program exceeded their targets.
In addition to handling routine and distress related cases, DFATD responded to 55 emergencies worldwide, providing 2,300 affected Canadians with emergency consular assistance and information including up-to-date travel advice through travel.gc.ca. In this context, DFATD, under the leadership of Minister of State Yelich, modernized Canada’s approach to consular services through the 21st Century Consular Plan, which features four key initiatives 1) Focus on Children; 2) Targeted Outreach; 3) Go Digital!; 4) Strengthen our response network. The new plan focuses attention on helping those who truly need it most, offering assistance more efficiently, better educating Canadians on how to make smart travel decisions, with the goal of reducing consular issues before they arise and improving the alignment of resources to address complex consular cases.
A Vulnerable Children’s Consular Unit was established in November 2013 and staffed with four specialized policy analysts and five case-management officers dedicated to children’s and family issues. The Unit has since opened over 500 cases related to abandoned, mistreated or abducted children.
Close cooperation between Canada and the United States, the United Kingdom, Australia and New Zealand enhanced the department’s capacity to respond to distress cases and international emergencies through sharing of best practices and extending DFATD’s reach through partners’ networks and capacities. This cooperation was essential for the timely evacuation of Canadians from Juba, South Sudan, and in efforts to search for Canadians in countries affected by Typhoon Haiyan.
Sub-Program 2.2.1: Safe Travel Promotion
Description: This sub-program helps ensure Canadians travelling abroad receive timely and accurate information on travelling safely and responsibly.
| Planned Spending | Actual Spending | Difference | Planned | Actual | Difference |
|---|---|---|---|---|---|
31 The variance is mainly due to additional funding received through TB Central Votes (i.e. Budget Carry Forward amounts from 2012-13 to 2013-14). | |||||
| 760,530 | 858,422 | 97,89231 | 7 | 7 | 0 |
| Expected Result | Performance Indicator | Target | Result |
|---|---|---|---|
| Canadians travelling abroad receive timely and accurate information on travelling safely and responsibly. | % increase in the number of subscribers to travel updates. | 15% | 21% |
| # of followers (in follower base) for the combined travel social media channels. | 2,000 | 17,105 |
Performance Analysis and Lessons Learned
Canadians were provided with safe travel information through DFATD’s Travel.gc.ca website, which produced 2,000 plus updates to its country-specific Travel Advice and Advisories pages ensuring Canadians were provided with the most up-to-date information and advice. To reflect the rapidly changing security risks abroad, travel advisories were updated 75 plus times over the course of the year.
The number of visitors to Travel.gc.ca increased by 1.2 million from last fiscal year, demonstrating strong public awareness of the website. DFATD Travel twitter account followers increased by 332 percent to 17,105 followers.
Canadian missions abroad issued 721 mass emails to Canadians abroad who registered with the Registration of Canadians Abroad service informing them of emergency incidents in the countries they were visiting or providing advice on emergency preparedness.
Sub-Program 2.2.2: Consular Assistance for Canadians
Description: This sub-program provides Canadians in distress abroad with consular assistance and routine citizenship, passport and consular services through Canada’s network of missions abroad.
| Planned Spending | Actual Spending | Difference | Planned | Actual | Difference |
|---|---|---|---|---|---|
32 The variance is mainly due to additional funding received through TB Central Votes (i.e. Budget Carry Forward amounts from 2012-13 to 2013-14) and the Temporary Resident Initiative. | |||||
| 23,394,657 | 27,909,792 | 4,515,13532 | 274 | 304 | 30 |
| Expected Result | Performance Indicator | Target | Result |
|---|---|---|---|
| Canadians in distress abroad receive consular assistance consistent with published service standards. | % of distress cases that meet established service standards (arrest/detention visits standards). | 90% | 95% |
| % of distress cases actioned within 24 hours (all distress cases). | 85% | 87% | |
| Canadians abroad receive routine citizenship, passport, and consular services consistent with published service standards. | % of clients responding satisfactorily regarding the quality of services (timeliness of services, accuracy of information and courteousness of staff). | 90% | 95% |
Performance Analysis and Lessons Learned
Over the past year, DFATD handled over 234,000 consular cases, including some 6,100 related to Canadians in distress situations travelling or living abroad.
Consular and emergency management services for Canadians were enhanced with the creation of a new Watch Unit in May 2013 to provide early detection of emergency and security events that could impact the safety and security of Canadians, Canadian missions or Canadian interests abroad. This new unit also ensures timely notification of stakeholders and senior management of incidents and provides the main communications channel when an international crisis unfolds.
DFATD began standardizing its consular services throughout the United States to increase efficiency and focus on value-added activities, such as outreach or complex case management. The Consular Training Program was enhanced including through specialized regional training for consular officials in Africa and Latin America which led to some 310 employees trained on consular and passport management issues including 47 Heads of Missions and 7 Management Consular Officer recruits.
Sub-Program 2.2.3: Emergency Preparedness and Response
Description: This sub-program enables Canadians abroad to receive timely and appropriate emergency consular services, and maintains a whole-of-government capacity to respond to international emergencies in a timely and coordinated manner.
| Planned Spending | Actual Spending | Difference | Planned | Actual | Difference |
|---|---|---|---|---|---|
33 The variance is mainly due to additional funding received through TB Central Votes (i.e. Budget Carry Forward amounts from 2012-13 to 2013-14, and Paylist Expenditures). | |||||
| 22,427,583 | 25,538,472 | 3,110,88933 | 38 | 43 | 5 |
| Expected Result | Performance Indicator | Target | Result |
|---|---|---|---|
| Canadians abroad receive timely and appropriate emergency consular services. | % of calls to which the Emergency Watch and Response Centre responded that met established service standards. | 80% | 95% |
| % of Registration of Canadians Abroad (ROCA) messages sent to registrants according to established standards. | 100% | 100% | |
| Whole-of-government capacity to respond to international emergencies in a timely and coordinated manner is maintained. | Degree to which, on a scale of 1 to 5, the emergency planning tools, procedures and mechanisms are implemented in responding to an emergency. | 3 | 5 |
Performance Analysis and Lessons Learned
Over the past year, DFATD responded to 55 emergencies worldwide, assisting 2,300 affected Canadians through its Emergency Watch and Response Centre, which prepared daily briefs and received over 67,770 calls seeking consular assistance and information, including up-to-date travel advice. The Emergency Watch Centre provides assistance to Canadians abroad seven days a week, 24 hours a day.
To ensure DFATD is able to respond to critical incidents affecting Canadians or Canadian interests abroad, the department further strengthened its Standing Rapid Deployment Team (SRDT), which now includes 80 skilled and experienced officers who can be deployed within hours to respond to international emergency situations. Over the past year, 18 SRDT members were deployed to respond to situations in Kenya, the Philippines, South Sudan and Ukraine.
To support the Government of Canada’s mandate to respond to emergencies/major international events, the DFATD led Interdepartmental Task Force was activated in seven instances: the Sochi 2014 Olympic and Paralympic Winter Games, the demonstrations in Cairo, Egypt, and Kiev, Ukraine, unrest in Juba, South Sudan, the aftermath of Typhoon Haiyan in the Philippines and terrorist attacks in Nairobi, Kenya, and Boston, United States.
An enhanced emergency management training program was developed and implemented including:
- 40 emergency management training sessions and semi-live exercises delivered at missions abroad;
- 800 personnel trained through various security courses at missions abroad and at headquarters.
Strategic Outcome 3: International Development and Humanitarian Assistance - Reduction in poverty for those living in countries where Canada engages in international development.
Program 3.1: Fragile Countries and Crisis-affected Communities
Description: Fragile states and crisis-affected communities face severe development challenges due to conflict, instability and natural disasters within complex national and regional contexts. This program supports short-term initiatives to ensure access to essential humanitarian services for crisis-affected populations, and medium- to long-term activities to foster sustainable economic growth and build the foundation for effective governance and delivery of basic services.
| Main Estimates 2013-14 | Planned Spending 2013-14 | Total Authorities 2013–14 | 2013–14 Actual Spending (authorities used) | 2013–14 Difference (actual minus planned) |
|---|---|---|---|---|
| 590,680,214 | 690,680,214 | 971,317,978 | 866,291,228 | 175,611,014 |
| Planned 2013-14 | Actual 2013-14 | Difference 2013-14 |
|---|---|---|
34 Sub-program and Sub-sub-program allocation excludes 15 FTEs for branch corporate services allocated to Fragile countries and Crisis-affected Communities. | ||
| 155 | 103 | -52 |
| Expected Result | Performance Indicator | Target | Result |
|---|---|---|---|
| Increased access to essential health services and education by the more vulnerable female and male children and youth in crisis-affected communities. | % of children under five receiving appropriate and timely treatment for malaria and other major diseases. | By 2015, halt malaria and start to reverse its incidence and other major diseases, by country (MDG 6.C). | Not available |
| % of vulnerable or crisis-affected girls and boys enrolled in school. | By 2015, ensure that boys and girls alike will be able to complete a full course of primary school, by country (MDG 2.A). | Not available | |
| Increases access to income opportunities including jobs and development of micro and small enterprises, particularly for vulnerable and marginalized women, men and youth. | % of economically-active women, men and youth employed. | By 2015, achieve productive employment opportunities including women, men and youth, by country (MDG 1.B)_ | 15+, female: 46.9% 15+, male: 74.6% 15-24, female: 34% 15-24, male: 50.6% |
| Enhanced responsiveness of humanitarian assistance to address the immediate needs of crisis-affected populations. | % of Consolidated Appeals funding requirements that are met. | 60% | 65% |
Performance Analysis and Lessons Learned
In 2013-14, humanitarian needs arising from natural disasters, food insecurity and conflict reached record levels. The 2013 United Nations humanitarian appeal initially requested $8.4 billion to meet global humanitarian needs. The global appeal was increased to $12.8 billion in response to growing needs related to the conflict in Syria. Despite the size of the appeal and the ongoing difficult fiscal environment for donor countries, the global response exceeded the target by 5 percent.
Sub-Program 3.1.1: Humanitarian Assistance
Description: This sub-program provides humanitarian assistance to populations affected by armed conflict and/or natural disasters. Through funding to experienced humanitarian partners, Canada supports the provision of food, water and sanitation, emergency medical care, shelter, and protection for the most vulnerable, as well as coordination and logistics for humanitarian operations.
| Planned Spending | Actual Spending | Difference | Planned | Actual | Difference |
|---|---|---|---|---|---|
35 The actual FTEs used to deliver results for this sub-program are indicated at the program level 3.1. | |||||
| 506,024,694 | 634,422,549 | 128,397,855 | 4 | 035 | -4 |
| Expected Result | Performance Indicator | Target | Result |
|---|---|---|---|
| Improved effectiveness (leadership and coordination, accountability, emergency preparedness and advocacy) of humanitarian action by the international humanitarian system. | Degree to which, on scale of 1 to 5, progress has been made against the four reform areas identified by the Inter-Agency Standing Committee principles. | 3 | 3 |
Performance Analysis and Lessons Learned
Over the past year, as global humanitarian needs reached record levels, DFATD responded with its largest contribution to date in humanitarian assistance, including food assistance, to communities affected by conflict and food insecurity in 54 countries, and by natural disasters in 25 countries. As in previous years, countries affected by conflict received most of Canada’s humanitarian assistance, with the largest response directed to humanitarian needs arising from the conflict in Syria where Canada’s contribution to humanitarian appeals enabled the UN World Food Programme to distribute emergency food assistance to as many as 5.2 million conflict affected people in 2013. In 2014 WFP is planning to distribute food assistance to more than 7 million conflict affected people. Assistance for some 3 million Syrian refugees in neighbouring countries was provided through the UN High Commissioner for Refugees. Significant humanitarian responses to other conflict-related emergencies included those in South Sudan and the Central African Republic.
DFATD played a leading role in international relief efforts when Typhoon Haiyan struck the Philippines in November 2013. Notably, Canada was one of the first countries to respond to the devastating impact of the storm. Support through UN agencies, the International Federation of Red Cross and Red Crescent Societies and Canadian non-governmental organizations helped to meet urgent food, water, sanitation, shelter and medical needs.
In reaction to the crisis in the Central African Republic, which left almost 1 million people displaced by violence, DFATD provided support through partners to address emergency needs. The department also worked with experienced multilateral partners to deliver assistance to those in need in South Sudan, Sudan, the Democratic Republic of Congo and Colombia, with a focus on the protection of refugees and displaced people.
The WFP reached 80.9 million beneficiaries in 2013. This number exceeded the 71 million anticipated in WFP’s Management Plan (2013–2015), thus exceeding its target by 110%. A scaled-up response was required to meet the needs of the 7 million beneficiaries affected by multiple emergencies in 2013-14, including in the Philippines and Syria. Globally, the WFP distributed 3.1 million metric tons of food and US$506 million in cash and voucher transfers.
Sub-Program 3.1.2: Afghanistan
Description: This sub-program focuses on education, maternal, newborn and child health, human rights, and humanitarian assistance—with a particular focus on women, girls, and boys.
| Planned Spending | Actual Spending | Difference | Planned | Actual | Difference |
|---|---|---|---|---|---|
| 72,919,193 | 91,516,897 | 18,597,704 | 49 | 29 | -20 |
| Expected Result | Performance Indicator | Target | Result |
|---|---|---|---|
| Increased access for girls and boys to learning opportunities that meet their different priorities and interests. | Gross enrolment of students in general education at the national level disaggregated by sex. | 7.8 million by 2014 | 7.7 million |
Performance Analysis and Lessons Learned
Significant progress was made toward achieving the target for this sub-program. DFATD continued to empower women, youth and children through education and health programming in Afghanistan. Against a target of 7.8 million, a total of 7.7 million Afghan children, almost 40 percent of whom are girls, are now enrolled in formal and community-based schools, up from only one million boys (and no girls) in 2001. Over 8,400 girls were enrolled in school in four Afghan provinces, and 99 percent of the first cohort completed Grade 12 levels by the end of 2013 with the help of DFATD funding.
Through contributions to the World Bank Education Quality Improvement Project, the Afghan Ministry of Education improved access to quality education for girls through the repair and construction of over 1,800 formal schools. Since 2011, over 187,000 Afghan teachers received training, and more than 6,000 scholarships were awarded to women enrolled in teacher training colleges.
Sub-Program 3.1.3: Haiti
Description: This sub-program focuses on sustainable economic growth, rule of law, democratic governance, and continued support for the health and welfare of Haitian women and youth, with a focus on maternal, newborn and child health.
| Planned Spending | Actual Spending | Difference | Planned | Actual | Difference |
|---|---|---|---|---|---|
| 50,718,902 | 63,652,673 | 12,933,771 | 49 | 31 | -18 |
| Expected Result | Performance Indicator | Target | Result |
|---|---|---|---|
| Increased agricultural production. | Net per capita agricultural production index. | 100 by 2015 | 106.64 |
| Improved population access to health services. | % of women aged 15-49 monitored during pregnancy (at least four antenatal visits). | 53.8% by 2012 | 67.3% |
Performance Analysis and Lessons Learned
In 2013-14, DFATD’s development programming in Haiti exceeded its performance targets, despite the country’s weak governance, difficult political dynamics and extreme vulnerability to natural disasters. Targets for agricultural production and access to health care were surpassed.
Food security was improved through support for local agricultural production, with $8.9 million in agricultural credit disbursed through 19 locations in 2013-14. To date, more than 9,600 Haitian agribusinesses (28 percent women-owned) have benefited from the provision of $12.3 million in agricultural credit, supporting increased agricultural production.
Efforts to strengthen the Haitian health care system have included support for 130 vaccination centres, hospitals and other institutions. DFATD’s support has increased access to health care facilities for women and children. As of March 2014, more than 72,000 pregnant women and 212,000 children under five received free medical treatment over a period of 18 months.
Through $20 million in Canadian funding to the International Organization for Migration, 5575 Haitian families (or some 20,000 people) were successfully resettled from camps in the Champs de Mars into secure housing (50 percent of families assisted are headed by women). As of March 31, 2014, over 4300 families have been resettled.
Sub-Program 3.1.4: South Sudan
Description: This sub-program supports work in South Sudan as part of the Muskoka Initiative on Maternal, Newborn and Child Health, as well as in the areas of food security and improved governance. It also supports access to basic life-saving services, economic resources, technical knowledge and skills, and humanitarian assistance.
| Planned Spending | Actual Spending | Difference | Planned | Actual | Difference |
|---|---|---|---|---|---|
| 15,162,080 | 18,925,817 | 3,763,737 | 22 | 16 | -6 |
| Expected Result | Performance Indicator | Target | Result |
|---|---|---|---|
| Increase use of quality maternal, newborn and child health services by women, children and newborns in targeted areas. | # of safe deliveries by skilled birth attendants. | 80,000 by 2015 | 30,456 |
Performance Analysis and Lessons Learned
Political power struggles and unresolved conflict tipped the country towards a crisis in December 2013. As the impact of the quickly evolving crisis on development programming was assessed, disbursements were affected. Most development initiatives were able to adjust their approach in order to continue to meet pressing needs. However, projects in the more severely affected areas were interrupted due to insecurity.
Despite challenges faced in 2013–14, development programming was able to make progress against targets. In efforts to improve maternal, newborn and child health service delivery, more than 1,152,376 children under the age of five received preventive and curative health services; Vitamin A supplements were provided to 118,700 children under the age of five; 98,642 pregnant women received antenatal care; and trained health workers, including midwives, supervised over 30,456 safe deliveries.
Through food for work activities, beneficiaries increased and diversified their agricultural production, built community assets (such as community gardens) and filled short-term food gaps, all of which is helping avoid a potential famine as a result of the insecurity. More than 15,717 households were employed and 109,994 beneficiaries were supported. Additionally, 7,230 households were supported to increase crop and vegetable production, benefitting approximately 50,610 people.
Up until the crisis erupted in December 2013, efforts to strengthen governance structures in South Sudan saw approximately 575 civil servants trained on public financial management. Improvement to the South Sudan Electronic Payroll System removed approximately 11,000 ghost workers from state payrolls.
In September 2014, Minister Baird announced that the Office of the Embassy located in Juba would be upgraded to full embassy status with a full-time ambassador.
Sub-Program 3.1.5: West Bank and Gaza
Description: This sub-program supports sustainable economic growth (West Bank), food security (Gaza and West Bank), and justice-sector reform (West Bank) and reflects government of Canada development priorities in the region prior to the Israel-Hamas conflict in 2014.
| Planned Spending | Actual Spending | Difference | Planned | Actual | Difference |
|---|---|---|---|---|---|
| 44,077,195 | 55,995,142 | 11,917,974 | 16 | 12 | -4 |
| Expected Result | Performance Indicator | Target | Result |
|---|---|---|---|
| Increase effectiveness (transparency, equitability and predictability) of justice system institutions and processes. | Perception of criminal justice practitioners on effectiveness of the justice system (on a scale from “poor” to “good” for transparency, equitability and predictability). | Good | Good |
Performance Analysis and Lessons Learned
Development programming in the West Bank over the past year met its target to increase its effectiveness of justice system institutions and processes. The Office of the Attorney General and Prosecution Service became more effective, with the backlog of cases awaiting disposition falling for the first time since tracking began in 2008, from 5,008 cases in 2012 to 3,693 in 2013.
Justice and security institutions were strengthened with the advancement of the Courthouses Construction project in Tulkarem. Design work is under way for the Hebron facility. Recognizing that sustainable economic growth in the West Bank is a key factor in social stability, regional security and the viability of a future Palestinian state, DFATD committed funding to support job creation, entrepreneurship and innovation.
In support of food security for the region, institutions were strengthened through DFATD contributions to the WFP. In 2013, 244,499 beneficiaries (122,201 male and 122,298 female) received food vouchers, and 155,322 children (78,264 male and 77,058 female) received date bars and milk though a school feeding program.
Program 3.2: Low-income Countries
Description: Low-income countries face pervasive poverty and limited institutional capacity, but generally have stable governance and public security. Programming in these countries seeks to strengthen education and health for children and youth, address food insecurity, foster inclusive and sustainable economic growth, and build the foundations for capable, inclusive, transparent and accountable governance systems.
| Main Estimates 2013-14 | Planned Spending 2013-14 | Total Authorities 2013–14 | 2013–14 Actual Spending (authorities used) | 2013–14 Difference (actual minus planned) |
|---|---|---|---|---|
| 917,574,328 | 917,574,328 | 966,445,870 | 791,652,540 | -125,921,788 |
| Planned 2013-14 | Actual 2013-14 | Difference 2013-14 |
|---|---|---|
36 Sub-program and Sub-sub-program allocation excludes 118 FTEs for branch corporate services allocated to Low-income Countries. | ||
| 337 | 286 | -51 |
| Expected Result | Performance Indicator | Target | Result | ||
|---|---|---|---|---|---|
37 No result for Tanzania was available. | |||||
| Increase sustainable agricultural production by rural poor women, men and youth. | Annual production of agricultural goods in targeted regions of DFATD interventions. | Between 1990 and 2015, halve the proportion of people who suffer from hunger, by country (MDG 1.C). | Not available. | ||
| Rate of adoption by farmers of new farming techniques and crop varieties in targeted regions DFATD interventions. | Between 1990 and 2015, halve the proportion of people who suffer from hunger, by country (MDG 1.C). | Not available. | |||
| Increased health services to mothers, newborns and children under five. | % of live births attended by an accredited health professional. | Between 1990 and 2015, reduce by three quarters the maternal mortality rates, by country (MDG 5.A). | Countries37 | Result | Year |
| Bangladesh: Ethiopia: Ghana: Mali: Mozambique: Pakistan: Senegal: Vietnam: | 31.7 10 68.4 56.1 54.3 43 65.1 92.9 | 2011 2011 2011 2010 2011 2011 2011 2011 | |||
| Increased accountability of public and civil institutions to respond to the needs of women, men and children. | On a five-point scale, average program rating of progress of DFATD low-income countries of focus toward achieving this result. | Develop further an open, rule-based, non-discriminatory system, by country (MDG 8.A). | Not available. | ||
Performance Analysis and Lessons Learned
In 2013-14, DFATD programming focused on interventions to provide the conditions required for low-income countries to achieve middle-income status, including addressing food insecurity, health services, and the institutional needs of women and children. Many sub-programs were successful in reaching their performance targets.
Food security initiatives remain on track, with increased agricultural production in Ethiopia, Ghana, Mali, Senegal and Vietnam. For example, in Ethiopia, annual yields of rice increased by 64 percent, in Ghana, food production increased by 7 percent, and in Mali, rice production increased by 19,800 tons.
As a global leader in improving health services for mothers, newborns and children under five, DFATD supported initiatives in low-income countries to provide training and resources for health care workers. Progress in this area was achieved in Bangladesh, Ethiopia, Ghana, Mozambique, Pakistan and Tanzania. Distribution of nutritional supplements in Bangladesh has reduced the prevalence of stunting for under-five children from 41 percent in 2011 to 38.7 percent in 2013. Efforts to eradicate measles in Mozambique were supported through the provision of vaccinations to approximately 4 million children.
A key DFATD priority has been an increasing focus on the accountability of public and civil institutions to respond to the needs of women, men and children. Results for this priority are largely on track in Ghana, Mali, Mozambique, Senegal, Tanzania and Vietnam. Vietnam has improved transparency in the areas of policy and economic legislative development. In Mozambique, decentralisation of the education system and improved access to primary education increased steadily. In Ghana, DFATD has been supporting the creation of institutions responding to children and early or forced marriage.
Sub-Program 3.2.1: Bangladesh
Description: This sub-program focuses on improving basic education and promoting equality between men and women, investing in maternal, newborn, and child health and support to sustainable economic growth through enhanced public finance management systems and by increasing skills for employment.
| Planned Spending | Actual Spending | Difference | Planned | Actual | Difference |
|---|---|---|---|---|---|
| 74,075,284 | 54,666,032 | -19,409,252 | 17 | 13 | -4 |
| Expected Result | Performance Indicator | Target | Result |
|---|---|---|---|
| Increase delivery of quality health services, particularly for children and youth. | % of fully immunized children aged 12-23 months. | 90% by 2015 | 78.4% |
| % of children under five who are underweight. | 33% by 2015 | 35.1% | |
| Contraceptive prevalence rate. | 72% by 2015 | 62% |
Performance Analysis and Lessons Learned
In 2013-14, development programming in Bangladesh was on track to meet all health service delivery and education targets. Working with the Government of Bangladesh, antenatal care services were provided to pregnant women approximately 240,000 times, and over 2 million children received polio and measles vaccinations. DFATD strengthened the delivery of nutrition services in 11 impoverished districts and contributed to the provision of food and micronutrient supplements to pregnant women and children.
With DFATD funding, access to pre-primary education was improved in Bangladesh for over 342,000 poor children (61 percent girls) and primary education for over 711,000 children (63 percent girls).
To improve government transparency, DFATD provided support to assist the Bangladesh Office of the Comptroller and Auditor General to better plan and conduct government audits and track and report key audit findings.
Sub-Program 3.2.2: Ethiopia
Description: This sub-program increases sustainable economic growth and addresses the structural causes of food insecurity, focusing on increasing agricultural productivity, farmers’ incomes, and improving nutrition.
| Planned Spending | Actual Spending | Difference | Planned | Actual | Difference |
|---|---|---|---|---|---|
| 102,785,115 | 75,839,903 | -26,945,212 | 17 | 15 | -2 |
| Expected Result | Performance Indicator | Target | Result |
|---|---|---|---|
38 At the time of publication of this report, the actual result was not available. It is expected by fall 2014. | |||
| Increased agricultural production and commercialization in targeted regions. | % increase in agricultural productivity of participating households. | 11.1% | Not available.38 |
| Annual yield/production level.39 | 89% | 55% in the south and 25% in the north | |
Performance Analysis and Lessons Learned
While development programming in Ethiopia did not meet its 2013-14 targets for improved agricultural production, rice farmers in southern Ethiopia increased their annual yields by 55 percent, while production in the north increased by 25 percent. These annual increases are on track to exceed overall program targets. Six million food-insecure Ethiopians benefited from the Productive Safety Net Program, which enabled families to accumulate livestock between 10 percent and 15 percent faster than non-participating households.
With DFATD’s support, efforts were made to reduce barriers for female participation in the workforce and enable inclusive sustainable economic growth. Over 1,600 women have registered for Ethiopia’s Women Entrepreneurship Development Program, receiving US$5 million in loans so far. Other initiatives focused on improving the business environment for micro-enterprises in the country, including the launch of an online trade registration and licensing system.
DFATD supported treatment for over 50,000 severely malnourished Ethiopian children, with a recovery rate of 85 percent. A total of 2,817,936 children were provided with vitamin A supplements, and 1,903,643 children with deworming treatment.
Sub-Program 3.2.3: Ghana
Description: This sub-program supports food security and initiatives to secure the future of children and youth, complemented by efforts to improve governance and accountability and enhance the environment within Ghana for increasing economic growth.
| Planned Spending | Actual Spending | Difference | Planned | Actual | Difference |
|---|---|---|---|---|---|
| 89,869,334 | 66,265,693 | -23,603,641 | 15 | 12 | -3 |
| Expected Result | Performance Indicator | Target | Result |
|---|---|---|---|
40 This program never emerged due lack of funding and human resources challenges for the Government of Ghana. | |||
| Increase access to sanitation services for women, men, children and youth. | % of rural population with access to sanitation. | 53% by 2015 | Not available40 |
| Increase effectiveness of national and local governments to respond to the needs of women, men, girls and boys. | % of overall targets met by the government of Ghana with respect to the Performance Assessment framework of Multi-donor Budget Support. | 80% by 2015 | 76% |
| Increased equitable access to basic services related to food security and agriculture by women, men, children and youth. | Aggregation of annual production of key staple food crops, expressed in metric tons. | 37.5 million tons by 2015 | 31.7 million tons |
Performance Analysis and Lessons Learned
Largely as a result of capacity issues within the Government of Ghana and continued political instability in the region, development programming in Ghana did not fully meet its performance targets for food security, safe drinking water and expanded basic sanitation as these targets are expected to be met by 2015. The Government of Ghana’s performance against the Multi-Donor Budget Support Performance Assessment Framework fell below the target level of 80 percent. Critical programming decisions were delayed for much of 2013, pending results of the court challenge to the 2012 elections, which caused cash flow difficulties for the country.
Ghana did improve its food security, with a substantial 7 percent increase in annual food production, which was lower than expected in terms of yields per hectare. An improvement in this figure by 2015 is anticipated given current trends.
DFATD is working with the Ghanaians to improve health services and nutrition. Community-based management of severe acute malnutrition has been implemented in 59 out of 96 vulnerable districts in northern Ghana, providing assistance to 567,500 mothers with children under 24 months old.
The total population with access to safe water reached 87 percent in 2012, exceeding the UN Millennium Development Goal target level by 10 percent. In DFATD-targeted regions, 81 percent of the population have access to safe water in rural areas, 12 percent above the target level. DFATD also contributed to training 4,200 school children in basic hygiene, allowing 168 communities to attain open defecation free status. Overall, DFATD helped to finance 959 local infrastructure projects, including 413 school blocks, 95 health centres, 38 water systems and 163 sanitation facilities.
Sub-Program 3.2.4: Mali
Description: This sub-program supports children and youth, food security, and programming to strengthen government functions in Mali.
| Planned Spending | Actual Spending | Difference | Planned | Actual | Difference |
|---|---|---|---|---|---|
| 45,755,561 | 34,787,206 | -10,968,355 | 46 | 13 | -33 |
| Expected Result | Performance Indicator | Target | Result |
|---|---|---|---|
| Increased agricultural production. | Annual level of rice production. | 2.5 million tons | 1.984 million tons |
| Annual level of market-garden vegetable production. | 193,200 tons by 2015 | 252,090 tons | |
| Annual level of shea production. | 180,000 tons by 2015 | 158,000 tons | |
| Improved access to basic health services for women and children. | % of childbirth assisted by qualified personnel. | 60% by 2016 | 58.6% |
| % of infant immunization coverage against diphtheria, tetanus, pertussis and polio. | 90% | 88% |
Performance Analysis and Lessons Learned
In 2013-14, development programming in Mali exceeded one target and achieved significant progress in three other areas of performance. Following the coup d’état in Mali in March 2012, Canada was on the front lines of efforts to assist the people of Mali during a critical period in their country’s history.
Food security was increased, with annual rice production reaching 1.984 million tons, an annual increase of more than 19,800 tons since 2009. This was made possible through the irrigation of nearly 10,000 hectares of new land in the regions of Timbuktu and Mopti, meeting the annual food needs of more than 243,000 people. A reduction in the rates of moderate to acute malnutrition was observed, with 69,834 children improving their nutritional status in the regions of Kayes and Sikasso.
With respect to education for children, DFATD facilitated the printing and distribution of 871,683 textbooks and educational materials for 383,400 students, as well as guides for 13,200 teachers. To demonstrate its commitment to democracy and the rule of law, DFATD funded an international election-assessment team, including Canadian and international experts, to monitor Mali’s July 2013 presidential election.
Sub-Program 3.2.5: Mozambique
Description: This sub-program supports children and youth with a focus on maternal, newborn and child health, education and sustainable economic growth. It also supports initiatives to strengthen transparency, accountability and effectiveness of national and provincial public institutions within Mozambique.
| Planned Spending | Actual Spending | Difference | Planned | Actual | Difference |
|---|---|---|---|---|---|
| 124,290,230 | 97,912,400 | -26,377,830 | 13 | 13 | 0 |
| Expected Result | Performance Indicator | Target | Result |
|---|---|---|---|
| Increased use of key services (health care, HIV/AIDS, clean water) by women, men, girls and boys. | % of births delivered in a health care facility. | 65% | 69% |
Performance Analysis and Lessons Learned
Development programming in Mozambique surpassed the targets for improving maternal and child health services. In 2013, the percentage of mothers giving birth in a health facility increased to 69 percent from 63.8 percent in 2012. Approximately 4 million children under five were vaccinated for measles, which is a substantial contributor to childhood deaths in the country.
With DFATD’s support, Mozambique made significant progress on institutional reforms, with a focus on financial management. The proportion of expenditures made directly through the Government of Mozambique’s Integrated Electronic Financial Tracking System grew to 77 percent, from 53 percent in 2012. Progress was also achieved toward decentralization, with 35 percent of the total state budget now being spent at the provincial and district levels. DFATD supported access to quality education through the recruitment of 8,500 teachers and provision of 13 million school books to children and youth.
Sub-Program 3.2.6: Pakistan
Description: This sub-program supports children and youth in Pakistan, with a focus on education, sustainable economic growth, women’s economic empowerment and promoting human rights.
| Planned Spending | Actual Spending | Difference | Planned | Actual | Difference |
|---|---|---|---|---|---|
41 The variance between planned and actual spending in Low-income countries reflects the unused portion of the Pakistan-Canada Debt for Education Conversion initiative and the funding received to forgive the debts relating to the 1976 loan made to the government of the Republic of the Union of Myanmar (Burma). | |||||
| 42,486,286 | 121,486,963 | 79,000,67741 | 12 | 11 | -1 |
| Expected Result | Performance Indicator | Target | Result |
|---|---|---|---|
42 Middle and secondary enrolment rate in targeted provinces could not be collected in 2013-14. | |||
| Improved access to quality public sector education services for girls and boys. | Net primary enrolment rate in targeted provinces.42 | 100% by 2015 | 57% |
| # of public school teachers trained in modern teaching methods. | 308,000 | 420,023 | |
| Improved enabling environment supporting women’s participation in sustainable national economic growth. | % of women’s labour force participation. | 25% by 2015 | 57% |
| Female-to-male ratio of estimated earned income. | 35:100 | 21:100 | |
Performance Analysis and Lessons Learned
In 2013-14, development programming in Pakistan is on track to meet all targets for improved access to quality basic education. In partnership with the Aga Khan Foundation, pre-primary and primary systems and teacher training programs were strengthened. Twenty-three teachers and education managers were supported to complete a two-year Masters of Education program. Since 2006, over 420,000 teachers have been trained in modern and innovative teaching techniques.
To address gender disparities, DFATD supported the creation of a unit responsible for gender mainstreaming within the Election Commission of Pakistan, increasing female commission staff from 8 to 27. For the 2013 election, DFATD helped train over 243,000 staff, of which 25 percent were female. A total of 3,750 extremely poor women were employed through road and community infrastructure maintenance, improving community access to rural areas by maintaining 8,213 km of rural roads.
Sub-Program 3.2.7: Senegal
Description: This sub-program supports children and youth in Senegal with a focus on basic education and food security, emphasizing increased agriculture, nutrition and microfinance.
| Planned Spending | Actual Spending | Difference | Planned | Actual | Difference |
|---|---|---|---|---|---|
| 79,092,849 | 58,308,340 | -20,784,509 | 15 | 13 | -2 |
| Expected Result | Performance Indicator | Target | Result |
|---|---|---|---|
43 The above target is a miscalculation. The target should read 103,350 by 2015. | |||
| Increased value added in agroforestry operations and processing in targeted areas. | # for farmers supported to increase their production in targeted areas. | 266,570 by 201543 | 88,500 |
| Increased efficiency of the education system at all levels. | Rate of primary school completion. | 85% by 201544 | 65.9% |
Performance Analysis and Lessons Learned
Over the past year, development programming in Senegal made significant progress toward the targets for the country. DFATD supported 88,500 Senegalese farmers, including more than 46,700 women. Rice production increased from 25,000 tons in 2008 to 56,917 tons in 2013, with per hectare yields increasing from 4.9 tons in 2011 to 5.5 tons in 2013. As a result, DFATD directly improved food security for over 535,000 Senegalese, including over 280,000 women. Support for agricultural operations and processing helped created 2,617 jobs, including 1,496 for women.
In the education sector, DFATD supported the training of over 47,000 educators, with the overall school enrolment rate reaching 94 percent and the national completion rate for students in primary school increasing to almost 70 percent.
Canada continues to support Senegal’s efforts to secure membership in the New Alliance for Food Security and Nutrition, which aims to attract private investment for inclusive agricultural growth. Also with Canada’s support, Senegal was accepted as a candidate for the Extractive Industries Transparency Initiative. Related results included DFATD support for Senegal’s National Office for the Fight against Fraud and Corruption, as well as improvements to its Ministry of Economy and Finance to ensure transparency in the management of public finances.
Sub-Program 3.2.8: Tanzania
Description: This sub-program provides support to secure the future of children and youth in Tanzania, stimulate sustainable economic growth, and promote more accountable and inclusive governance.
| Planned Spending | Actual Spending | Difference | Planned | Actual | Difference |
|---|---|---|---|---|---|
| 136,125,715 | 103,594,026 | -32,531,689 | 16 | 14 | -2 |
| Expected Result | Performance Indicator | Target | Result |
|---|---|---|---|
| Enhanced effectiveness of the government and civil society organizations to address the needs and aspirations of the Tanzanian population. | Survival rate for primary and secondary education. | 100% | Average primary survival rate: 72% |
| Average secondary survival rate: 77% | |||
| Improved equitable utilization of gender sensitive services for women, men, girls, boys and the vulnerable. | % of births attended by a skilled health worker. | 80% by 2015 | 62% (2011) |
Performance Analysis and Lessons Learned
Although performance targetsFootnote 45 for development programming in Tanzania were not fully achieved in 2013-14 there were positive gains made in every sector of programming. For example, improvements in public financial management were achieved, notably in revenue management, budgeting, planning, budget execution, control and oversight. For example, a new human resources and payroll system increased data accuracy from 60 percent in 2009 to 95 percent in 2013.
To support sustainable economic growth, DFATD worked with financial service providers, including commercial banks that use mobile money platforms, to increase access to financial services. Now 57.4 percent of the Tanzanian working population can access finance through formal institutions, surpassing the Bank of Tanzania’s target of 50 percent by 2016.
Access to health care services was improved within Tanzania over the past year. The percentage of women delivering their babies at health facilities increased from 50 percent in September 2013 to 72 percent by March 2014, and the percentage of women receiving post-natal care within two days of childbirth increased from 33 percent to 78 percent by March 2014.
The partnership announced by Prime Minister Harper in June 2013 on Transparency in the Extractive Sector in Tanzania enabled Canada to work with governments, civil society and industry to improve transparency and governance in this sector. With DFATD’s support, environmental audits were conducted on eight large-scale mines, 27 medium-scale mines, 76 small-scale mines and 51 gold processing sites, triggering improvements in compliance with environmental best practices among audited mines.
Sub-Program 3.2.9: Vietnam
Description:This sub-program supports poverty reduction through sustainable economic growth programming, consistent with Vietnam’s development priorities.
| Planned Spending | Actual Spending | Difference | Planned | Actual | Difference |
|---|---|---|---|---|---|
| 25,456,083 | 18,891,757 | -6,564,326 | 12 | 8 | -4 |
| Expected Result | Performance Indicator | Target | Result |
|---|---|---|---|
46 These indicators were updated in 2012. They use a scale that ranges from -2.5 (weak) to 2.5 (strong). The Regulatory quality score captures perceptions of the ability of the government to formulate and implement sound policies and regulations that permits and promotes private sector development. Progress towards this target was slightly weaker than expected. | |||
| Improved enabling environment of more effective and accountable public institutions for economic growth. | Regulatory quality score.46 | - 0.52 by 2015 | - 0.68 |
| Government effectiveness score.47 | - 0.30 by 2015 | - 0.29 | |
Performance Analysis and Lessons Learned
Development programming in Vietnam made progress toward achieving its targets and met one of them; however, the country has made significant development advancement over the past two decades and was upgraded to lower-middle income country status in 2010.
DFATD supported Vietnam’s efforts to improve policy transparency and clarify roles and responsibilities associated with the development and implementation of economic legislation. DFATD also contributed to improving the regulatory framework in key reform areas, such as the banking sector, anti-corruption, state-owned enterprise management, and taxation.
Business licence reform in targeted areas contributed to estimated savings for businesses of US$15 million per year in compliance costs. In support of private sector development, the business registration process facilitated 306 new certificates of business registration in the Soc Trang Province, 47 percent more than last year. A total of 80 SMEs and 1,368 household businesses benefited from small-scale infrastructure projects that reduced transportation costs to local markets by 20 percent.
DFATD funding enabled increased agricultural productivity and better food safety practices, demonstrated by a 21.7-percent increase in agricultural revenues. More than 80,000 farmers (25 percent women) were trained in new production technologies, environmentally sustainable practices and pest management. DFATD’s support for high-yield and high-quality agricultural and production models in the Hà Tinh Province helped lead to increased incomes of between 25 percent and 30 percent for 2,300 farmers.
Sub-Program 3.2.10: Other Low-income Countries Assistance Programs
Description:Programming in these countries is characterized by modest budgets and a targeted focus on their development priorities in line with increasing food security, stimulating sustainable economic growth, securing the future of children and youth, and supporting governance.
| Planned Spending | Actual Spending | Difference | Planned | Actual | Difference |
|---|---|---|---|---|---|
| 179,388,552 | 141,650,901 | -37,737,651 | 56 | 56 | 0 |
| Expected Result | Performance Indicator | Target | Results | ||
|---|---|---|---|---|---|
| Improved access to basic health services, particularly for underserved populations. | % of births attended by skilled birth attendants. | Increase in the % for identified countries by 2015. | Countries | Results | Year |
| Benin: DRC: Kenya: Malawi: Zimbabwe: Zambia: Burkina Faso: | 81.4 93.6 43.8 71.4 46.5 66.2 65.9 | 2012 2012 2009 2010 2007 2011 2010 | |||
| Improved quality of primary education for girls and boys. | Primary school completion rates, disaggregated by gender. | Increase in rate for identified countries by 2015. | Qualitative reporting provided below. | ||
| Improved agricultural productivity, especially by women, youth and other small holder farmers in targeted countries. | # of farmers who successfully increase their production. | 8 million by 2015 | 13.045 million | ||
| Increased use of health services for girls, boys, women and men. | Anti-retro therapy coverage among people with advanced HIV infections. | Increase in coverage for identified regional programs by 2015. | 1.6 million patients | ||
Performance Analysis and Lessons Learned
Over the past year, DFATD made a number of small, diverse and strategically targeted investments in some low-income countries. Most programming is on track, with the following key results for 2013-14.
- In Nigeria, contributions to government-led Maternal, Newborn and Child Health projects provided essential services to 5.4 million pregnant women and 27 million children under five. In partnership with other donors, Canada provided an estimated 2 million children (12 to 60 months of age) with deworming tablets and 850,000 pregnant women with blood-building tablets.
- In Malawi, support for improved nutrition of mothers and children under five, and funding for 277 metric tons of therapeutic food, contributed to the treatment of 31,086 malnourished children.
- In Kenya, Canada provided support for greater access to a safe learning environment for 3,000 children (1,675 girls) living in vulnerable regions, including refugee camps and marginalized, drought-prone regions.
- In the Democratic Republic of Congo, Canada provided training for 97 male and female members of management teams in health zones of targeted regions.
- In Burkina Faso, the use of financial centres for entrepreneurs and farmers increased loans to $14 million by March 2014, more than $9 million above the initial target.
- In Benin, support for the Faîtière des caisses d'épargne et de crédit agricole mutuel du Bénin has seen its savings volumes grow by 38.3 percent in four years to reach a total of approximately $166 million in 2013, providing greater access to finance for agricultural development.
- Investment via the Department’s Pan Africa Regional Development Division has permitted the support to the Pan Africa Bean Research Alliance which has enabled over 13 million farm households to increase their productivity as a result of better seeds, seed systems and crop management techniques.
Program 3.3: Middle-income Countries
Description: Middle-income countries face challenges in sustainable economic growth and development. Despite stronger economic and social foundations, they still face significant inequality and poverty. This program delivers technical assistance to foster equal access to economic opportunities and to strengthen local economies, to expand service delivery to reach marginalized groups, and to build accountable, democratic institutions.
| Main Estimates 2013-14 | Planned Spending 2013-14 | Total Authorities 2013–14 | 2013–14 Actual Spending (authorities used) | 2013–14 Difference (actual minus planned) |
|---|---|---|---|---|
| 337,884,532 | 337,884,532 | 324,116,753 | 322,974,722 | -14,909,810 |
| Planned 2013-14 | Actual 2013-14 | Difference 2013-14 |
|---|---|---|
48 Sub-program and Sub-sub-program allocation excludes 37 FTEs for branch corporate services allocated to Middle-income Countries. | ||
| 162 | 141 | -21 |
| Expected Result | Performance Indicator | Target | Results | ||
|---|---|---|---|---|---|
49 Result for the Caribbean Region was not available. | |||||
| More competitive local economies, especially for micro, small and medium-sized enterprises, and women-led enterprises in poorer areas. | Level of integration of micro, small, and medium-sized enterprises in local and regional markets, per country. | By 2015, achieve full integration of productive employment and decent work (MDG 1.B). | Not available. | ||
| Increased access to quality education for marginalized female and male children and youth, in particular those living in remote communities. | Total net ratio in primary education, both sexes. | By 2015, ensure that boys and girls alike will be able to complete a full course of primary school, by country (MDG 2.A). | Countries49 | Result | Year |
| Bolivia: Columbia: Honduras: Indonesia: Peru: Ukraine: | 86.8 86.5 94 95.3 93.5 98.4 | 2011 2012 2012 2012 2013 2012 | |||
| Strengthened citizen participation to sustain social and economic progress. | World Bank Accountability Score. | By 2015, further develop an open, ruled-based, non-discriminatory system, by country (MDG 8.A).50 | Countries51 | 2007 | 2012 |
| Bolivia: Columbia: Honduras: Indonesia: Peru: Ukraine: | 0.00 -0.18 -0.24 -0.07 0.06 0.04 | -0.13 -0.11 -0.51 0.03 0.07 -0.29 | |||
Performance Analysis and Lessons Learned
In 2013-2014, DFATD met, or is on track to meet, most development targets for middle-income countries. Progress toward sustainable economic growth was evident through increased international investment in countries such as Bolivia, Honduras and Peru. Agricultural sales increased in Honduras by $450,000 more in revenues and the Caribbean Region saw an increase of $329,518 in the value of exports.
To help secure better futures for children and youth, DFATD committed to many short- and long-term investments in children’s health and education. In Colombia, DFATD programs supported 61,341 at-risk children and adolescents recruited for armed action as they sought protection from violence and exploitation. In Bolivia, 1,175 health clinic personnel and 643 community volunteers were trained to improve nutritional outcomes for mothers, newborns and children.
Through development programming, public services, governance and democratic transparency have also improved across many middle-income countries. For example, the Juvenile Justice Reform Project was implemented in Ukraine’s judicial system.
Sub-Program 3.3.1: Bolivia
Description:This sub-program supports the future of children and youth in Bolivia with a focus on maternal and child health, as well as initiatives to stimulate sustainable economic growth focused on skills training, business development and effective partnerships between non-governmental organisations, extractive sector companies and communities.
| Planned Spending | Actual Spending | Difference | Planned | Actual | Difference |
|---|---|---|---|---|---|
| 13,998,696 | 13,433,431 | -565,265 | 4 | 4 | 0 |
| Expected Result | Performance Indicator | Target | Result |
|---|---|---|---|
| Increased consumption of micronutrients through complementary and fortified food supplements in the target population. | % of children between 6 and 23 months who receive and consume micronutrients in powder. | 60% by 2015 | 72% |
Performance Analysis and Lessons Learned
In 2013-14, development programming in Bolivia exceeded its target focused on improving maternal and child health, with the percentage of children between six months and 23 months who received and consumed micronutrients increasing from 37 percent in 2007 to 72 percent in 2013. A total of 852 health professionals were trained to better implement health monitoring systems.
DFATD supported equal access to economic opportunities through the targeted provision of technical assistance, including training on the cultivation, production and processing of export-oriented crops for 391 families. With this support, 4,149 women improved their access to productive resources (e.g. markets, property, credit and technology) and formal employment.
Sub-Program 3.3.2: Caribbean Region
Description: This sub-program supports sustainable economic growth with a focus on accountable public institutions, entrepreneurship, and connectivity to markets, as well as enhancing security through strengthening the rule of law and reducing vulnerability to natural disasters.
| Planned Spending | Actual Spending | Difference | Planned | Actual | Difference |
|---|---|---|---|---|---|
| 42,463,324 | 40,501,502 | -1,961,822 | 25 | 16 | -9 |
| Expected Result | Performance Indicator | Target | Result |
|---|---|---|---|
52 This performance indicator is no longer being tracked by the implementing partner. | |||
| Improved business development and increased trade and economic activities. | Amount of private sector investment in infrastructure related to public-private partnerships. | $US150 million by 2015 | $US50 million |
| Gender breakdown of male and female in senior management positions in Caribbean SMEs. | Minimum 5% increase in females participating in COMPETE by 2014. | Not available.52 | |
Performance Analysis and Lessons Learned
Development programming in the Caribbean region is on track to meet targets to support equal access to economic opportunities, and to create the conditions for more competitive and inclusive local economies in the Caribbean region.
With DFATD support, the Compete Caribbean partnership helped strengthen several investment/export promotion agencies in the region, resulting in an increase in FDI and employment. For example, the Eastern Caribbean Trading Agriculture and Development Organization increased its exports to the United Kingdom, at a retail value of $329,518. Through support from the International Monetary Fund to the Caribbean Technical Assistance Centre (CARTEC), regulatory capacities in the credit union sectors are enabling the creation of credit union acts in three Eastern Caribbean countries. DFATD is supporting Caribbean countries in their private sector development through over $19 million in funding for the Partnership for CARICOM Private Sector Development initiative, implemented by the World Bank Group’s International Finance Corporation.
Canadian community colleges established partnerships with community colleges in ten Caribbean countries, strengthening their ability to deliver technical and vocational education and training. For example, the CARTEC project is improving Public Financial Management in the Caribbean through technical assistance, internships and training programs.
Sub-Program 3.3.3: Colombia
Description: This sub-program supports the future of children and youth in Colombia, focusing on increasing access to basic education and protection of human rights, as well as stimulating sustainable economic growth with a focus on effective corporate social responsibility.
| Planned Spending | Actual Spending | Difference | Planned | Actual | Difference |
|---|---|---|---|---|---|
| 33,461,644 | 32,017,523 | -1,444,121 | 10 | 7 | -3 |
| Expected Result | Performance Indicator | Target | Result |
|---|---|---|---|
| Increased social and economic benefits for the most vulnerable groups from environmentally sustainable social and economic development of their communities. | # of vulnerable and at-risk youth actively involved in economic development opportunities. | 3,600 by 2015 | 2,211 |
Performance Analysis and Lessons Learned
While development programing in Colombia did not meet its target for involvement of at-risk youth in economic development opportunities, substantial progress was achieved. DFATD supported the reintegration of 5,517 out-of-school children and adolescents back into the formal education system, with an additional 2,415 students benefiting from flexible education models tailored to their needs.
Progress was made towards providing at-risk youth with economic development opportunities with 2,211 youth with technical and vocational training in conflict-affected rural areas of the Nariño Department.
Support services were provided to 39,843 children, adolescents and lactating/pregnant women affected by armed conflict and natural disasters. 5,809 internally displaced households received better access to public services including water, sanitation, education and health services.
To increase security and stability, 70,998 children and adolescents at-risk of recruitment by armed groups were assisted in protecting themselves from violence and abuse. In the Nariño Department, 2,840 youth were trained in leadership and decision-making and they now participate in anti-violence protection networks.
DFATD also supported improved production and commercialization of agricultural products for 1,882 families. Production improvements included an 80 percent increase in yield for pepper producers in the conflict-affected Putumayo Department.
Sub-Program 3.3.4: Honduras
Description: This sub-program supports food security and securing the future of children and youth, particularly in rural areas.
| Planned Spending | Actual Spending | Difference | Planned | Actual | Difference |
|---|---|---|---|---|---|
| 30,091,297 | 28,473,743 | -1,617,554 | 13 | 13 | 0 |
| Expected Result | Performance Indicator | Target | Result |
|---|---|---|---|
| Improved delivery of quality basic education. | % of children who successfully complete grade 6. | 100% by 2015 | 81% |
| # of school days per year. | 200 by 2015 | 200 |
Performance Analysis and Lessons Learned
In 2013-14, development programming in Honduras made good progress toward meeting performance targets through improving the delivery of quality education. In partnership with the Government of Honduras, a sustained focus on education sector governance contributed to DFATD reaching its goals.
DFATD provided assistance to the education system that helped improve standardized test scores. Graduation rates have increased to 81 percent in 2013 from 69 percent in 2000. The percentage of grade 6 graduates declined by 9 percent; however, the level of over 13 year old students was high in the previous year, suggesting repeat students.
In the area of food security, through DFATD support, 1,106 new producers (38 percent women) were trained in crop management and water and soil conservation. In support of sustainable coffee production in Honduras, DFATD enabled lines of credit for 23 cooperatives, leading to increased coffee production on 1,521 hectares of land, benefiting 805 families.
Through the WFP, micronutrients were provided to 14,229 children under the age of two, and micronutrients and food rations were provided to 4,153 pregnant and lactating women. Through contributions to health care services, 30,258 adolescents had better access to age- and gender-sensitive services, and 420 health care workers received training in topics ranging from gender equality to HIV/AIDS prevention.
Sub-Program 3.3.5: Indonesia
Description: This sub-program supports sustainable economic development in response to country-identified development priorities.
| Planned Spending | Actual Spending | Difference | Planned | Actual | Difference |
|---|---|---|---|---|---|
| 23,655,704 | 22,490,017 | -1,165,687 | 13 | 11 | -2 |
| Expected Result | Performance Indicator | Target | Result |
|---|---|---|---|
| Improved planning and implementation of economic development programs and strategies by provincial and district governments in targeted areas. | Local government public financial management assessment scores. | 80% by 2013 | 66.25% |
| Level of vendor satisfaction with the procurement system (on a 10-point scale). | 5.84 by 2013 | 5.6 | |
| Improved natural resource management and sustainable use of selected watersheds and community-based forests that generate and protect incomes for the poor. | % increase of income in 1,200 poor households in targeted area. | 100% by 2015 | 49% |
| # of market-oriented agroforestry-based enterprises developed. | 100 by 2016 | 26 |
Performance Analysis and Lessons Learned
Development programming in Indonesia made progress toward achieving its performance targets over the past year. DFATD, in support of Indonesia’s Corruption Eradication Commission, focused on preventing corruption at the local level, thereby increasing public satisfaction with local government procurement, administration and licensing. With DFATD’s assistance, local governments in ten districts/cities met minimum service standards for health and education service delivery.
In support of sustainable economic development, DFATD helped Indonesia advance towards compliance with the Extractive Industries Transparency Initiative, as well as develop and implement Watershed Management Plans to encourage sustainable use of Indonesia’s vast natural resource base. Training was provided to over 5,700 local governments and civil society organizations to increase their respective capacities to carry out gender-responsive planning and budgeting.
Sub-Program 3.3.6: Peru
Description: This sub-program supports securing the future of children and youth in Peru and sustainable economic growth in response to country-identified development priorities.
| Planned Spending | Actual Spending | Difference | Planned | Actual | Difference |
|---|---|---|---|---|---|
| 18,091,999 | 17,348,435 | -743,564 | 5 | 6 | 1 |
| Expected Result | Performance Indicator | Target | Result |
|---|---|---|---|
| Improved efficiency of basic education for children and youth of both sexes in rural areas. | % of students from rural areas that complete primary school within the prescribed time frame. | 80% by 2015 | 65.8% (62.7% boys, 69% girls) |
Performance Analysis and Lessons Learned
Over the past year, development programming in Peru made good progress toward meeting its performance target in support of securing a better future for children and youth. Despite progress against education targets, a setback in the 2013 graduation rate for boys occurred as a result of an economic slowdown. DFATD is working to address structural issues, such as the low capacity of teachers and student absences during seasonal work. A total of 3,000 officials were trained to provide quality primary education, and 140 officials trained to support the graduates’ transition to the formal labour market. Investments in intercultural bilingual education helped 62,324 indigenous children living in the Andes and the Amazon regions receive better quality education.
Progress was made in support of sustainable economic growth with the issuance of over 2,600 microloans to the owners of micro, small and medium-sized enterprises (MSMEs), and business development support for 789 MSMEs working in the extractive sector. DFATD supported greater transparency in the extractive sector to ensure revenues are used to provide basic services to Peruvians. As a result, 88,000 impoverished Peruvians are benefiting from improved infrastructure and access to public services. Recognizing the significant role played by women in the management of natural resources, conflict resolution training was provided for 1,963 women, contributing to a decreased number of active conflicts in Peru for the first time in five years.
Through the Canada-Peru G-7 Partnership for Extractives and Transparency, in 2013-2014 Canada has provided technical support to thirty Peruvian municipalities. This funding enhanced their capacity to better manage mining royalties, benefitting as many as 183,466 citizens due to the execution of 139 public projects in prioritized areas including education, health and infrastructure.
Sub-Program 3.3.7: Ukraine
Description: This sub-program provides technical cooperation to increase democratic governance, rule of law and economic opportunities for Ukrainians and reflects Government of Canada development priorities in Ukraine prior to the change in Government in Ukraine in 2014. Since then, Canadian assistance has been augmented to include support for Ukraine’s stability and security, particularly in the wake of Russian and Russian-sponsored aggression aimed at undermining Ukraine’s country’s democratic future, along with Ukrainian sovereignty and territorial integrity.
| Planned Spending | Actual Spending | Difference | Planned | Actual | Difference |
|---|---|---|---|---|---|
| 23,157,623 | 22,211,976 | -945,647 | 13 | 10 | -3 |
| Expected Result | Performance Indicator | Target | Result |
|---|---|---|---|
53 Disaggregated performance results no longer available as such, national average data was used. | |||
| Increased competitiveness of Ukrainian SMEs and small hold farmers. | % of SMEs sales/revenues of overall revenues, per oblast. | Zaporizhia: 20% Ivano-Frankivsk: 23% By 2016 | Zaporizhia: 43.7% Ivano-Frankivsk: 23% |
| Improved business enabling environment for Ukrainian women and men. | # of SMEs registered per 10,000 people, per oblast. | Zaporizhia: 87 Ivano-Frankivsk: 70 Lviv: 95 By 2016 | 80 (National average)53 |
Performance Analysis and Lessons Learned
Significant progress was achieved over the past year through development programming in Ukraine. Recognizing the importance of economic growth for governance and stability in Ukraine, DFATD supported the efforts of SMEs to improve their productivity by adopting value-chain principles and organizing cooperatives to increase access to credit and improve competitiveness. Support for agricultural initiatives helped an estimated 10,200 small holder farmers increase production, including a 20-percent increase for dairy farmers and a 70-percent increase in income for horticulture farmers.
Technical assistance from DFATD helped create economic development agencies and business support centres in select cities, with the World Bank now ranking Ukraine 112 out of 189 countries in its 2014 ease of doing business index. DFATD supported a Research and Policy Dialogue Initiative on Migration and Remittances aimed at raising Ukrainian policy-makers’ awareness of remittances as a potential source of investment.
In support of Ukraine’s democratic path, the Canadian Government supported the deployment of 26 Canadian election observers as part of an independent Canadian mission to monitor and report upon the repeat parliamentary elections of 5 districts across Ukraine in December 2013. For the Presidential election in May of 2014 the Canadian government deployed 126 election observers with the Organization for Security and Co-operation in Europe and 128 independent Canadian election observers to ensure the democratic will of Ukraine was recognized and free of interference. DFATD also supported the Central Electoral Commission with the production of new elections training manuals that were distributed to 100,000 election commissioners and assisted in the development of an online training system for 6,000 commissioners ahead of the May 2014 Presidential elections.
DFATD worked with the Ukrainian judicial system to improve the capacity of over 350 judges and stakeholders in dealing with juvenile issues, a successful initiative that is now being implemented throughout Ukraine. In support of Ukrainian governance, the department assisted Ukraine in its reform of legislation related to public access to information and broadcasting.
Sub-Program 3.3.8: Other Middle-income Countries Assistance Programs
Description: Programming in these countries and regions is characterized by targeted initiatives, aligned with their development priorities, focused on increasing food security, stimulating sustainable economic growth, securing the future of children and youth, and supporting democratic governance.
| Planned Spending | Actual Spending | Difference | Planned | Actual | Difference |
|---|---|---|---|---|---|
| 146,243,646 | 139,777,496 | -6,466,150 | 42 | 37 | -5 |
| Expected Result | Performance Indicator | Target | Results | ||
|---|---|---|---|---|---|
| Improved accountability of select government institutions and civil society organizations. | World Bank Voice and Accountability Score | Improvement in the score for identified countries by 2015. | Countries | 2007 | 2012 |
| Cuba: Egypt: Guatemala: Jordan: Morocco: Nicaragua: Philippines: South Africa: Sri Lanka: | -1.84 -1.12 -0.20 -0.65 -0.73 -0.24 -0.11 0.57 -0.43 | -1.43 -0.74 -0.39 -0.73 -0.61 -0.53 0.04 0.56 -0.60 | |||
| Increased agricultural productivity and distribution. | Per Capita Agricultural Production Index | Improvement in the index for identified countries by 2015. | Countries | Gross, 2012 | Net, 2012 |
| Cuba: Guatemala: Nicaragua: | 95.22 112.88 120.81 | 99.29 112.43 122.17 | |||
Performance Analysis and Lessons Learned
In 2013-14, development programming in middle-income countries continued to provide targeted support for sustainable economic growth programming, principally through partners. Support for the development of enabling business and investment environments is one of many successes this year. In the Philippines, improvements to the business registration process in seven target cities provided an estimated $14.2 million in private sector savings in 2013.
DFATD supported a number of Public Private Partnership infrastructure projects in middle-income countries, including the establishment of APEC’s Public Private Partnership Centre in Indonesia, which is designed to facilitate greater private investment in infrastructure. The Centre receives guidance and assistance from an expert advisory panel co-chaired by Canada (DFATD). Resulting projects will contribute to sustainable economic growth and could lead to commercial opportunities for Canadians.
The expansion of local and private sector development in Sri Lanka helped to increase incomes from approximately $16 to $80 per month by providing training to nearly 3,300 marginalized Sri Lankans, approximately 44 percent of whom were women.
Program 3.4: Global Engagement and Strategic Policy
Description: DFATD engages with multilateral and international organizations to advance Canadian development and humanitarian priorities. These partners have the capacity, expertise, and mandate to address global challenges, achieve sustainable development results, including in fragile and conflict-affected states, and respond effectively and efficiently in humanitarian crises. Initiatives supported by this program help Canada shape international development policy, promote an effective and efficient multilateral development and humanitarian system, and address global problems.
| Main Estimates 2013-14 | Planned Spending 2013-14 | Total Authorities 2013–14 | 2013–14 Actual Spending (authorities used) | 2013–14 Difference (actual minus planned) |
|---|---|---|---|---|
| 955,135,772 | 955,135,772 | 1,145,186,733 | 1,143,250,475 | 188,114,703 |
| Planned 2013-14 | Actual 2013-14 | Difference 2013-14 |
|---|---|---|
54 Sub-program and Sub-sub-program allocation excludes 88 FTEs for branch corporate services allocated to Global Engagement and Strategic Policy. | ||
| 223 | 194 | -29 |
| Expected Result | Performance Indicator | Target | Result |
|---|---|---|---|
| Increased effectiveness of Canadian development cooperation through engagement with, and investment in, multilateral and global organizations, to address humanitarian and development challenges. | Progress in global food security, health, education, and employment rates in developing countries by 2015. | Targets for the MDG 1 to 6, by country. | Significant progress, with some targets already met ahead of 2015 deadline. See UN report. |
| Increased ability to advance Canada’s development priorities in Canada and globally. | Evidence of Canadian influence in shaping the international development agenda. | Qualitative reporting. | Qualitative reporting provided below. |
| Coherence between aid and non-aid policies within multilateral organizations. | Qualitative reporting. | Qualitative reporting provided below. |
Performance Analysis and Lessons Learned
Under this program, substantial progress was made over the past year, with some targets being met ahead of the Millennium Development Goals (MGD) 2015 deadline. The United Nations (UN) publishes progress reports for nine regions on their achievements towards selected targets.
Canada continues to advocate for maternal, newborn and child health to remain a significant goal as part of the post-2015 agenda. This goal was advanced through planning and implementation efforts related to the Toronto Saving Every Women, Every Child: Within Arm’s Reach conference which was hosted by the Prime Minister and attended by Melinda Gates, the Queen of Jordan and the leading Canadian partners of the MNCH network.
Canada played a strong role in bringing accountability and results to the forefront of discussions with many global partners, as reflected in the annual G-8 accountability report. DFATD also successfully persuaded G-20 members to explore the use of innovative financing mechanisms to lower remittance costs to developing countries.
Canada’s views on modernizing the definition of Official Development Assistance, shaping the post-2015 development agenda, and advancing the Global Partnership for Effective Development Co-operation influenced outcomes for the UN Open Working Group on Sustainable Development and the OECD’s Development Assistance Committee. DFATD undertook extensive consultations to prepare a whole-of-government approach to engagement on the post-2015 development agenda. Canadian funding to the United Nations Development Programme supported global consultations on education interventions contributing to the post-2015 program development process.
Sub-Program 3.4.1: International Development policy
Description:This sub-program leads Canada’s international development policy, including poverty reduction, gender equality, environmental sustainability, health and education, economic growth, food security and nutrition, governance, fragility and conflict, and human rights. It represents and promotes Canada’s positions on these issues in international forums such as at the United Nations and the Organisation for Economic Co-operation and Development’s Development Assistance Committee.
| Planned Spending | Actual Spending | Difference | Planned | Actual | Difference |
|---|---|---|---|---|---|
| 13,842,534 | 16,064,218 | 2,221,684 | 106 | 94 | -12 |
| Expected Result | Performance Indicator | Target | Result |
|---|---|---|---|
| Strengthened evidence-based decision making in the DFATD priority areas. | % of programs that integrate at least one thematic priority in their programming. | 100% | 100% |
Performance Analysis and Lessons Learned
The International Development Policy sub-program met its performance target for 2013-14, with all bilateral country Official Development Assistance programs addressing at least one thematic priority. Over the past year, a focus was placed on improving the quality of evidence used to inform decision making on development programming.
DFATD has enhanced the impact of its international development assistance by leveraging partnerships and increasing coherence between development programming and foreign policy and trade objectives. DFATD prepared for the first high-level meeting of the Global Partnership for Effective Cooperation, including developing a new approach to development partnerships with civil society and engagement with the private sector. Progress was also made in advancing Canadian positions in preliminary discussions on the post-2015 development agenda.
Sub-Program 3.4.2: Multilateral Strategic Relationships
Description: This sub-program focuses on strategic relationships with multilateral and international organizations. Long-term institutional support and funding enables Canada to pool resources with other member states and achieve more through collective efforts.
| Planned Spending | Actual Spending | Difference | Planned | Actual | Difference |
|---|---|---|---|---|---|
55 The actual FTEs used to deliver results for this sub-program are indicated at the program level 3.4. | |||||
| 601,698,961 | 717,861,599 | 116,162,638 | 14 | 055 | -14 |
| Expected Result | Performance Indicator | Target | Result |
|---|---|---|---|
| Increased alignment between programming of multilateral development organizations and developing country national plans for poverty reduction strategies. | Progress on commitments to the international aid effectiveness agenda, namely the Paris Declaration. | 85% of aid flows to government sectors reported in recipient governments’ budgets as per the Paris Declaration. | Paris Declaration target not met - only 63% of aid reported in recipient countries budgets. |
| Multilateral Organisation Performance Assessment Network (MOPAN) target is improvement over previous assessment for each multilateral organization. | MOPAN target met - Progress toward alignment, meeting its target, with improvements over previous assessments for organizations assessed in 2013. |
Performance Analysis and Lessons Learned
DFATD remains committed to ensuring that its multilateral efforts support the priorities of recipient countries and make use of existing country systems and procedures that are working effectively. To reduce costs and maximize results, DFATD encouraged its multilateral partners to focus on their core priorities, taking into account their particular areas of expertise at the country and international levels.
In 2013-14, DFATD continued to enhance the effectiveness of its multilateral investments through the Multilateral Organisation Performance Assessment Network (MOPAN) initiative. Data collected by MOPAN over the past year demonstrated improved alignment of its programming with developing country strategies, meeting its target with improvements over previous assessments. The Paris Declaration target of ensuring that 85 percent of aid flows for the government sector were captured in partner government budgets was not met as a result of challenges in coordinating reporting from national governments, donor governments and multilateral organizations. For countries reporting on this indicator in 2013, 63 percent of scheduled development cooperation funding for the government sector was reflected in developing countries’ national budgets, an increase from 57 percent in 2010.
In July 2013, DFATD published A Review of African Development Bank (AfDB) Program Evaluation Reporting from 2007 to 2012. The preliminary findings indicated that the evaluations included in the review did not provide an adequate level of coverage of the AfDB’s program-level development results. The AfDB demonstrated a clear commitment to addressing challenges related to the frequency, quality, usefulness and methodology of the evaluations. A similar evaluation of the Inter-American Development Bank is under way.
Sub-Sub-Program 3.4.2.1: International Financial Institutions
Description: This sub-sub-program involves the provision of long-term institutional support to International Financial Institutions, which is governed by the International Development (Financial Institutions) Act. This includes organizations such as the African Development Bank, the Asian Development Bank, the Caribbean Development Bank, the Inter-American Development Bank, and the International Fund for Agricultural Development, the Global Environment Facility and the Multilateral Fund for the Implementation of the Montreal Protocol.
| Planned Spending | Actual Spending | Difference | Planned | Actual | Difference |
|---|---|---|---|---|---|
56 The actual FTEs used to deliver results for this sub-sub-program are indicated at the program level 3.4. | |||||
| 246,592,694 | 321,514,561 | 74,921,867 | 9 | 056 | -9 |
| Expected Result | Performance Indicator | Targets | Results | ||
|---|---|---|---|---|---|
57 Improved water source figures show the percentage of the overall population using an improved drinking water source, prevented from contamination. The Electrical power consumption figure refers to energy power consumed per capita calculating energy loss during transmission from power plant to distribution to homes by kilowatt per hour. | |||||
| Improved conditions for economic growth in developing countries (e.g. improved infrastructure, private sector development, and agricultural development). | Level of access by developing countries to infrastructure as measured by indicators such as: improved water source, rural (% rural population with access) and electric power consumption (KwH per capita).57 | Improved water source (rural) | Improved water source (rural) | ||
| Sub-Saharan Africa: East Asia & Pacific: Europe & Central Asia: Middle East & N. Africa: Latin America & Caribbean: | 46.8% 81.4% 89.4% 80.1% 79.7% | Sub-Saharan Africa: East Asia & Pacific: Europe & Central Asia: Middle East & N. Africa: Latin America & Caribbean: | 52.5% 84.6% 88.8% 82.7% 82.3% | ||
| Electric power (kWh per capita) | Electric power (kWh per capita) | ||||
| Sub-Saharan Africa: East Asia & Pacific: Europe & Central Asia: Middle East & N. Africa: Latin America & Caribbean: | 531 1973 4046 1494 1906 | Sub-Saharan Africa: East Asia & Pacific: Europe & Central Asia: Middle East & N. Africa: Latin America & Caribbean: | 535 2582 2955 1696 1985 | ||
| Level of access by developing countries to capital markets as measured by indicators such as foreign direct investment (FDI), net inflows (balance of payment, current US$); domestic credit provided by banking sector (percentage of gross domestic product).58 | FDI, net inflows (in billion US$) | FDI, net inflows (in US$) | |||
| Sub-Saharan Africa: East Asia & Pacific: Europe & Central Asia: Middle East & N. Africa: Latin America & Caribbean: | 27.8 101.4 86.2 27.8 76.6 | Sub-Saharan Africa: East Asia & Pacific: Europe & Central Asia: Middle East & N. Africa: Latin America & Caribbean: | 10.3 385 40.7 1.8 156.6 | ||
| Domestic credit provided by banking sector | Domestic credit provided by banking sector59 | ||||
| Sub-Saharan Africa: East Asia & Pacific: Europe & Central Asia: Middle East & N. Africa: Latin America & Caribbean: | 78.9% 134.1% 47.9% 40.7% 67.1% | Sub-Saharan Africa: East Asia & Pacific: Europe & Central Asia: Latin America & Caribbean: | 66.4% 141.5% 64.3% 71.7% | ||
Performance Analysis and Lessons Learned
In 2013-14, DFATD continued to support international financial institutions to enable sustainable economic growth in developing countries. This sub-sub program partly achieved its expected results focusing on private sector and agricultural advancement. For instance, in 2013, the Inter-American Development Bank trained over 22,000 public trade officials and private entrepreneurs in trade and investment, supported five regional and sub-regional integration agreements and cooperation initiatives, and financed over 1,300 international trade transactions. The Asian Development Bank provided 831,000 borrowers, mostly women, with microfinance loans and enhanced the quality of education for more than 19 million students in 2013.
DFATD’s support for the World Bank Group’s Facility for Investment Climate Advisory Services helped to implement 74 investment climate reforms in developing countries in 2013, of which two thirds targeted Sub-Saharan Africa. Reduced red tape lowered the cost of compliance by least $30 million, and industry-specific reforms led to over $328 million in new investment.
International financial institutions also directly promote economic growth through their private sector operations in developing countries. For example, DFATD is a member of the Multilateral Investment Fund of the Inter-American Development Bank which provides technical assistance, loans and equity investments to support private-sector led development projects in Latin America and the Caribbean. These projects provide low-income populations with basic services, access to finance and markets, as well as employment skills.
Sub-Sub-Program 3.4.2.2: International Development Institutions
| Planned Spending | Actual Spending | Difference | Planned | Actual | Difference |
|---|---|---|---|---|---|
60 The actual FTEs used to deliver results for this sub-sub-program are indicated at the program level 3.4. | |||||
| 250,932,616 | 280,001,445 | 29,068,829 | 1 | 060 | -1 |
| Expected Result | Performance Indicator | Targets | Results | ||
|---|---|---|---|---|---|
| Improved conditions for economic growth in developing countries (e.g. improved infrastructure, private sector development, and agricultural development). | Level of access by developing countries to infrastructure as measured by indicators such as: improved water source, rural (% rural population with access) and electric power consumption (KwH per capita). | Arab States: East Asia & Pacific: Europe & C. Asia: South Asia: Sub-Saharan Africa: Latin America & Caribbean: | 0.588 0.643 0.702 0.516 0.389 0.704 | Arab States: East Asia & Pacific: Europe & C. Asia: South Asia: Sub-Saharan Africa: Latin America & Caribbean: | 0.652 0.683 0.771 0.558 0.475 0.741 |
| Strengthened coherence of UN programming at the country level. | # of countries in which the UN and host government have adopted a consolidated program and resource framework for the UN system aligned with national priorities and Plans | 26 | 36 | ||
Performance Analysis and Lessons Learned
This sub-sub-program exceeded its expected results in 2013-14, with conditions improving for social development, including education and health, in developing countries in targeted regions. The UN reported the creation of 6.5 million jobs in developing countries and increased access to emergency obstetric care in 34 countries in 2013. DFATD contributed to improved coherence of UN programming, with 36 countries adopting a “Delivering as One” approach to UN development assistance.
Support was provided to the Consultative Group on International Agricultural Research in achieving sustainable food security and reducing poverty in developing countries through research and innovation. As a result, 385,153 additional farmers are now using new agricultural technologies and innovations, such as improved crop varieties and land management practices.
Sub-Sub-Program 3.4.2.3: Political Organizations
Description: This sub-sub-program involves the provision of long-term institutional support to several political organizations as a member of both the Commonwealth and the Francophonie. DFATD actively engages with these organizations, including through participating in their governing bodies and policy dialogues, and providing strategic advice aimed at improving their effectiveness.
| Planned Spending | Actual Spending | Difference | Planned | Actual | Difference |
|---|---|---|---|---|---|
61 The actual FTEs used to deliver results for this sub-sub-program are indicated at the program level 3.4 | |||||
| 7,359,795 | 8,400,000 | 1,040,205 | 0 | 061 | -0 |
| Expected Result | Performance Indicator | Targets | Results |
|---|---|---|---|
| Enhanced democratic governance in developing member countries of the Commonwealth and La Francophonie. | % of elections that take place in developing member countries that are judged to be free and fair (pertains only to countries where the organization has deployed an observation mission). | 50% | 45% |
| Improved access to secondary and tertiary education in developing member countries of the Commonwealth and La Francophonie. | % of overall secondary and tertiary enrolment in developing member countries. | Secondary: 68% Tertiary: 27% | Commonwealth: Secondary: 69% Tertiary: 15% |
| La Francophonie: Secondary: 61% Tertiary: 21% |
Performance Analysis and Lessons Learned
This sub-sub program is making good progress toward achieving its expected results. Over the past year, the Organisation Internationale de la Francophonie (OIF) supported countries of La Francophonie undergoing crises and democratic transition. Action plans for the Central African Republic were developed in support of the promotion of human rights, justice and fair elections. The OIF also continued electoral support activities in the Central African Republic, Comoros, Guinea, Guinea-Bissau, Madagascar, Mali and Togo.
DFATD continued to assist with the Commonwealth of Learning initiatives aimed at improving access to learning using distance and technology-based approaches, such as Scaling Up Support for Lifelong Learning for Farmers in Sub-Saharan Africa. This is increasing learning opportunities for hard-to-reach small holder farmers, particularly women, who have limited access to education and vocational training.
Sub-Sub-Program 3.4.2.4: Humanitarian Assistance Organizations
Description: This sub-sub-program involves the provision of long-term institutional support to humanitarian assistance organizations, including the WFP, the Canadian Foodgrains Bank, the International Committee of the Red Cross, the UN High Commissioner for Refugees, and the United Nations Office for the Coordination of Humanitarian Affairs. These organizations provide emergency goods and services, including water and sanitation, food, shelter, medical care, and protection for populations afflicted by conflict and/or natural disasters.
| Planned Spending | Actual Spending | Difference | Planned | Actual | Difference |
|---|---|---|---|---|---|
62 The actual FTEs used to deliver results for this sub-sub-program are indicated at the program level 3.4. | |||||
| 96,813,856 | 107,945,593 | 11,131,737 | 4 | 062 | -4 |
| Expected Result | Performance Indicator | Targets | Results |
|---|---|---|---|
| Strengthened capacity of the International Humanitarian System to respond to humanitarian crises. | % of Humanitarian Coordinator Pool members trained on using international law and protection in humanitarian coordination, and in working with UN and non-UN partners. | 75% | 100% |
Performance Analysis and Lessons Learned
In 2013-14, the Humanitarian Assistance Organizations sub-sub program exceeded its established performance target, with 100 percent of Humanitarian Coordinator Pool members being fully trained. Spending on humanitarian institutions was higher than planned this year due to an increase in needs and global crises, such as South Sudan, Central African Republic and Syria.
Sub-Program 3.4.3: Multilateral and Global Programming
Description: This sub-program involves programming with multilateral organizations and international initiatives to address global problems such as communicable diseases, the environment, and sustainable economic growth. DFATD engages directly with these organizations to ensure effectiveness, provides strategic policy advice, and ensures that they receive periodic independent evaluations or assessments.
| Planned Spending | Actual Spending | Difference | Planned | Actual | Difference |
|---|---|---|---|---|---|
| 326,891,138 | 396,621,519 | 69,730,381 | 15 | 12 | -3 |
| Expected Result | Performance Indicator | Target | Result |
|---|---|---|---|
| Enhanced coherence between supported multilateral and global programming and DFATD’s priorities. | % of alignment between DFATD priorities, and DFATD-supported multilateral and global programming. | 100% | 100% |
Performance Analysis and Lessons Learned
Over the past year, this sub-program met its target with 100 percent of the primary multilateral organizations receiving DFATD funding, ensuring their programming supported DFATD priorities.
n 2013-14, DFATD continued to deliver on commitments under the New Alliance for Food Security and Nutrition to support agriculture programming in Ethiopia, Ghana and Senegal, helping small holder farmers increase their productivity and benefit from improved market access. Canada has taken a leadership role, on behalf of G7 countries, to support Senegal in joining the New Alliance and developing its Cooperation Framework in November 2013. To date, close to half a billion dollars in pledges from international and Senegalese private sector investors have been made in support of this work.
DFATD worked with multilateral partners and donors to improve small holder farmers’ economic resilience to extreme climate conditions and increase their use of improved seeds, fertilizers and new crop production methods. DFATD helped promote climate-smart agriculture in Bangladesh by introducing more than 310,000 farmers to new, climate-adaptive production technologies and agronomic practices.
In its spring 2013 report, the Auditor General of Canada concluded that the former CIDA’s funding allocations were consistent with government priorities. In response to recommendations from this report, DFATD is working with partners to ensure that complete reporting on results achieved through core funding is available, and that reporting on Official Development Assistance is improved.
Sub-Program 3.4.3.1: Health Programming
Description: This sub-sub-program involves the provision of funding to multilateral/international organizations and global initiatives for health programming. DFATD’s multilateral and global health programs focus on preventing and treating major diseases such as HIV/AIDS, tuberculosis and malaria, and on addressing maternal, newborn and child health through improved nutrition, strengthening health systems, and reducing the burden of leading diseases.
| Planned Spending | Actual Spending | Difference | Planned | Actual | Difference |
|---|---|---|---|---|---|
| 224,545,842 | 282,517,402 | 57,971,560 | 15 | 12 | -3 |
| Expected Result | Performance Indicators63 | Targets | Results |
|---|---|---|---|
63 Prior to 2015, DFATD will report on the number of regions for which the target is already met or is expected to be met by 2015. There are 9 regions in total. The data sources used to report results achieved is the “Millennium Development Goals: 2013 Progress Chart”, which can found at http://www.un.org/millenniumgoals/pdf/report-2013/2013_progress_english.pdf. | |||
| Increased use of prevention and treatment services for major diseases affecting poor people in developing countries. | # of regions which have met MDG targets for HIV/AIDS, Malaria, and Tuberculosis (MDG 6). | 9 by 2015 | The HIV/AIDS target is already met or is on track to be met in 3 out of 9 regions by 2015.64 |
| The tuberculosis target is already met or is on track to be met in 5 out of 9 regions by 2015. | |||
| Of the 103 countries that had ongoing malaria transmission in 2000, 59 are meeting the MDG goal of reversing the incidence of malaria.65 66 | |||
| Increased use of prevention and treatment services for major diseases affecting poor people in developing countries. | # of regions which have met MDG Target 4.A: Reduce by two thirds, between 1990 and 2015, mortality of children under five. | 9 by 2015 | Target already met or on track to be met by 2015 in 5 out of 9 regions. |
| # of regions which have met MDG Target 5.A: Reduce maternal mortality by three quarters and MDG Target 5.B: Achieve universal access to reproductive health. | 9 by 2015 | 5A: Target already met or on track to be met by 2015 in 2 out of 9 regions.67 | |
| 5B: Target already met or on track to be met by 2015 in 1 out of 9 regions.68 | |||
Performance Analysis and Lessons Learned
Canada’s support to combatting infectious diseases such as HIV/AIDS, tuberculosis and malaria has contributed to significant results. For example, in 2013, with support from Canada and other international donors, the Global Fund to Fight AIDS, Tuberculosis and Malaria put 1.9 million new HIV-affected individuals on lifesaving antiretroviral therapy, treated 1.5 million cases of tuberculosis and distributed 50 million bednets to prevent malaria. Despite these important results, it is unlikely that the global health community will fully achieve the UN Millennium Development Goals (MDGs) in the area of combatting infectious diseases by 2015. Strong support from donors and most-affected countries themselves for prevention and treatment services will continue to be required to eliminate these diseases as public health threats in the developing world.
In this regard, in 2013-14 DFATD undertook preparations for Every Woman, Every Child Summit hosted by the Prime Minister in Toronto May 28-30, bringing together global and Canadian leaders to galvanize support for a renewed global commitment for maternal, newborn and child health.
With regards to nutrition, Canada’s leadership is helping to reduce maternal and infant mortality, and to improve the health of mothers and children in the world’s poorest countries through the Muskoka Initiative. For example, through the Scaling Up Nutrition (SUN) Movement and other global initiatives, Canada provided policy leadership to strengthen global coordination on nutrition, including leading a donor working group on tracking nutrition investments and leading a SUN donor coordination group in Senegal. In addition, with Canada’s support, the Micronutrient Initiative has ensured that an average of more than 180 million children receive two doses of vitamin A each year – a key nutritional element important for healthy development, immunity and eyesight; more than 300 million people were reached with iodized salt to prevent iodine deficiency every year – the main cause of preventable mental impairments; and nearly 2 million pregnant women received iron and folic acid supplements for healthier pregnancies each year.
Ensuring that children receive life-saving vaccines is a significant part of DFATD’s commitment to improving maternal, newborn and child health. Canada has played a leadership role in GAVI, the Vaccine Alliance, through direct support and as a founding and leading donor to the pneumococcal Advance Market Commitment (AMC), which incentivizes vaccine makers to produce suitable and affordable vaccines for the world’s poorest countries. Since 2010, more than 10 million children in 40 countries have been immunized against pneumonia, with 500,000 deaths potentially averted.
Sub-Program 3.4.3.2: Sectors/Themes Other Than Health
Description: This sub-sub-program involves the provision of funding to multilateral/international organizations and global initiatives for programming in sectors/themes other than health. This includes specific initiatives aligned with development and foreign policy objectives, often related to economic growth, the environment, education, and good governance.
| Planned Spending | Actual Spending | Difference | Planned | Actual | Difference |
|---|---|---|---|---|---|
69 The actual FTEs used to deliver results for this sub-sub-program are indicated at the program level 3.4. | |||||
| 102,345,296 | 114,104,117 | 11,758,821 | 0 | 069 | -0 |
| Expected Result | Performance Indicator | Targets | Results |
|---|---|---|---|
70 DFATD will report on the number of regions for which the target is already met or is expected to be met by 2015. There are 9 regions in total. | |||
| Increased access to nutritious food by school-age children. | Annual # of beneficiaries of school-feeding programs | 11.2 million | 18.6 million |
| Increased access to primary education by girls and boys in developing countries. | Regions where, by 2015, children everywhere, boys and girls alike, will be able to complete a full course of primary school.70 | 9 by 2015 | 2 regions out of 9 met. |
Performance Analysis and Lessons Learned
In 2013-14, this sub-sub program partly achieved its expected results. DFATD contributed to increased access to nutritious food by school-age children in Africa, which increased enrolment of children in school in 94 percent of Canadian-funded projects. Through the WFP, 18.6 million children—the majority in Africa—were provided with school meals and take-home rations in 2013.
Despite impressive progress at the start of the decade, progress in reducing the number of children out of school has slowed down considerably in recent years. Out of the nine regions of focus, only two met the MDG target that children everywhere, boys and girls alike, were able to complete primary school.
In 2013-14, DFATD integrated three crosscutting themes in its programming, including increasing environmental sustainability, advancing equality between women and men, and helping to strengthen governance institutions and practices. On environment sustainability, DFATD’s support helped over 3 million small holder farmers access timely and accurate agro meteorological forecasts, enabling them to more effectively mitigate the effects of climate variability.
Program 3.5: Canadian Engagement for Development
Description: This program focuses on cost-effective initiatives that draw on the expertise, networks, and opportunities available to Canadian organizations to increase Canadians’ engagement in international development. Programming involves co-investment in development proposals from Canadian civil society organizations, academic institutions, and professional associations to help deliver Canada’s development objectives.
| Main Estimates 2013-14 | Planned Spending 2013-14 | Total Authorities 2013–14 | 2013–14 Actual Spending (authorities used) | 2013–14 Difference (actual minus planned) |
|---|---|---|---|---|
| 267,942,474 | 267,942,474 | 242,245,091 | 241,527,494 | -26,414,980 |
| Planned 2013-14 | Actual 2013-14 | Difference 2013-14 |
|---|---|---|
71 Sub-program and Sub-sub-program allocation excludes 41 FTEs for branch corporate services allocated to Canadian Engagement for Development. | ||
| 114 | 113 | -1 |
| Expected Result | Performance Indicator | Target | Result |
|---|---|---|---|
| Enhanced engagement of Canadians and Canadian organizations in international development and the delivery of international development results aligned with DFATD priorities. | On a scale of 1 to 5, average rating of alignment of 50 to 60 representative Canadian partners’ initiatives delivering international development results with DFATD priority themes: Food Security, Children and Youth, Economic Growth, Security and Stability, and Democracy. | 3.5 | 3.48 |
Performance Analysis and Lessons Learned
In 2013-14, the Canadian Engagement for Development program met or exceeded most of its expected results for the year. Major accomplishments related to improved sustainable agricultural development through this program included the following:
- The Canadian Physicians for Aid and Relief increased rural farm incomes in Ethiopia, Malawi, Tanzania, and Uganda through the formation of producer groups and provision of business management training. Farmers in Ethiopia adopted improved crop varieties resulting in a 134 percent greater yield in 2013.
- Trade Facilitation Office Canada helped 520 developing country exporters from 23 countries grow their businesses, which resulted in new export sales of over $2.4 million for companies from Burkina Faso, Ecuador, Guyana and Haiti.
- The Canadian International Food Security Research Fund has resulted in the application of Canadian science and technology to increase agricultural yields and profits in developing countries, such as efficient millet harvesting techniques in India, and the production of high-market value indigenous vegetables in Africa. The Fund has also supported the production and marketing of products of an otherwise invasive fish species in Bolivia, designed and delivered cattle vaccines to Africa, and applied Canadian science and technology to reduce fruit losses in storage and shipping.
- The Canada Fund for African Climate Resilience was successful in rehabilitating small scale irrigation infrastructure, diversifying farming systems, improving weather forecasting, rehabilitating mangroves, and utilizing shellfish and fish stocks sustainably. Some 2,000 smallholder farmers received training and other support services directly through the project, and an estimated 400,000 farmers benefited from radio programming targeting climate smart agriculture.
Key accomplishments related to work on child and maternal health through this program included:
- The Primate’s World Relief and Development Foundation vaccinated 119,955 children and provided bicycle ambulances to 45 communities in Burundi, Mozambique and Tanzania.
- World Vision provided vitamin A to 165,000 children and mothers in Tanzania, and mobile clinics supported by the Presbyterian World Service and Development provided pre-natal care to 1,496 pregnant women and primary health care to 15,000 children in Malawi.
- The Association of Universities and Colleges of Canada improved the health of over 100,000 rural poor in 38 countries by training local health workers and traditional birth attendants, providing education on hygiene and sanitation and distributing medical equipment for health care centres.
Sub-Program 3.5.1: Partners for Development
Description: This sub-program aims to leverage Canadians’ development expertise and initiative by issuing calls for, and funding, sustainable development proposals.
| Planned Spending | Actual Spending | Difference | Planned | Actual | Difference |
|---|---|---|---|---|---|
| 248,814,845 | 224,894,713 | -23,920,132 | 57 | 61 | 4 |
| Expected Result | Performance Indicator | Target | Result |
|---|---|---|---|
| Improved local capacity to deliver sustainable health and education services to marginalized women, men and children. | On a scale of 1 to 5, rating of 15-20 representative initiatives of how Canadian partners have helped to improve their partners’ capacity to deliver basic services to underserved communities. | 3_5 | 3.5 |
| Enhanced sustainable employment opportunities, including rural livelihoods for poor women, men and youth. | On a scale of 1 to 5, average rating of 15-20 representative initiatives of how Canadian partners have contributed to increased employment opportunities and better livelihoods in rural and urban areas. | 3.5 | 3.64 |
| Enhanced political and socio-economic processes, wherein poor and marginalized segments of society increasingly find their voice. | On a scale of 1 to 5, rating of 10-20 representative initiatives of how Canadian partners have contributed to enhance political and socio-economic processes, wherein poor and marginalized segments of society increasingly find their voice. | 3.5 | 3.57 |
Performance Analysis and Lessons Learned
In 2013-14, the Partners for Development sub-program met or exceeded all of its expected results. DFATD supported 194 high-impact international development initiatives proposed by Canadian organizations. Examples of how Canadian partners improved capacities within developing countries to deliver health and education services include:
- The Colleges and Institutes Canada increased the employability of graduates in regions of Mozambique, Senegal and Tanzania in key economic sectors such as mining, agriculture, construction and tourism, resulting in over 80 percent employment of graduates.
- The Association of Universities and Colleges of Canada enhanced employment opportunities in 27 countries by building expertise to sustainably manage natural resources, strengthening support for SMEs, increasing access to demand-driven skills training, and supporting learning initiatives leading to business growth.
Canadian partners strengthened the capacity of several local organizations, in particular:
- The Federation of Canadian Municipalities facilitated the establishment of 36 new local economic development services in seven countries. Local government personnel and over 500 elected local government officials are demonstrating leadership in advancing local economic development and participatory governance models. This has led to the establishment of 80 new local services including One Stop Service Units and Local Economic Development Centres in Cambodia, Tanzania and Vietnam, where citizens and local entrepreneurs can register for services such as land and housing permits.
Sub-Program 3.5.2: Global Citizens
Description: This sub-program aims to engage Canadians as global citizens through awareness raising, education, and participation in international development.
| Planned Spending | Actual Spending | Difference | Planned | Actual | Difference |
|---|---|---|---|---|---|
| 13,943,750 | 11,448,902 | -2,494,848 | 16 | 11 | -5 |
| Expected Result | Performance Indicator | Target | Result |
|---|---|---|---|
| Increased engagement of Canadians as global citizens in international development initiatives. | On a scale of 1 to 5, average ratings of at least 10 participants for each of 5 representative partners’ initiatives regarding the value of their participation in increasing their engagement and knowledge of international development. | 3.5 | 3.75 |
Performance Analysis and Lessons Learned
In 2013-14, the Global Citizens sub-program exceeded its expected result, supporting a number of training and engagement projects to increase awareness among Canadians of international development issues. The International Youth Internship funded 329 internships with 24 Canadian organizations, with over 80 percent of participating youth remaining employed in international development work and/or continuing their participation in international development initiatives.
In August 2013, the International School Twinning Initiative pilot, a partnership between Canadian and developing country schools, came to completion. Of the students that participated in the program, 86 percent became engaged as global citizens and demonstrated an increased understanding of international development issues. DFATD is exploring ways in which the best elements of the pilot could be incorporated into a refreshed program that would increase the number of communities that could benefit from the initiative.
Strategic Outcome 4: Canada’s International Platform - DFATD maintains a mission network of infrastructure and services to enable the Government of Canada to achieve its international priorities.
Program 4.1: Governance, Strategic Direction and Common Service Delivery
Description: Through this program, DFATD provides governance, strategic direction and leadership, manages change, delivers services and provides infrastructure to the mission platform.
| Main Estimates 2013-14 | Planned Spending 2013-14 | Total Authorities 2013–14 | 2013–14 Actual Spending (authorities used) | 2013–14 Difference (actual minus planned) |
|---|---|---|---|---|
| 650,086,909 | 650,086,909 | 714,341,149 | 620,548,488 | -29,538,421 |
| Planned 2013-14 | Actual 2013-14 | Difference 2013-14 |
|---|---|---|
| 4,364 | 4,083 | -281 |
| Expected Result | Performance Indicator | Target | Result |
|---|---|---|---|
| Efficient and cost-effective common services and support for Canada’s representation abroad are provided. | % of clients (OGDs, partner and co-locator representatives) who feel they have the information and/or services they needed from DFATD to carry out their mandate. | 75% | 89% |
| % of Common Services delivered in compliance with service delivery standards. | 75% | 90% | |
| % of corrective measures recommended in external audit management letters and internal audit reports that were implemented within set time frames. | 100% | 90% |
Performance Analysis and Lessons Learned
This program supports the delivery of a broad range of common services to Canada’s network of 174 missions abroad, including: materiel management and procurement services; banking and financial services; real property management; mission security; information management and information technology support; and human resource management of locally engaged staff (LES), including LES supporting the work of over 30 partner departments and co-locators working abroad.
The department exceeded its targets for eleven of the 14 performance indicators assessed for this program, an increase from seven in 2012-13. The target was achieved for one performance indicator, and two targets were not achieved, compared to four not achieved in 2012-13. The two targets that were not met – two audit recommendations and a Departmental security plan as a result of amalgamation – are currently progressing towards completion.
Over the past year, 90 percent of common services were delivered in compliance with service standards, an increase since 2012-13. Overall, 89 percent of mission partners felt they received the information and services they needed from DFATD to carry out their mandates, which exceeded the target and the previous year’s results.
Strategia, a new integrated planning and reporting system, was launched in November 2013 to streamline and improve mission planning and reporting. Strategia integrates four major mission planning functions into a single online portal, enhancing the alignment of mission plans and activities with budget allocations.
Ongoing automation of key mission network management tools continued to increase the efficiency of the network, including: the Foreign Service Directives portal; online modules for submitting requests for transportation services, property and materiel, Management and Consular Officer (MCO) help and human resource re-classifications; an automated materiel management system; and by the costing automation tool, which generates the cost of position-change requests within the network.
Sub-Program 4.1.1: Mission Platform Governance and Common Services
Description: This sub-program provides the costing framework for common services so that clients and partners at missions receive cost-effective and efficient common services and infrastructure support.
| Planned Spending | Actual Spending | Difference | Planned | Actual | Difference |
|---|---|---|---|---|---|
| 139,619,909 | 141,399,743 | 1,779,834 | 2,239 | 2,087 | -152 |
| Expected Result | Performance Indicator | Target | Result |
|---|---|---|---|
72 This target was adjusted mid-year to align with the other program targets. | |||
| Clients and partners at missions receive cost effective and efficient common services and infrastructure support in accordance with service standards (procurement, logistics, diplomatic mail, banking and financial services). | % of service standards action times in compliance with the Service Level Agreement (diplomatic mail, procurement and logistics). | 75% | 92% |
| % of financial services provided within established service standards. | 75%72 | 95% | |
| Departmental and OGD clients receive services related to human resources and positions modifications abroad in accordance with services standards. | % of partners who agree that human resources services were in compliance with established services standards. | 75% | 82% |
Performance Analysis and Lessons Learned
Through a common services costing and delivery framework, this sub-program ensures that missions receive cost-effective and efficient common services such as procurement, contracting, logistics support, diplomatic mail, banking and financial services.
The department exceeded all of its performance targets for this sub-program over the past year. A new mail-tracking module was introduced, allowing missions to accurately track mail and parcels, thereby achieving a 94-percent compliance rate with service standards for diplomatic mail. Transportation services were also improved through outreach to clients, consolidation of shipments and more strategic travel itineraries.
Progress was made on the Procurement Modernization Initiative, which implemented a new governance structure to enhance procurement service delivery, accountability and reporting. DFATD continued to deliver high-quality human resources services to mission partners, achieving 82-percent compliance with established service standards, a notable 12-percent increase over 2012-13.
Sub-Program 4.1.2: Real Property
Description: This sub-program facilitates centralized decision making on property planning and project management, so that the Government of Canada receives timely and cost effective property services and maintenance in support of its programs abroad.
| Planned Spending | Actual Spending | Difference | Planned | Actual | Difference |
|---|---|---|---|---|---|
73 The variance is mainly due to unused funds from the Special Purpose Allotments. | |||||
| 354,110,009 | 309,044,320 | -45,065,68973 | 152 | 148 | -4 |
| Expected Result | Performance Indicator | Target | Result |
|---|---|---|---|
| The Government of Canada receives efficient and effective property services in support of its programs abroad. | % of program managers who indicate that the mission Platform offers the functional real property for the delivery of their programs. | 85% | 91% |
| % of capital dollars re-invested to maintain the value of Crown asset. | 4% | 5% |
Performance Analysis and Lessons Learned
This sub-program supports the management of DFATD’s real property portfolio abroad, which includes 2,256 Crown-owned and leased properties, with an estimated combined value of $3.2 billion. Over the past year, this sub-program exceeded its performance targets.
To improve the efficiency and cost-effectiveness of the international platform, DFATD continued to lower the cost of accommodating Canada’s representatives abroad by reducing the size of official residences. Budget 2012 announced that “The Government will sell some Official Residences abroad and move to more practical and economical ones, generating capital revenue of $80 million.” The residences that have been sold or are due for sale are either far too large or costly for Canadian taxpayers. Over the long-term, these sales will mean significant ongoing operational savings.
DFATD continued to implement the government’s new office standard, Workplace 2.0, through retrofitting and renovating new diplomatic office space abroad, with the goal of reducing costs and providing enhanced collaborative workspace. Workplace 2.0 has been implemented in the mission in Hong Kong, and missions in Yangon, Burma, and Bangalore, India, are under way, with completion expected by the end of fiscal year 2014-15.
In 2013-14, DFATD invested $201.6 millionFootnote 74 in major capital projects and $10.9 million on approximately 460 maintenance projects abroad. In addition, DFATD re-invested $156.9 million—5 percent of the replacement value of its portfolio—to maintain the value of Crown assets.
In order to optimize real property management, a modernization plan was developed and implemented that included more than 25 initiatives and strategies. This plan included the development of new policies and the implementation of a performance measurement and risk management framework to improve management of property projects. A memorandum of understanding with Parks Canada was also put in place to support the protection of the heritage value of DFATD properties.
Sub-Program 4.1.3: Security
Description: This sub-program provides on-site security inspections, safety audits and risk assessments to ensure that missions are secure, personnel are safe, and federal partners’ and other co-locators’ assets and information are protected at missions abroad. It includes the implementation of the Departmental Security Plan (DSP), through which work in this sub-program is coordinated and monitored.
| Planned Spending | Actual Spending | Difference | Planned | Actual | Difference |
|---|---|---|---|---|---|
| 53,002,052 | 50,927,256 | -2,074,796 | 224 | 215 | -9 |
| Expected Result | Performance Indicator | Target | Result |
|---|---|---|---|
| Missions are secure, personnel are safe, and government and partner assets and information are protected at missions abroad. | Degree to which, on a scale of 1 to 5, the Departmental Security Plan is effectively implemented. | 4 | 3 |
Performance Analysis and Lessons Learned
DFATD consistently works to enhance the security of personnel and information in Canada and abroad through a domestic security strategy and the implementation of its DSP. Following amalgamation, DFATD is updating the DSP to reflect the needs of the new department and the evolving security environment. This period of transition for the DSP is reflected in a lower-than-expected performance score relative to the target for this sub-program.
To improve the department’s awareness of its security environment, almost all missions now use DFATD’s Security Incident Reporting Tool. The tool was used to report approximately 925 incidents in 2013-14.
Training for Security Program Managers was enhanced, including specialized training for high-risk missions, such as the High Commission of Canada in Nairobi, Kenya, and Juba, South Sudan. Security and emergency management briefings were delivered and personnel at missions and HQ received training through various security courses.
To improve security at key missions abroad, DFATD deployed six additional Security Program Managers and five Security Support Officers and provided additional security equipment to the High Commission of Canada in Kenya, the Embassy of Canada to Israel, the Representative Office of Canada to the Palestinian Authority, the Office of the Embassy of Canada (and now full embassy) to South Sudan and the Embassy of Canada to Ukraine.
Critical infrastructure protection projects were implemented to substantially enhance security at Canadian chanceries, for example, at the Embassy of Canada to Mali, the Embassy of Canada to Lebanon, the Embassy of Canada to Egypt, the Embassy of Canada to Zimbabwe and the High Commission of Canada in South Africa. In 2013-14, DFATD’s capital projects incorporated the design, acquisition and installation of a full range of physical security protection measures, including armoured vehicles, X-ray machines, metal detectors, radio networks, ballistic- and blast-resistant materials and closed-circuit television systems.
Sub-Program 4.1.4: Information Management / Information technology
Description: This sub-program facilitates the delivery of information management/information technology (IM/IT) services across Canada’s network of missions abroad.
| Planned Spending | Actual Spending | Difference | Planned | Actual | Difference |
|---|---|---|---|---|---|
75 The variance is due to funding received for the LES Salary revisions. | |||||
| 37,236,405 | 40,498,531 | 3,262,12675 | 303 | 292 | -11 |
| Expected Result | Performance Indicator | Target | Result |
|---|---|---|---|
| Clients at missions receive information management/information technology services in accordance with service standards. | % of mission procurement requests made using Shop@DFATD that met service delivery standards. | 80% | 95% |
| % of documents at missions stored in a folder structure within official corporate repositories. | 75% | 77% | |
| % of mission call centre requests addressed that met the service delivery standards. | 95% | 95% |
Performance Analysis and Lessons Learned
Through this sub-program, collectively DFATD and Shared Services Canada (SSC) provide Canada’s network of missions abroad with 24/7 access to a global telecommunications infrastructure. Over the past year, these services as well as information management at missions exceeded targets, while performance expectations were achieved for mission call centre requests.
To ensure that IM/IT priorities were aligned to the business needs of the newly amalgamated department, DFATD collaborated with SSC to strengthen the integration of departmental IM/IT planning, governance, project oversight and risk management. This was achieved through enhanced collaboration and consultation with clients and the application of optimized business practices.
The completion of the renewal of SIGNET—the IT infrastructure supporting Canada’s international mission network—was a major accomplishment for the DFATD/SSC partnership in 2013-14. This renewal provided a common desktop, with improved mobility and collaboration tools, for use by DFATD and its partners abroad.
Sub-Program 4.1.5: Other Government Departments Locally Engaged Staff
Description: This sub-program enables locally engaged staff (LES) supporting other government departments (OGD) at missions to receive timely and efficient salary payments.
| Planned Spending | Actual Spending | Difference | Planned | Actual | Difference |
|---|---|---|---|---|---|
76 The variance is due to funding received for the LES Salary revisions. | |||||
| 66,118,534 | 78,678,683 | 12,560,10476 | 1,446 | 1,341 | -105 |
| Expected Result | Performance Indicator | Target | Result |
|---|---|---|---|
| OGD LES at missions receive timely and efficient salary payments. | % of OGD LES managed according to updated Terms and Conditions of Employment. | 90% | 100% |
| % of salary adjustments to OGD LES implemented in a timely manner. | 90% | 100% |
Performance Analysis and Lessons Learned
DFATD acts as the employer for 5,345 LES at missions abroad, of which 1,375 support the work of over 30 partner departments and co-locators. This sub-program enables DFATD to provide these LES with timely, accurate and efficient salary payments, while maintaining and updating the policy framework and procedures governing LES working at Canada’s network of missions abroad.
Over the past year, the performance of this sub-program exceeded both of its targets. The Total Compensation Review continued, and updates to 25 terms and conditions of employment were implemented.
To increase the efficiency of providing LES benefits, plans to outsource the administration of the pension plan for LES in the United States were finalized and new or updated insurance benefits were implemented in 19 countries. A contracting framework was developed and provided to the Treasury Board Secretariat to further facilitate contracting of benefits providers and advisors required to support the provision of LES benefits. The LES social security affiliation policy was drafted, and a review was initiated in 2013-14. This policy provides guiding principles to ensure that local and international laws are respected, LES are valued, risks are mitigated, and administrative complexity is minimized.
Program 4.2: Government of Canada Benefits
Description: This program is the vehicle through which the department and central agencies manage statutory and other payments to Government of Canada employees abroad, including both Canada-based staff (CBS) and Locally Engaged Staff (LES).
| Main Estimates 2013-14 | Planned Spending 2013-14 | Total Authorities 2013–14 | 2013–14 Actual Spending (authorities used) | 2013–14 Difference (actual minus planned) |
|---|---|---|---|---|
| 201,565,520 | 201,565,519 | 229,870,882 | 229,133,960 | 27,568,441 |
| Planned 2013-14 | Actual 2013-14 | Difference 2013-14 |
|---|---|---|
| 62 | 54 | -8 |
| Expected Result | Performance Indicator | Target | Result |
|---|---|---|---|
| Timely and appropriate Foreign Service Directives (FSD) and LES allowances, benefit payments and other services are delivered sustainably. | Degree to which, on scale of 1 to 5, the department demonstrated leadership in the interdepartmental governance structures and National Joint Council. | 5 | 5 |
| % of required FSD payments to CBS that were made accurately and within established service standards. | 80% | 95% | |
| % of required payments to service providers and LES that were made accurately and within established services standards. | 75% | 93% |
Performance Analysis and Lessons Learned
In 2012, the responsibility for the administration of all LES pensions, insurance and social security policies and payments was transferred from the Treasury Board Secretariat to DFATD. Through the Government of Canada Benefits program, DFATD manages the administration and payments associated with Foreign Service Directives (FSDs), as well as payments to LES pension, insurance and local social security programs.
FSDs are policies governing the benefits, allowances and conditions of employment for CBS serving abroad, including relocation to and from missions and education allowances for dependent children. Consequently, this program also supports cooperation between DFATD and the National Joint Council (NJC) of the Public Service of Canada. The NJC’s FSD Committee reviews and recommends changes to FSDs during a cyclical review process that usually occurs every three years.
This program met its targets for one performance indicator and exceeded its targets for two indicators. Over the past year, DFATD led interdepartmental consultations to develop and draft a comprehensive package of FSD proposals, which was endorsed by DFATD senior management and partner departments. DFATD also presented a series of proposals, policies and positions that were endorsed by the various interdepartmental governance structures and the NJC.
The department achieved effective governance of LES pension, insurance, and social security programs through quarterly meetings of the LES Pension and Benefits Governance Committee, which provides strategic advice and serves as a focal point for management of the LES Pension and Benefits Program. In 2013-14, initial discussions were held regarding the modernization of LES benefits.
The U.S. Pension Investment Committee provides advice and recommendations on the U.S. pension trust assets, including developing investment policy, overseeing investment managers and reviewing the fund’s performance. In 2013-14, a review of the investment strategy for the U.S LES pension plans was undertaken, and charging principles were developed to ensure efficient fiscal management.
Sub-Program 4.2.1: Foreign Service Directives Payments
Description: This sub-program delivers Foreign Service Directives (FSD) benefits and services.
| Planned Spending | Actual Spending | Difference | Planned | Actual | Difference |
|---|---|---|---|---|---|
77 The variance is due to funding received for expenditure fluctuations for allowances provided to CBS working abroad, as well as through TB Central Votes, such as Operating Budget Carry forward amounts. | |||||
| 134,983,879 | 162,318,222 | 27,334,34377 | 45 | 39 | -6 |
| Expected Result | Performance Indicator | Target | Result |
|---|---|---|---|
| Clients are satisfied with services related to allowances and other benefits they receive under the Foreign Service Directives. | % of CBS employees (CBS at missions and CBS who relocated back to Canada) who responded that they were satisfied with FSD services. | 75% | 82% |
| Clients have a good level of knowledge and awareness of Foreign Service Directive benefits and related services. | % of CBS employees (CBS at missions and CBS who relocated back to Canada) who responded that they had a good awareness of FSD benefits, policy and procedures. | 75% | 88% |
Performance Analysis and Lessons Learned
This sub-program ensures FSD clients receive timely and accurate allowances and other benefits, while contributing to a high level of knowledge and awareness of FSD benefits and services. This sub-program also manages the administration and payment of FSD benefits to ensure they are delivered sustainably.
Targets for both performance indicators were exceeded in 2013-14: 82 percent of CBS responded that they were satisfied with FSD services—the highest overall satisfaction rating since the client-service questionnaire was launched in 2009—and 88 percent of CBS responded that they had a good, very good or excellent knowledge of the FSD benefits, policy and procedures. The latter result was due to efforts to increase CBS client awareness of FSDs that included a redesigned website, a new Foreign Service handbook and an extended pre-posting program.
In 2013-14, the financial management of FSDs was strengthened with the completion of the FSD forecasting model that increased the accessibility of FSD data for managers, which supported trends analysis and timely FSD decision making. The FSD forecasting model contributed to a reduction in annual FSD expenditures that fell within 5 percent of the forecast.
Implementation of the FSD Portal continued with the automation of 11 FSDs, which increased the efficiency and cost-effectiveness of FSD administration. The FSD Portal enables CBS at missions to request and certify travel allowances electronically, as well as view monthly allowances and payments.
Sub-Program 4.2.2: Employer contributions to LES Pensions, Insurance and Social Security Programs
Description: This sub-program enables the management and administration of LES pensions, insurance plans and enrolment in local social security programs to ensure LES are appropriately compensated.
| Planned Spending | Actual Spending | Difference | Planned | Actual | Difference |
|---|---|---|---|---|---|
| 66,581,640 | 66,815,738 | 234,098 | 17 | 15 | -2 |
| Expected Result | Performance Indicator | Target | Result |
|---|---|---|---|
| LES are appropriately compensated (pensions, insurances and social security) | % of LES employees who indicated they were aware of where to obtain information on pensions, insurance and social security programs and appropriate service standards. | 75% | 60% |
| % of LES clients that received services within service standards pertaining to pensions, insurance and social security programs. | 75% | 78% |
Performance Analysis and Lessons Learned
Since 2012, DFATD has assumed responsibility from the Treasury Board Secretariat for the administration of all LES pensions, insurance and social security payments, using international labour market analysis, for more than 5,350 LES in 107 countries.
DFATD is also responsible for issuing mission-specific Terms and Conditions of Employment, which provide information on the mission-specific compensation and benefit programs for LES.
This sub-program exceeded one target but did not meet the target for a second performance indicator that was used for the first time. The department will proactively promote where this information is already available and monitor the situation in order to ensure that results are being adequately captured and clients are provided with appropriate support.
Internal Services
Description: The internal services program provides the essential support functions that enable DFATD to carry out its mandate, including governance and management support; learning and development; resource management services; and asset management services.
| Main Estimates 2013-14 | Planned Spending 2013-14 | Total Authorities 2013–14 | 2013–14 Actual Spending (authorities used) | 2013–14 Difference (actual minus planned) |
|---|---|---|---|---|
| 273,700,251 | 273,697,079 | 300,970,624 | 279,215,822 | 5,518,743 |
| Planned 2013-14 | Actual 2013-14 | Difference 2013-14 |
|---|---|---|
| 2,104 | 1,984 | -120 |
Performance Analysis and Lessons Learned
Governance, Management and Support
Pursuing the objectives of amalgamation has been central to the agenda of the executive committee, both in terms of the organizational adjustments that need to be made and in its day to day activities. The department also sought the views of staff through formal and informal engagement channels.
The constituting legislation was passed in June 2013. The new governance and organizational structures put in place have enabled greater policy coherence and program coordination and efficiencies. We have seen some concrete progress in the elaboration of our New Directions policy on development, and in the agility of our response to natural disasters, such as Typhoon Haiyan, and major foreign policy crises, such as Ukraine. The role of head of mission has been adjusted to reflect the importance of integrating the various departmental objectives in mission activities. To build a common organizational culture while fostering essential expertise, human resource planning is increasingly reducing the barriers to a more flexible, consolidated workforce, beginning with the executive cadre.
Some of the key corporate tools are also being integrated to support the objectives of amalgamation. For example, Strategia, was launched to consolidate planning processes at our missions, eventually to include political, trade and development planning. The human resources management system of the two old departments was merged, while interim solutions were adopted for the financial management systems as full harmonization is being developed.
Amalgamation entailed significant work to ensure integration of corporate planning, performance and risk management functions. Corporate Governance Committees were fully integrated and aligned to the mandate of the new department, and work began on a new Program Alignment Architecture to take effect in 2015-16. DFATD’s risk management function was assessed as “Acceptable”, the highest rating possible, through the 2013-14 Management Accountability Framework (MAF) process.
DFATD communications ensured that domestic and international audiences were aware of Canadian foreign policy, trade and international development initiatives abroad through various media platforms. Ministerial participation in high-level summits, conferences and bilateral visits was supported, and communications materials were developed to support the department and ministers, including 707 news releases, 417 speeches, 226 media advisories, 228 photo releases and 16 web videos, resulting in distribution of these products to nearly 5 million recipients. DFATD responded to nearly 3,954 media inquiries and answered 54,548 calls and emails from the public. Internally, visibility of communications activities was ensured through development of a new integrated DFATD intranet site.
High-quality legal services supported departmental clients and Government of Canada partners on international matters, such as trade, investment, and strategic negotiations. Overall, DFATD tabled 50 treaties in the House of Commons with assistance from legal services, an increase of over 60 percent from 2012-13.
The CIDA and DFAIT Internal Audit functions merged while continuing to ensure high risk areas were audited. Management Action Plans were developed in response to audit recommendations and subsequently presented to the Departmental Audit Committee for their review. DFATD’s merged audit function was assessed as “Acceptable”, the highest rating possible, through the 2013-14 MAF process.
The Office of the Inspector General conducted 10 mission inspections, 4 investigations and 4 evaluations and studies ensuring senior management are well informed on the strength of the department’s management framework. DFATD’s evaluation function was assessed as “Acceptable”, the highest rating possible, through the 2013-14 MAF process.
DFATD created an office for Values and Ethics and Workplace Wellbeing to increase awareness and compliance with the Values and Ethics Code for the Public Service and DFATD’s Values and Ethics Code, and Code of Conduct for Representatives Abroad. Work was undertaken to improve the department's capacity to manage interpersonal conflicts more effectively and to enhance employee well-being. DFATD’s values and ethics work received a MAF rating of ‘”Acceptable”, the highest rating possible, for 2013-14.
Resource Management Services
Over the past year, DFATD focused on the effective amalgamation of resources, including careful identification of potential risks and cost-saving areas. The department ensured that Information Management/Information Technology (IM/IT) priorities were consolidated and aligned to the business needs of the new department. The IM/IT Strategy Committee reviewed 39 projects valued at an estimated $25 million, of which $7.7 million was secured through the departmental management reserve. The renewal of SIGNET was completed in 2013-14, providing an improved IT platform for employees and partners.
Human resource strategies were put in place for the new department, and a WorkForce Management Committee was established to ensure transparency and consistency regarding human resources activities. DFATD standardized its HR business processes through the successful implementation of the Government of Canada Common HR Business Processes and financial reporting procedures. The Financial Management Advisor model was revised to ensure high-quality client service. DFATD’s financial and human resource management functions were assessed as “Acceptable”, the highest rating possible, through the 2013-14 MAF process.
A Corporate Health Strategy was developed in collaboration with departmental stakeholders and is the framework for all departmental related health programs, services or wellness initiatives.
Corporate training was aligned to new departmental needs and priorities, particularly for financial management and the rollout of the new DFATD corporate platform, for both Canadian and LES. Workshops and seminars were developed and delivered with the objective of bringing greater cohesion between the development, policy, and trade streams. Learning road maps for employees across the streams were improved to foster awareness across the newly amalgamated department.
Foreign Language (FL) capacity of the workforce was improved through the provision of FL training, extended to include development staff, including providing in-country immersion opportunities and promoting FL testing to assist HR staffing.
Asset Management Services
Alignment of accommodation planning and operations with DFATD’s Domestic Accommodation Real Estate Strategy continued over the year, and commodity strategies were developed to optimize the supply chain life cycle and enhance the management of the acquisition of materiel and assets at DFATD headquarters. Following an assessment of the supply chain for goods and services, a new governance structure for procurement was pilot tested to identify opportunities to strengthen service delivery, accountabilities and functional authorities.
Section 3: Supplementary Information
Financial Statements Highlights
The financial highlights presented within this Departmental Performance Report are intended to serve as a general overview of the department’s financial position and operations. The department’s consolidated financial statements (unaudited) are prepared in accordance with accrual accounting principles and are therefore different from the information published in the Public Accounts of Canada, which are prepared on an appropriation basis. The detailed consolidated financial statements of the department can be found on the department's website.
The charts below illustrate the March 31, 2014, ending balances for each major financial statement grouping, along with the corresponding change from the previous fiscal year.
| For the Year Ended March 31, 2014 ($ millions) | 2013-14 Planned Results | 2013-14 Actual | 2012-13 Actual | Difference (2013–14 planned minus actual) | Difference (2013–14 actual minus 2012–13 actual) |
|---|---|---|---|---|---|
| Total expenses | 2,608 | 5,093 | 2,594 | (2,485) | 2,499 |
| Total revenues | 340 | 115 | 355 | 255 | (240) |
| Net cost of operations before government funding and transfers | 2,268 | 4,978 | 2,239 | (2,710) | 2,739 |
| Departmental net financial position | 1,165 | 1,257 | (92) |
Expenses
The department’s overall expenses increased by $2,499 million during 2013-14, primarily due to the amalgamation of the former DFAIT with the former CIDA, which was slightly offset by the transfer of Passport Canada to Citizenship and Immigration Canada (CIC) and Employment and Social Development Canada (ESDC).
Expenses by Program

This pie chart displays a breakdown of the department’s overall expenses by program. The twelve programs of the department are listed in order of highest percentage of expense, as follows: Diplomacy and Advocacy at 19%, Fragile States and Crisis-Affected Communities at 17.2%, Governance, Strategic Direction and Common Service Delivery at 13.5%, Low-Income Countries at 12.2%, Global Engagement and Strategic Policy at 11.8%, Middle-Income Countries at 5.8%, Internal Services at 5.4%, Government of Canada Benefits at 4.8%, Canadian Engagement for Development at 4%, International Commerce at 3.2%, International Policy Advice and Integration at 2% and Consular Services and Emergency Management at 1.2%.
Revenues
The $240-million decrease in revenue is entirely due to the transfer of Passport Canada to CIC. Excluding this transfer, departmental revenues have not changed significantly. Revenues earned on behalf of the government were $771.1 million in 2013-14 compared to $141 million in 2012-13. These revenues are returned to the Consolidated Revenue Fund (CRF) and are not available for use by the department.
Revenue breakdown
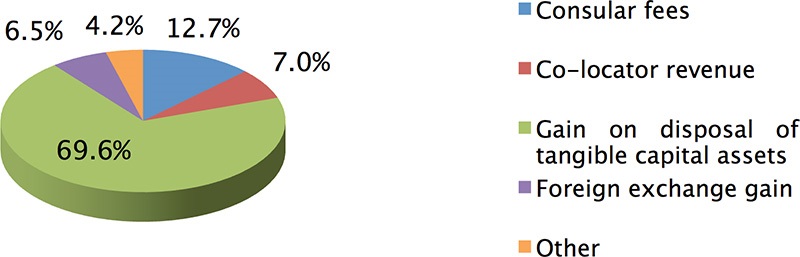
This pie chart displays a breakdown of the department’s overall revenue sources in 2013-14. Gain on disposal of tangible capital assets comprises the majority of the department’s revenue at 69.6%, followed by consular fees at 12.7%, co-locator revenue at 7%, foreign exchange gain at 6.5% and Other sources at 4.2%.
| March 31, 2014 ($ millions) | 2013-14 | 2012-13 | Difference |
|---|---|---|---|
| Total net liabilities | 1,297 | 413 | 884 |
| Total net financial assets | 1,118 | 265 | 853 |
| Departmental net debt | 179 | 148 | 31 |
| Total non-financial assets | 1,344 | 1,405 | (61) |
| Departmental net financial position | 1,165 | 1,257 | (92) |
On the amalgamation date of June 26, 2013, former CIDA’s asset and liability balances were transferred to DFATD. On July 2, 2013, Passport Canada’s assets and liabilities were transferred to CIC and ESDC.
Liabilities
The department’s total liabilities increased by $884 million (or 214 percent) in 2013-14, compared to 2012-13, mainly as a result of the amalgamation of the former DFAIT with the former CIDA, which was slightly offset by the transfer of Passport Canada’s liabilities to CIC.
Liability Breakdown

This bar graph shows the breakdown of the department’s liabilities for 2013-14. Accounts payable and accrued liabilities account for the vast majority of the departmental total at 87.1%, followed by employee future benefits at 10.4% and vacation pay and compensatory leave at 2.5%.
Assets
The department’s total assets increased by $792 million (or 47.4 percent) in 2013-14. The amalgamation of the former DFAIT with the former CIDA was the main reason for the $866-million increase in payments to the CRF, which was slightly offset by the transfer of Passport Canada’s assets to CIC and ESDC. The “Due from CRF” increase is the result of timing differences at year-end between the time when a transaction affects departmental authorities and when it is processed through the CRF, and is directly related to the significant increase in the amount of accounts payable and accrued liabilities transferred from the former CIDA. Non-financial assets have decreased slightly due mainly to the transfer of Passport Canada’s tangible capital assets to CIC and ESDC.
Asset Breakdown

This bar graph shows the breakdown of the department’s assets for 2013-14. Tangible capital assets account for 53.7% of the departmental total, followed by assets due from the Consolidated Revenue Fund at 41.5%, accounts receivable and advances at 3.9% and other assets at 0.8%.
Financial Statements
To view the financial statements and related documents, please visit the Office of the Chief Financial Officer.
List of Supplementary Information Tables
The supplementary information tables listed in the 2013–14 Departmental Performance Report can be found on DFATD’s website.
- Departmental Sustainable Development Strategy
- Details on Transfer Payment Programs
Ex-Foreign Affairs and International Trade Canada
- Afghanistan Counter-Narcotics Program
- Anti-Crime Capacity Building Program
- Canada Fund for Local Initiatives
- Commonwealth Secretariat
- Counter-Terrorism Capacity Building Program
- Food and Agriculture Organization of the United Nations
- Global Commerce Support Program
- Global Partnership Program
- Global Peace and Security Fund and its component programs
- Grants and Contributions in Aid of Academic Relations
- International Atomic Energy Agency
- International Criminal Court
- International Labour Organization
- International Organisation of La Francophonie
- International Science and Technology Partnership Program
- Investment Cooperation Program
- North Atlantic Treaty Organization Civil Administration
- Organisation for Economic Co-operation and Development
- Organization for Security and Co-operation in Europe
- Organization of American States
- Payments in Lieu of Taxes on Diplomatic, Consular and International Organizations’ Property in Canada
- Projects and Development Activities Resulting from Francophonie Summits
- United Nations Educational, Scientific and Cultural Organization
- United Nations Organization
- United Nations Peacekeeping Operations
- World Trade Organization
Ex-Canadian International Development Agency
- International Development Assistance
- International Financial Institutions
- Advance Market Commitment for Pneumococcal Vaccine
- Horizontal initiatives
- Global Peace and Security Fund
- Internal Audits and Evaluations
- Internal Audits
- Internal Evaluations
- Response to Parliamentary Committees and External Audits
- Sources of Respendable and Non–Respendable Revenue
- Up-Front Multi-Year Funding
- Centre for International Governance Innovation
- User Fees Reporting
- Access to Information
- International Experience Canada
- Export/Import Fees
- Consular Services
- Specialized Consular Services
- User Fee Reporting Totals
Tax Expenditures and Evaluations
The tax system can be used to achieve public policy objectives through the application of special measures such as low tax rates, exemptions, deductions, deferrals and credits. The Department of Finance Canada publishes cost estimates and projections for these measures annually in the Tax Expenditures and Evaluations publication. The tax measures presented in the Tax Expenditures and Evaluations publication are the sole responsibility of the Minister of Finance.
Section 4: Organizational Contact Information
4.1 Organizational Contact Information
Foreign Affairs, Trade and Development Canada (DFATD)
Tel.: 1-800-267-8376 (toll-free in Canada);
613-944-4000 (National Capital Region and outside Canada)
TTY: 613-944-9136
Fax: 613-996-9709
www.international.gc.ca
Enquiries Services
Foreign Affairs, Trade and Development Canada
125 Sussex Drive
Ottawa, ON K1A 0G2
email: enqserv@international.gc.ca
Tel.: 1-800-267-8376 (toll-free in Canada);
613-944-4000 (National Capital Region and outside Canada)
Fax: Fax: 613-996-9709
Other Portfolio Related Contacts
Canadian Commercial Corporation
50 O'Connor Street, Suite 1100
Ottawa, ON K1A 0S6
Tel.: 1-800-748-8191 (toll-free in Canada); 613-996-0034 (National Capital Region and outside Canada)
Fax: 613-995-2121
www.ccc.ca
International Joint Commission (Canadian Section)
234 Laurier Avenue West, 22nd Floor
Ottawa, ON K1P 6K6
Tel.: 613-996-2984
Fax: 613-993-5583
www.ijc.org
Export Development Canada (EDC)
150 Slater Street
Ottawa, ON K1A 1K3
Tel.: 613-598-2500 (local); 1-800-267-8510 (toll-free North America)
TTY: 1-866-574-0451
www.edc.ca
Roosevelt Campobello International Park
459 Route 774
Welshpool, New Brunswick E5E 1A4
Tel.: 506-752-2922 (local) or 1-877-851-6663 (toll-fee)
Fax: 506-752-6000
www.fdr.net
International Development Research Centre (IDRC)
150 Kent Street
Ottawa, ON K1P 0B2
Postal Address: P.O. Box 8500
Ottawa, ON K1G 3H9
Tel.: 613-236-6163
Fax: 613-238-7230
www.idrc.ca
National Capital Commission (NCC)
202-40 Elgin Street
Ottawa, ON K1P 1C7
Tel.: 613-239-5000 or 1-800-465-1867 (toll-free)
TTY: 613-239-5090 or 1-866-661-3530 (toll-free)
Fax: 613-239-5063
www.ncc-ccn.gc.ca
Appendix: Definitions
Appropriation: Any authority of Parliament to pay money out of the Consolidated Revenue Fund.
Budgetary expenditures: Include operating and capital expenditures; transfer payments to other levels of government, organizations or individuals; and payments to Crown corporations.
Departmental Performance Report: Reports on an appropriated organization’s actual accomplishments against the plans, priorities and expected results set out in the corresponding Reports on Plans and Priorities. These reports are tabled in Parliament in the fall.
Full-time equivalent: Is a measure of the extent to which an employee represents a full person-year charge against a departmental budget. Full-time equivalents are calculated as a ratio of assigned hours of work to scheduled hours of work. Scheduled hours of work are set out in collective agreements.
Government of Canada outcomes: A set of 16 high-level objectives defined for the government as a whole, grouped in four spending areas: economic affairs, social affairs, international affairs and government affairs.
Management, Resources and Results Structure: A comprehensive framework that consists of an organization’s inventory of programs, resources, results, performance indicators and governance information. Programs and results are depicted in their hierarchical relationship to each other and to the Strategic Outcome(s) to which they contribute. The Management, Resources and Results Structure is developed from the Program Alignment Architecture.
Non-budgetary expenditures: Include net outlays and receipts related to loans, investments and advances, which change the composition of the financial assets of the Government of Canada.
Performance: What an organization did with its resources to achieve its results, how well those results compare to what the organization intended to achieve and how well lessons learned have been identified.
Performance indicator: A qualitative or quantitative means of measuring an output or outcome, with the intention of gauging the performance of an organization, program, policy or initiative respecting expected results.
Performance reporting: The process of communicating evidence-based performance information. Performance reporting supports decision making, accountability and transparency.
Planned spending: For Reports on Plans and Priorities (RPPs) and Departmental Performance Reports (DPRs), planned spending refers to those amounts that receive Treasury Board approval by February 1. Therefore, planned spending may include amounts incremental to planned expenditures presented in the Main Estimates.
A department is expected to be aware of the authorities that it has sought and received. The determination of planned spending is a departmental responsibility, and departments must be able to defend the expenditure and accrual numbers presented in their RPPs and DPRs.
Plans: The articulation of strategic choices, which provides information on how an organization intends to achieve its priorities and associated results. Generally a plan will explain the logic behind the strategies chosen and tend to focus on actions that lead up to the expected result.
Priorities: Plans or projects that an organization has chosen to focus and report on during the planning period. Priorities represent the things that are most important or what must be done first to support the achievement of the desired Strategic Outcome(s).
Program: A group of related resource inputs and activities that are managed to meet specific needs and to achieve intended results and that are treated as a budgetary unit.
Results: An external consequence attributed, in part, to an organization, policy, program or initiative. Results are not within the control of a single organization, policy, program or initiative; instead they are within the area of the organization’s influence.
Program Alignment Architecture: A structured inventory of an organization’s programs depicting the hierarchical relationship between programs and the Strategic Outcome(s) to which they contribute.
Report on Plans and Priorities: Provides information on the plans and expected performance of appropriated organizations over a three-year period. These reports are tabled in Parliament each spring.
Strategic Outcome: A long-term and enduring benefit to Canadians that is linked to the organization’s mandate, vision and core functions.
Sunset program: A time-limited program that does not have an ongoing funding and policy authority. When the program is set to expire, a decision must be made whether to continue the program. In the case of a renewal, the decision specifies the scope, funding level and duration.
Target: A measurable performance or success level that an organization, program or initiative plans to achieve within a specified time period. Targets can be either quantitative or qualitative.
Whole-of-government framework: Maps the financial contributions of federal organizations receiving appropriations by aligning their Programs to a set of 16 government-wide, high-level outcome areas, grouped under four spending areas.
List of Acronyms
- ACCBP
- Anti-Crime Capacity Building Program
- AMC
- Advance Market Commitment
- APEC
- Asia-Pacific Economic Cooperation
- APP
- Authorized Programming Process
- ASEAN
- Association of Southeast Asian Nations
- CAN-MNCH
- Canadian Network for Maternal, Newborn and Child Health
- CARICOM
- Caribbean Community
- CARTEC
- Caribbean Technical Assistance Centre
- CBS
- Canada-based Staff
- CETA
- Comprehensive Economic and Trade Agreement
- CIC
- Citizenship and Immigration Canada
- CIDA
- Canadian International Development Agency
- CRF
- Consolidated Revenue Fund
- CRP
- Corporate Risk Profile
- CTA
- Canadian Technology Accelerators
- CTCBP
- Counter-Terrorism Capacity Building Program
- DFAIT
- Foreign Affairs and International Trade Canada
- DFATD
- Foreign Affairs, Trade and Development Canada
- DPR
- Departmental Performance Report
- DRC
- Democratic Republic of the Congo
- DSP
- Departmental Security Plan
- EDC
- Export Development Canada
- EITI
- Extractive Industries Transparency Initiative
- ESDC
- Employment and Social Development Canada
- EU
- European Union
- EURATOM
- European Atomic Energy Community
- EWRC
- Emergency Watch and Response Centre
- FDI
- Foreign Direct Investment
- FIPA
- Foreign Investment Protection and Promotion Agreements
- FL
- Foreign Language
- FSD
- Foreign Service Directives
- FTA
- Free Trade Agreements
- FTZ-MP
- Foreign Trade Zones-Marketing Program
- GAVI
- Vaccine Alliance
- HDI
- Human Development Index
- HIV/AIDS
- Human Immunodeficiency Virus infection/Acquired Immunodeficiency Syndrome
- HR
- Human Resources
- IAE
- International Assistance Envelope
- IAEA
- International Atomic Energy Agency
- ICAO
- International Civil Aviation Organization
- IESE
- Business School
- IGF
- Intergovernmental Forum
- IM/IT
- Information Management/Information Technology
- LES
- Locally Engaged Staff
- LGTB
- Lesbian, Gay, Bisexual, and Transgender
- MAF
- Management Accountability Framework
- MCO
- Management and Consular Officer
- MDG
- Millennium Development Goals
- MISCA
- Mission to the Central African Republic
- MNCH
- Maternal, Newborn and Child Health
- MOPAN
- Multilateral Organisation Performance Assessment Network
- NATO
- North Atlantic Treaty Organization
- NCA
- Canada-India Nuclear Cooperation Agreement
- NJC
- National Joint Council
- OAS
- Organization of American States
- OECD
- Organization of Economic Cooperation and Development
- OGD
- Other Government Department
- OIF
- Organisation Internationale de la Francophonie
- PAA
- Program Alignment Architecture
- RCMP
- Royal Canadian Mounted Police
- ROCA
- Registration of Canadians Abroad
- RPP
- Report on Plans and Priorities
- SO
- Strategic Objective
- SRDT
- Standing Rapid Deployment Team
- SSC
- Shared Services Canada
- START
- Stabilization and Reconstruction Task Force
- SUN
- Scaling Up Nutrition
- TB
- Treasury Board
- TCS
- Trade Commissioner Services
- TISA
- Trade in Services Agreement
- TPP
- Trans-Pacific Partnership
- UN
- United Nations
- UNESCO
- UN Educational, Scientific and Cultural Organization
- UNSC
- United Nations Security Council
- WFP
- World Food Program
- WMD
- Weapon of Mass Destruction
- WTO
- World Trade Organization