Canada’s State of Trade: Trade and Investment Update – 2018
Table of Contents
- A Message from the Minister
- Executive Summary
- Global Economic and Trade Performance
- Economic and Trade Developments: Regional and Country Overview
- Canada’s Economic Performance
- Canada’s International Transactions
- Key Developments in Canadian Merchandise Trade
- Canada’s Foreign Direct Investment Performance
- Special Feature: Canada’s Services Trade Performance
PDF Version (7.1 MB)
Canada State of Trade – Message from the Minister

The Honourable François-Philippe Champagne MP
Minister of International Trade
As Canada’s Minister of International Trade, I’m delighted to present the State of Trade Report for 2018. The past year has been a record one for Canadian trade successes across the globe as we continue to expand Canada’s trade footprint to new markets and new opportunities.
From the Comprehensive Economic and Trade Agreement (CETA) between Canada and the European Union, which came into force in September 2017, to the historic signing of the 11-country Comprehensive and Progressive Trans-Pacific Partnership Agreement (CPTPP) in March of this year, Canada has led the way in making trade fair and accessible to more citizens from almost every corner of the world.
When the CPTPP is fully in force, Canada will have preferential market access via 14 trade agreements to 51 countries with nearly 1.5 billion consumers and a combined GDP of US$49.3 trillion.
Trade is in Canada’s DNA and it’s vital to our economic prosperity.
To ensure our continuing prosperity, we are diversifying our markets and pursuing a progressive trade agenda. This past year, the momentum for Canada’s trade diversification continued with the launch of negotiations for new free trade agreements with the Pacific Alliance trade bloc in October 2017 and the Mercosur member countries in March 2018.
Our government’s ongoing commitment to expanding and diversifying Canada’s trade and investment ties with countries around the world is reflected in this year’s State of Trade Report.
In 2017, Canada’s merchandise exports rose 5.7 percent to an all-time high of $546.7 billion, which was $29.2 billion above the 2016 level. With merchandise imports also rising to record levels, total merchandise trade also reached another all-time record of $1,108 billion. Canada’s exports to countries such as Japan, India, South Korea, Germany and the United Kingdom rose in 2017, as did those to China.
More trade and more investment means more economic growth and more good-paying jobs to help further strengthen Canada’s middle class.
Our government’s approach is to ensure that increased trade and investment are about a march to the top, rather than a race to the bottom, when it comes to consumer rights, environmental protection, labour standards, and the rights of government to regulate in the public interest.
Canada has led the way in advancing gender equality and women’s empowerment through our international engagement, including during our G7 Presidency this year. Our government is also playing a leading role in helping more Indigenous people, members of the LGBTQ2 community, and youth succeed in today’s economy.
This year’s State of Trade Report includes an analysis that illustrates the differentiated labour market impacts of trade agreements in Canada by gender and complements previous analysis of women-owned exporting businesses. We know that advancing gender equality and the empowerment of all women and girls is the most effective way to foster prosperity, create lasting peace, and achieve sustainable development.
All over the globe, we are making headway in securing better terms for trade and in fostering crucial progressive ambitions on gender, for workers, and for the environment. Canada’s progressive trade agenda is positioning us to accomplish this and much more in the years ahead.
The Honourable François-Philippe Champagne Minister of International Trade
Executive Summary
Ten years after the outbreak of a global financial and economic crisis, a long-delayed synchronized global recovery in manufacturing, trade and investment made an appearance in 2017. While long expected, it still exceeded expectations, as the global economy grew 3.2 percentFootnote 1 in real terms. In particular, economic growth in the eurozone, Japan, the United States and China was notably above expectations. Russia and Brazil came out of recession, with the surrounding regions benefiting from their recovery.
The advanced economies are now closing the books on the economic cycle associated with the Great Recession, with labour and investment markets once again approaching normality and the economic slack almost drained out of the system. Global financial conditions will remain accommodative in the short term, with growth picking up from 2.3 percentFootnote 2 in 2017 to 2.5 percent in 2018. In the long term, aging populations and relatively weaker productivity growth will remain key challenges.
Growth in the emerging and developing economies finally picked up after failing to grow substantially for six consecutive years, and more good news is expected in the short term. Rising commodity prices are helping commodity exporters (the majority of this group) to shore up their balances and let their private consumption recover. The IMF expects economic growth to accelerate from 4.8 percent in 2017 to 4.9 percent in 2018, and above 5 percent next year.
Rising confidence under favourable fiscal, monetary and external conditions was behind the rebound in investment, which in turn boosted global trade volumes. World merchandise trade recorded its largest increase in six years, expanding 4.7 percent. Supporting trade activity is a continuing upward push in commodity prices, backed by strengthening consumer demand. Large exporters such as Germany, Japan, the United Kingdom and the United States made key contributions to global trade growth.
The largest trade volume gains in 2017 were in imports from developing economies, which soared 7.2 percent. Developed economies’ imports also grew well at 3.1 percent. Real exports by developing economies grew 5.7 percent and 3.5 percent for developed economies. Trade recovery was broad across all regions, with emerging Asia leading the way. In nominal terms, world imports expanded 10.7 percent in 2017 after two years of declines and reached US$17.6 trillion. China recaptured its status as the world’s greatest merchandise trader, lost to the United States in 2016. World imports of commercial services also rose 6.5 percent in value in 2017, to US$5.1 trillion. The WTO expects world trade growth to level off slightly to 4.4 percent in 2018 and to moderate to 4.0 percent in 2019.
Conditions differed among the economies and regions that are key to Canadian commercial interests. The United States’ economy was slow out of the gate early in 2017, but made up the lost ground and accelerated strongly for the remainder of the year with 3.0-percent average annualized growth in the last three quarters, and 2.3 percent overall in 2017. Unemployment is close to historic lows, fiscal stimulus is in play and strong consumer spending and investment is expected to propel the economy to 2.9-percent growth in 2018.
Mexico’s economy slowed down to a 2.0-percent pace in 2017, as activity was close to recession levels in the second half of the year. Fiscal pressures and high inflation, which prevented the government and the central bank from coming to the rescue, were largely responsible. The NAFTA renegotiation process remains the gravest threat to the economy, with total investment contracting 1.0 percent in 2017 and FDI declining 0.2 percent partly due to the uncertainty. Mexico’s near-term outlook is clouded due to uncertainty emanating from the United States, but this also represents an opportunity for Canadian business and governments to forge stronger ties in various areas. The IMF expects a quick improvement in 2018 while other forecasters indicate it may take longer. Mexico is the third-highest import supplier to Canada, providing as much merchandise as Germany and Japan combined, and its products are crucial for several of Canada’s key industries: automotive, electric and electronic machinery, and mechanical machinery.
Economic growth in the eurozone pleasantly surprised, coming in at 2.3 percent—the best performance since the Great Recession. Its political risks certainly look less threatening than in 2016, and current projections call for an acceleration to 2.4-percent growth in 2018. Germany and Spain saw strong economic performances in 2017; these were likely their peak numbers this cycle, as growth is expected to moderate. The United Kingdom is projected to slow down to 1.6 percent in 2018, affected by continuing uncertainty surrounding Brexit, high inflation and strengthening currency. Canada’s historical commercial association with this region became stronger than ever with the provisional application of the Canada-European Union Comprehensive Economic and Trade Agreement (CETA). It is now in force and is replete with excellent opportunities for Canadian businesses and consumers, especially in the area of services.
Emerging Asia remained the growth champion among the world’s regions. China’s economy continued its transition from investment-based to domestically driven growth; it also pledged to tackle advanced economic issues such as pollution and anti-poverty measures, while not skipping a beat in the growth department. China’s economy expanded 6.9 percent in 2017, faster than planned, and will maintain a strong pace in the short term. Canada continues to tighten commercial ties with China, including the talks on a potential free trade agreement. India is expected to continue on its growth path that is to peak around 8 percent before sloping down gently. Throughout this region, dynamic economies are specializing as large export platforms in electrical and electronic machinery, apparel, services and other areas, and could be excellent partners for Canadian businesses and foreign affiliates.
Canada’s economy recorded excellent growth in 2017, expanding by 3.0 percent. This strongest performance in six years benefited from the cyclical recovery in manufacturing and trade that began in mid-2016 across the developed economies. Canada’s economy added nearly 340,000 new jobs in 2017, bringing the labour market close to the equilibrium and reducing unemployment from 6.9 percent to 5.8 percent at year-end. With inflation stable, the economy is now operating close to its capacity. The resource sector continues to benefit from a progressive upturn in commodity prices, and the existing federal stimulus is expected to be supplemented by additional fiscal expansion in the provinces of Ontario and Quebec. Most of 2017 growth was realized during the first two quarters of the year, when it reached the scorching pace of 4.0 percent and 4.4 percent, respectively; it returned closer to potential growth with 1.5 percent in the third and 1.7 percent in the fourth quarter. Growth performance is expected to moderate to 2.1 percent in 2018 and to 2.0 percent in 2019. The Canadian dollar spent most of the year just below the US 80¢ mark. Over the course of the year, the loonie appreciated in value against the U.S. dollar and the Japanese yen, but depreciated against the European euro and the British pound.
The consequences of the shift in commodity prices reverberated through Canada’s trade during the year. Overall export prices rose 22.7 percent in the energy sector and 4.4 percent overall; meanwhile, the price index of Canada’s imports rose only 1.1 percent. The result was a substantial improvement in Canada’s terms of trade index, which rose from 91.6 in 2016 to 94.3 in 2017. Nevertheless, this value of the index is still historically low (third-lowest in the past 11 years). These changing terms of trade sent exports of resources and resource-based goods soaring—in particular, energy products, metal ores and minerals, and metal and mineral products; meanwhile, the strengthening Canadian dollar and relative prices rolled back exports in the manufacturing sectors—particularly automotive products and consumer goods. Canada’s overall trade deficit in goods narrowed, but that was nearly offset by a greater deficit in services trade due to the expanding travel and transportation services deficit. As a result of these and other developments, Canada’s current account deficit narrowed somewhat, declining from $65.4 billion in 2016 to $63.9 billion in 2017.
The volume of exports of goods increased 1.0 percent while the volume of imports expanded 3.6 percent. Nominal values of goods exports increased by 5.4 percent, strongly supported by prices, while nominal values of goods imports increased by 4.8 percent, partly supported by prices. Exports of services rose 3.6 percent, with imports growing 4.3 percent. Exports of commercial services grew just 0.7 percent in 2017, primarily due to a contraction in exports of financial services. Commercial services have run a surplus for 15 years (starting in 2003), but after declining for several years it has now shrunk to just $0.9 billion. Trade in services with the United States was perfectly balanced, with 54.5 percent of Canada’s exports going to the United States and 54.5 percent of its imports arriving from there. Of note was the high growth of 20.3 percent in Canada’s travel exports to non-OECD destinations, which could indicate a further strengthening in education, immigration and business travel to Canada from those countries.
Detailed examination of Canada’s merchandise trade shows substantial growth in both exports (up 5.6 percent, or $29.2 billion) and imports (up 5.2 percent, or $27.8 billion). Exports reached an all-time high of $546.7 billion, and so did imports with $561.1 billion. Stronger energy export revenues (up 33.1 percent) were behind the rising exports; volumes also contributed for exports of all energy components to the United States, which was the destination for 91.1 percent of Canada’s energy exports. Notably, the four next top destinations for Canada’s energy exports were all in Asia; exports to each grew by over 50 percent, and the main energy product exported to all of these (Japan, South Korea, China and India) was coal.
The proportion of exports destined for the United States declined for the third consecutive year, reaching 76.0 percent of the total. Nevertheless, there was no increase in overall export diversification, as the share of Canadian exports for the top 10 destinations remained stable at 90.8 percent. The U.S. import share decreased 0.8 percentage point to 51.3 percent, which led to an overall increase in diversification for the top 10 destinations, as their share fell from 83.7 percent in 2016 to 83.3 percent in 2017. Exports to China, Japan and South Korea saw double-digit growth; Latvia was the highest-growing major export destination with 129.7-percent growth. Imports from China and Japan grew by double digits also.
Among notable trade developments, automotive exports declined by 4.9 percent, partly explained by the increased domestic consumption, production losses and interruptions. Exports of mechanical machinery and equipment grew 5.7 percent, mostly to the United States, and aluminum exports soared by 19.0 percent. After a long and sustained growth of at least five years, exports of pharmaceutical products stumbled in 2017, losing over a quarter of their value.
Global FDI flows declined to US$1.5 trillion in 2017, after reaching in 2015 their highest level since the global crisis. FDI inflows into developed economies decreased 27.0 percent during the year (and by one-third into North America) and accounted for 53.4 percent of the total, while inflows into developing economies rose slightly in 2017. Cross-border M&A contracted by 23 percent, mostly due to lower activity in developed countries; global greenfield FDI also declined.
FDI inflows into Canada declined by 36.4 percent in 2017, to $31.5 billion. Inflows from the United States dropped by 14.4 percent, while inflows from the rest of the world dropped by 63.0 percent. The overall reduction in investment flows was due to a combination of sharp overall declines in global FDI flows (particularly in developed countries, particularly in North America) and large ownership changes of oil sands assets from foreign to Canadian hands (divestment). Foreign inflows also decreased in management of companies and enterprises, as well as into finance and insurance and other industries, but almost doubled in manufacturing.
The stock of foreign investment in Canada rose 1.9 percent to $824.0 billion, with the proportion of that stock originating in the United States at 49.1 percent. While the manufacturing sector and the management of companies and enterprises sector were the two largest overall FDI targets in 2017, FDI stock increased considerably in finance and insurance, wholesale trade, transportation and warehousing and real estate and rental industries.
Canada’s direct investment abroad (CDIA) outflows increased for the seventh consecutive year in 2017 and nearly reached $100 billion. For the second straight year, CDIA flows increased considerably in trade and transportation, which accounted for over half of total outflows. Flows also increased in management of companies and enterprises and finance and insurance; a greater share of flows went to the United States than usual. Canada’s stock of investments abroad also rose in 2017, with the appreciation of the Canadian dollar offsetting some of the activity, and reached $1.1 trillion. Canada’s net direct investment position expanded by $22.1 billion in 2017, to the highest surplus on record ($297.1 billion).
Foreign affiliates continued to be a significant part of Canadian economy, accounting for over half of Canada’s total merchandise trade.Footnote 3 These also accounted for 17.2 percent of Canada’s corporate assets, 27.1 percent of total operating revenues, employed 1.9 million Canadians and 34.5 percent of total R&D conducted in Canada. Meanwhile, Canadian foreign affiliates abroad sold more goods and services than was generated by Canada’s conventional exports, helping their Canadian parent firms stay competitive, gain access to technology and other inputs, and concentrate on headquarters activities.
Special Feature on Canada’s Services Trade Performance
Services are becoming a more important share of Canadian exports, reaching 17.0 percent in 2017 and even more on a value-added basis, due to the high domestic content of services and to the indirect contribution of services to the value of goods exports. Yet services still account for a smaller share of Canadian exports than they do for most other advanced countries. Canada performs well in a number of services sectors that rely on skilled people and on innovation, most notably research and development, finance, professional services and education. Services are important for Canada’s international competitiveness more broadly as they are important inputs into the production process and help facilitate trade. Increasingly, they are also bundled alongside goods as part of a trend towards “servicification”, and in many cases may be the largest component of goods trade.
1. Global Economic and Trade PerformanceFootnote 1-1


Regions and Economies Overview
Infographic 1.1 Text Alternative
| Developed Economies | |||
|---|---|---|---|
| Value (US$B) | Share (%) | Growth (%) | |
| North America | 2,377 | 13.8 | 7.3 |
| Mexico | 409 | 2.4 | 9.5 |
| Canada | 421 | 2.4 | 7.8 |
| United States | 1,547 | 9.0 | 6.6 |
| Europe | 6,501 | 37.8 | 9.3 |
| Germany | 1,448 | 8.4 | 8.5 |
| France | 535 | 3.1 | 6.7 |
| United Kingdom | 445 | 2.6 | 8.6 |
| Developing Economies | |||
| Asia | 5,842 | 34.0 | 10.7 |
| Japan | 698 | 4.1 | 8.3 |
| China | 2,263 | 13.2 | 7.9 |
| India | 298 | 1.7 | 13.0 |
| South and Central America | 583 | 3.4 | 13.0 |
| Africa | 417 | 2.4 | 18.3 |
Infographic 1.2 Text Alternative
| Developed Economies | |||
|---|---|---|---|
| Value (US$B) | Share (%) | Growth (%) | |
| North America | 3,285 | 18.7 | 7.3 |
| Mexico | 432 | 2.5 | 8.7 |
| Canada | 442 | 2.5 | 7.0 |
| United States | 2,409 | 13.7 | 7.1 |
| Europe | 6,521 | 37.1 | 9.9 |
| Germany | 1,167 | 6.6 | 10.5 |
| France | 625 | 3.6 | 9.2 |
| United Kingdom | 644 | 3.7 | 1.2 |
| Developing Economies | |||
| Asia | 5,541 | 31.5 | 15.3 |
| Japan | 672 | 3.8 | 10.6 |
| China | 1,842 | 10.5 | 16.0 |
| India | 447 | 2.5 | 23.8 |
| South and Central America | 579 | 3.3 | 7.8 |
| Africa | 534 | 3.0 | 7.8 |
Infographic 1.3 Text Alternative
| Developed Economies | |||
|---|---|---|---|
| Value (US$B) | Share (%) | Growth (%) | |
| North America | 876 | 16.7 | 4.2 |
| Mexico | 27 | 0.5 | 10.1 |
| Canada | 86 | 1.6 | 5.8 |
| United States | 762 | 14.5 | 3.8 |
| Europe | 2,499 | 47.6 | 8.5 |
| Germany | 296 | 5.6 | 7.0 |
| France | 249 | 4.7 | 5.5 |
| United Kingdom | 354 | 6.7 | 4.9 |
| Developing Economies | |||
| Asia | 1,321 | 25.2 | 7.1 |
| Japan | 180 | 3.4 | 6.7 |
| China | 223 | 4.3 | 8.7 |
| India | 179 | 3.4 | 11.0 |
| South and Central America | 155 | 3.0 | 6.8 |
| Africa | - | - | - |
Infographic 1.4 Text Alternative
| Developed Economies | |||
|---|---|---|---|
| Value (US$B) | Share (%) | Growth (%) | |
| North America | 659 | 13.0 | 6.9 |
| Mexico | 37 | 0.7 | 9.9 |
| Canada | 105 | 2.1 | 6.5 |
| United States | 516 | 10.2 | 6.8 |
| Europe | 2,139 | 42.2 | 5.9 |
| Germany | 319 | 6.3 | 5.2 |
| France | 244 | 4.8 | 3.4 |
| United Kingdom | 218 | 4.3 | 4.2 |
| Developing Economies | |||
| Asia | 1,514 | 29.9 | 5.5 |
| Japan | 189 | 3.7 | 3.5 |
| China | 464 | 9.1 | 3.3 |
| India | 150 | 3.0 | 13.1 |
| South and Central America | 180 | 3.5 | 8.5 |
| Africa | - | - | - |
Infographic 1.5 Text Alternative
| Developed Economies | |||
|---|---|---|---|
| Value (US$B) | Share (%) | Growth (%) | |
| North America | 330 | 21.7 | -33.2 |
| Europe | 370 | 24.4 | -26.0 |
| Developing Economies | |||
| Asia | 459 | 30.2 | 2.5 |
| South and Central America | 143 | 9.4 | 2.9 |
| Africa | 49 | 3.2 | -2.0 |
The Great Recession struck almost a decade ago, but until 2016 the recovery from it was delayed, incomplete and desynchronized. In the second half of 2016 a widespread cyclical pickup of multiple indicators finally began, and by 2017 developed into a global recovery in manufacturing, trade and investment across the world. Economic growth in the last year exceeded most expectations. Business and consumer confidence, strong investment and generally favourable financial, fiscal and monetary conditions have mutually reinforced each other and built a great deal of momentum that will not be easy to quench. Global trade has been buoyed as a result, rebounding in both volume and values on the scale of the early post-recession years (2010-2011). Commodity prices have continued pushing upward from the lows of early 2016, now more firmly based on higher consumer demand, strengthening the balances of commodity exporters in the process. If the pace of expansion could be kept up for a few more years, the world would have a Great Recovery to match the Great Recession.
Alas, the prospects of that are slim. The above-trend growth is rapidly drawing the post-recession slack out of the system. The strings of the labour markets are being pulled ever more firmly across the developed world, the central banks are tightening warily, listening to the first signs of the incipient inflation pressures, and the business pundits across the world are back to forecasting the date of the next recession. Sometime in 2018, the excess growth in most developed countries is expected to begin moderating and start approaching potential growth numbers – which haven’t grown any prettier while the world dealt with the legacy of the Great Recession.
While commodity prices have continued pushing upward due to higher consumer demand, growth in most developed countries is expected to moderate
Demographics dictate bland performances under 2 percent, and it is to the Sphinx of technology that we look to break the deadlock, but its promises are as ambiguous as its riddles. Yet if the upside potential failed to increase, the downside risks have certainly swelled. Never has the rules-based trading system been under such strain as in 2017, and things are expected to get worse in 2018 before they can get better. Geopolitical tensions and tighter hold on power by the world’s many autocratic regimes point in the same direction, and it may be some time before the setting sun of the economic growth of 2017 across the world is approached in brilliance once again.
Following the upswing that began in the previous year, the world economy grew 3.2 percent in real terms during 2017 (aggregate on the basis of market exchange rates).Footnote 1-2 This was a major acceleration from the 2.5-percent growth in 2016 and the fastest that the world economy has expanded since 2010. In many areas, economic performance during 2017 exceeded expectations – in particular the eurozone, Japan, the United States and China. The two key drivers of the strengthening in global growth during the year were the recovery in investment spending in advanced economies and the end of investment contraction in commodity-exporting economies. Strong momentum, market and investor confidence, favourable financial conditions and a partial recovery in commodity prices fuel the expectations of an even stronger growth in the short term.
The world economy grew 3.2 percent with two key drivers of global growth being the recovery in investment spending in advanced economies and the end of investment contraction in commodity-exporting economies
Figure 1-1
Real GDP Growth in Major Economies, 2012-17

Source: Statistics Canada, Table 380-0064
Figure 1-1 Text Alternative
| Country | 2012 | 2013 | 2014 | 2015 | 2016 | 2017 |
|---|---|---|---|---|---|---|
| Brazil | 1.93 | 3.01 | 0.51 | -3.55 | -3.47 | 0.98 |
| Canada | 1.75 | 2.48 | 2.86 | 1.00 | 1.41 | 3.00 |
| China | 7.90 | 7.80 | 7.30 | 6.90 | 6.72 | 6.86 |
| Germany | 0.69 | 0.60 | 1.93 | 1.50 | 1.86 | 2.51 |
| India | 5.46 | 6.39 | 7.41 | 8.16 | 7.11 | 6.74 |
| Japan | 1.50 | 2.00 | 0.38 | 1.35 | 0.94 | 1.71 |
| France | 0.18 | 0.58 | 0.95 | 1.07 | 1.19 | 1.85 |
| United States | 2.22 | 1.68 | 2.57 | 2.86 | 1.49 | 2.27 |
| World | 3.52 | 3.47 | 3.58 | 3.45 | 3.23 | 3.76 |
Preliminary estimates indicate that global foreign direct investment (FDI) inflowsFootnote 1-3 decreased considerably in 2017, after reaching in 2015 their highest level since the start of the global crisis. FDI inflows targeting developed economies fell by over a quarter, with inflows into North America dropping by one-third. FDI inflows to developing economies increased marginally. Cross-border mergers and acquisitions (M&A) contracted, mostly due to lower activity in developed countries; global greenfield FDI also declined.
Overview and Prospects for the Global Economy
Aggregate Growth Trends
In purchasing-power parity (PPP)-adjusted terms, world growth accelerated to 3.8 percent in 2017, which was 0.5 percentage point faster than in the previous year. Growth in the advanced economies accelerated by 0.6 percentage point relative to 2016 to reach 2.3 percent, and the increase was due almost entirely to investment spending. This process was braced by generally accommodative monetary policy, stronger balance sheets and improved confidence. Strengthening investment brought about a strong recovery in global trade with large exporters such as Germany, Japan, the United Kingdom and the United States contributing significantly to it.
Most of the advanced economies were characterized by still-low core inflation, but edging up due to rising demand. The United Kingdom, where core inflation is still above the Bank of England’s target, is the single exception. Continued weakness in real wage growth across these economies points to some slack remaining in the labour markets, although there are signs of labour market firming in the United States. The cycle of monetary tightening is under way in most advanced economies, though overall it is still in a broadly stimulative mode. Output gaps are now closing faster than expected, and the economic growth is lining up with the estimated potential growth. The U.S. dollar has weakened modestly in real effective terms in the second half of 2017, and the euro has strengthened, while the Japanese yen remained broadly stable.
Figure 1-2
PPP-Adjusted Growth by Major Regions,
2014-2017 and Forecast 2018-2019

Source: Statistics Canada, Table 380-0064
Figure 1-2 Text Alternative
| Year | World | Advanced | Developing economies |
|---|---|---|---|
| 2014 | 3.58 | 2.09 | 4.70 |
| 2015 | 3.45 | 2.30 | 4.30 |
| 2016 | 3.23 | 1.67 | 4.36 |
| 2017 | 3.76 | 2.34 | 4.76 |
| 2018 | 3.94 | 2.48 | 4.94 |
| 2019 | 3.94 | 2.22 | 5.10 |
| Regions (PPP aggregates) | 2017 | 2018 | 2019 |
|---|---|---|---|
| World | 3.8 | 3.9 | 3.9 |
| Advanced Economies | 2.3 | 2.5 | 2.2 |
| Eurozone | 2.3 | 2.4 | 2.0 |
| Developing Economies | 4.8 | 4.9 | 5.1 |
| Developing Asia | 6.5 | 6.5 | 6.6 |
| Emerging Europe | 5.8 | 4.3 | 3.7 |
| CIS | 2.1 | 2.2 | 2.1 |
| Latin America and Caribbean | 1.3 | 2.0 | 2.8 |
| Middle East and North Africa | 2.6 | 3.4 | 3.7 |
| Sub-Saharan Africa | 2.8 | 3.4 | 3.7 |
| Countries (market-based aggregates) | 2017 | 2018 | 2019 |
|---|---|---|---|
| World | 3.2 | 3.4 | 3.3 |
| Canada | 3.0 | 2.1 | 2.0 |
| United States | 2.3 | 2.9 | 2.7 |
| United Kingdom | 1.8 | 1.6 | 1.5 |
| Japan | 1.7 | 1.2 | 0.9 |
| France | 1.8 | 2.1 | 2.0 |
| Germany | 2.5 | 2.5 | 2.0 |
| Italy | 1.5 | 1.5 | 1.1 |
| Spain | 3.1 | 2.8 | 2.2 |
| China | 6.9 | 6.6 | 6.4 |
| India | 6.7 | 7.4 | 7.8 |
| Russia | 1.5 | 1.7 | 1.5 |
| Brazil | 1.0 | 2.3 | 2.5 |
| Mexico | 2.0 | 2.3 | 3.0 |
| Nigeria | 0.8 | 2.1 | 1.9 |
| South Africa | 1.3 | 1.5 | 1.7 |
Source: WTO Press Release, April 2018
Growth in the emerging and developing economies finally picked up after failing to grow substantially for six consecutive years, up 0.4 percentage point to 4.8 percent. As usual, performance was more uneven among this group, and the composition of growth varied greatly. Strong growth in emerging Asia continued, with China and India drawing strength from net exports and strong private consumption, while cutting back their investment growth. Among the rest of the group, on the contrary (particularly among the commodity-exporting countries), the investment effects were the main positive contributors. Fixed investment stopped contracting in Brazil and Russia as well as several commodity exporters. Growth in inventory investment was also an important growth factor, while a recovery in imports among commodity exporters helped private consumption recover, but also made net exports the largest drag on economic growth in the emerging and developing economies. Currencies were mostly stable or increasing against the U.S. dollar, helping to keep the core inflation low in Brazil, Russia and China. On the other hand, core inflation has risen in India and remained high in the Middle East and Africa. Financial conditions remained generally supportive, with monetary policy easing further in Brazil and Russia and equity markets generally strengthening.
Economic Growth and Outlook: Major Countries
The United States’ economy grew 2.3 percent in 2017, rebounding from the sub-par 1.5-percent growth of 2016, its weakest economic performance since 2009. Private consumption, non-residential fixed investment, and exports made significant positive contributions to the increase in real GDP in 2017. The acceleration in real GDP from 2016 to 2017 reflected upturns in nonresidential fixed investment and in exports and a smaller decrease in private inventory investment. These movements were partly offset by decelerations in residential fixed investment and in state and local government spending. Imports, which are a subtraction in the calculation of GDP, accelerated.
Given that performance, growth forecasts for the United States have been revised upward. Higher projected external demand and the boost from recent fiscal policy stimulus are also positive factors. The IMF expects the U.S. economy to generate 2.9-percent growth in 2018 and 2.7-percent growth in 2019. Fiscal policy changes are expected to generate short-term growth gains until 2020, after which their effects will turn negative due to increasing fiscal deficit. This expected U.S. strength in the short term is welcome news for the Canadian economy.
The IMF expects the U.S. economy to generate 2.9-percent growth in 2018 and 2.7-percent growth in 2019 due to short-term growth generated by U.S. fiscal stimulus
Growth surprised on the positive side throughout the eurozone in 2017 and led to a considerable upside revision of the short-term IMF forecast as well. Germany has improved to 2.5-percent growth from 1.9 percent in 2016. France grew at 1.8 percent (up from 1.2 percent in 2016). The United Kingdom was the exception with a slight dip in growth to 1.8 percent in 2017, but even that is welcome news, given some of the Brexit expectations. The eurozone as a whole recorded a solid 2.3-percent growth in 2017, and that is expected to strengthen to 2.4 percent in 2018 before moderating to 2.0 percent in 2019. In Germany, growth should remain stable at 2.5 percent in 2018 and decelerate to 2.0 percent in 2019. France’s growth is expected to accelerate to 2.1 percent in 2018 before a slight slowdown to 2.0 percent in 2019. The United Kingdom is expected to continue slowing down in the short-term, to 1.6 percent in 2018 and to 1.5 percent in 2019, as business investment remains low due to uncertainty about the Brexit process and its results.
Japan also performed better than expected in 2017 and will continue to do so in the short run. Growth was 1.7 percent in 2017, surprising many observers. Expected to moderate to 1.2 percent in 2018 and to 0.9 percent in 2019, growth nevertheless remains above potential, which is weak due to unfavourable demographics leading to a declining labour force. Japan’s short-term strength is occasioned by better external demand prospects, a rebound in private investment and increased fiscal stimulus.
Many other advanced economies have reached a peak performance in 2017 (or, like New Zealand and Spain, in 2016) and are expected to slow down in the short term. That list includes Canada, Hong Kong, Ireland, Singapore, South Korea and Taiwan. Nevertheless, their growth numbers will remain respectable and in most cases above the long-term trend. In all of the Newly Industrialized Economies (NIEs) of Asia, growth in 2018 will slow down: in Hong Kong from 3.8 percent to 3.6 percent, in Taiwan from 2.8 percent to 1.9 percent, in Singapore from 3.6 percent to 2.9 percent, and in South Korea from 3.1 percent to 3.0 percent. The latter is expected to continue performing above trend in spite of international tensions over the Korean peninsula.
Among the developing economies, China continued to perform strongly with 6.9-percent growth in 2017 and is projected to slow down slightly: to 6.6 percent in 2018 and to 6.4 percent in 2019. Stronger external demand supported a slight upward revision of the forecast. Continued rebalancing from investment to consumption will bring the growth down to about 5.5 percent over the medium term, as policy support from credit growth and government policies is reduced and the social safety measures are strengthened. India’s growth of 6.7 percent in 2017 was below expectations due to implications of its currency exchange initiative, but a rebound to 7.4 percent is projected for 2018, rising to 7.8 percent by 2019. Private consumption growth is strong, and efficiency-improving reforms are under way. Broadly stable and strong growth of 5.3 percent was recorded in the ASEAN-5 economies; more of the same is expected for the region as the IMF forecast calls for 5.3-percent growth in 2018 and 5.4 percent in 2019.
Mexico has outperformed expectations with 2.0-percent expansion in 2017, and prospects are for further improvement. A more robust 2.3-percent GDP growth is expected in 2018, then rising to 3.0 percent in 2019 as the country benefits from the acceleration of the U.S. economy. The completion of a structural economic reform agenda is expected to maintain 3.0-percent growth in Mexico over the medium term. Brazil has emerged from a major recession to return to growth in 2017 at 1.0 percent. It is expected to continue accelerating up to 2.3 percent in 2018 and 2.5 percent in 2019 as private consumption and investment return to normal.
Argentina’s GDP grew 2.9 percent, but is projected to dip next year due to tighter fiscal and monetary policies, exacerbated by a drought affecting the country’s substantial agricultural sector
Activity in Argentina came in at 2.9 percent in 2017, but is projected to dip to 2.0 percent in 2018 as the effects of fiscal and monetary adjustments needed to curb inflation and reform public finances will be exacerbated by a drought that will affect the country’s substantial agricultural sector. Russia exited its recession with 1.5-percent growth in 2017, supported by stronger oil prices and looser monetary policy, and will grow at 1.7 percent in 2018, before headwinds and tightening sanctions depress economic activity to 1.5 percent over the medium term. Both Poland and Turkey are projected to grow above potential in 2018, at 4.1 percent and 4.4 percent respectively, before moderating to long-term potential in the medium term. Nigeria returned to positive growth, and growth is expected to be 2.1 percent in 2018 and 1.9 percent in 2019, while South Africa is also headed to improve its 1.3-percent growth of 2017 to 1.5 percent in 2018 and 1.7 percent in 2019.
The balance of the risks to the outlook has improved relative to the previous year due to solid gains and considerable momentum; risks are now two-sided and roughly balanced. There is a potential for positive surprises: strong confidence can boost investment and hiring plans, and labour markets may have greater slack than estimated, leading to a general increase in economic activity. Increases in investment could lead to a boost to productivity and unlock a pathway to higher potential growth in the future. At the same time, the downside risks include: uncertainty of the current geopolitical environment, risks of disruptions to global trade, financial vulnerabilities, political discord and climatic catastrophes.
Economic Growth and Outlook: Major Aggregates
Global GDP growth was recorded at 3.8 percent in 2017 (PPP-adjusted), soaring above 4 percent toward the end of the year, with strong support from investment activity. Improved performance for world growth is expected next year as financial conditions still remain supportive. According to the IMF, PPP-adjusted growth will rise to 3.9 percent for 2018 and 2019 (or, if calculated with market-based exchange rates, to 3.4 percent and 3.3 percent, respectively). The IMF forecasts improved performance in the short-term both from advanced economies, at 2.5 percent for 2018 and 2.2 percent for 2019, as well as from developing economies to 4.9 percent in 2018 and 5.1 percent in 2019. This growth is projected to soften in the medium term, as output gaps close and advanced economies return to their lacklustre potential output paths.
The advanced economies have been in a continued recovery mode ever since the Great Recession, which is now drawing to a definite close. Growth is peaking above potential to end the cycle, as normality is restored in labour and investment markets. Faster-than-expected closing of the output gaps and the upward revisions to the estimated potential growth account for the current growth spike. Beyond the short term, growth rates are expected to dip below pre-recession levels as the aging populations and shrinking labour forces in the advanced economies will act as a drag on expansion. Fiscal policy is expected to remain expansionary in 2018 and 2019, but turn mildly contractionary by 2020 and more so by 2023 when the front-loaded investment provisions of U.S. tax reform begin to expire. Monetary policy will remain very supportive in the eurozone and Japan, but will tighten faster than projected in the United States. Global financial conditions will continue to remain generally accommodative.
While the advanced economies have continued to recover ever since the Great Recession, growth rates are expected to dip below pre-recession levels as the populations age and the labour forces shrink
The emerging and developing economies have not seen an improvement in growth since 2010, but that came to an end last year as they expanded 4.8 percent, up from 4.4 percent in 2016. Growth continued to be strong in emerging and developing Asia and accelerated substantially in emerging Europe. Latin America and the Caribbean region left negative growth behind them, and sub-Saharan Africa accelerated as well; the only exception to the improvement trend was in the Middle East and North African (MENA) countries, whose growth in 2017 was just over half of the previous year’s pace. Commodity exporters had a better year after three years of weakness as commodity prices recovered substantially, owing to a general improvement in activity. The IMF commodity price index is expected to rise 11.9 percent in 2018 and then decrease about 3.7 percent in 2019. Beyond the short term, growth in emerging and developing economies is projected to stabilize at about 5 percent.
Emerging and developing Asia will remain the key engine of global growth, growing steadily at a 6.5-percent pace in 2018 and accelerating to 6.6 percent in 2019. Emerging Europe will slow down from its high current rates to 4.3 percent in 2018 and to 3.7 percent in 2019 as strong demand for exports from its eurozone neighbours and favourable financial conditions support activity. Recovery in commodity prices will be very welcome to Latin American and Caribbean economies and should propel them to growth of 2.0 percent in 2018 and 2.8 percent in 2019. MENA countries will also pick up their pace – to 3.4 percent in 2018 and 3.7 percent in 2019, with support from higher oil prices crucial to their prospects. Growth in sub-Saharan Africa is also projected to increase to 3.4 percent in 2018 and 3.7 percent in 2019, with commodity prices key to the growth.
Overview and Prospects for World Trade
World merchandise trade recorded its largest increase in six years as it expanded 4.7 percent in 2017 in real terms. This trade expansion follows on the heels of a very weak 1.8-percent growth in 2016, when trade growth lagged behind the growth in real world output. According to the WTO, this large acceleration in trade growth was due to stronger than expected economic growth across the globe, with strong investment Footnote 1-4 numbers, private consumption and supportive fiscal as well as financial conditions. The renewed strength of world trade volumes should persist in the short term, with its pace cooling off slightly to 4.4 percent by 2018 and to 4.0 percent in 2019.
World merchandise trade recorded its largest increase in six years as it expanded 4.7 percent; the strength of world trade volumes should persist in the short term and cool off in the medium term
At the same time, there are grave risks to this forecast as the heightened trade tensions and uncertainty about the major economies’ commitment to existing rules-based architecture begin to threaten business confidence, affect investment decisions and undermine the robustness of current global economic growth. This outlook is thus dependent on the governments continuing to manage global trade through collective action and employing appropriate trade, monetary and fiscal policies.
The largest trade volume gains in 2017 were recorded on the import side in developing economies; real import growth soared to 7.2 percent after a tepid 1.9-percent performance in 2016. Meanwhile, developed economies’ real imports grew a less spectacular 3.1 percent in 2017 after recording 2.0-percent growth the year before. Real merchandise exports grew 5.7 percent in developing economies in 2017 and 3.5 percent in developed economies, several percentage points above their 2016 performance. The dynamics of growth were also different: while the developing economies achieved higher overall import growth, it was the developed economies that had more momentum at the end of the year, as higher economic growth in these countries took hold.
The recovery in export trade volumes was broad across the world’s regions as exports from North America, South and Central America and the Caribbean (SCAC), Europe and Asia all grew faster
The recovery in export trade volumes was broad across the world’s regions in 2017. Exports from North America, South and Central America and the Caribbean (SCAC), Europe and Asia all grew faster than in 2016. Asia was the leader with 6.7-percent exports growth, followed by North America at 4.2 percent. Europe’s exports also picked up considerably, from 1.1 percent in 2016 to 3.5 percent in 2017. On the import side, Asia also led with 9.6-percent volume growth, with North America and SCAC both posting a substantial 4.0-percent growth – the former after a near-zero growth in 2016, the latter on the heels of a 6.8-percent contraction in real imports in the same year.
Nominal world imports measured in U.S. dollars expanded 10.7 percent in 2017 after two years of declines, reaching US$17.6 trillion. The stability of the U.S. dollar versus a broad basket of currencies, in spite of the commodity price increases, contributed to this increase. China has once again become the greatest merchandise trading nation, recording US$4.1 trillion in total trade and passing the United States with US$4.0 trillion. Europe remained the greatest trading continent with US$13.0 trillion in total trade, ahead of Asia with US$11.4 trillion. World imports of commercial services also increased in value considerably in 2017 (volume statistics for services are not available), up 6.5 percent to US$5.1 trillion.
The WTO forecast is for a gradual moderation in merchandise trade growth in 2018 and 2019, but projects a strong performance in the short term. Optimism is supported by the recent strength in leading trade indicators such as the container port throughput index and global export orders. On the other hand, the continually swelling tide of anti-trade sentiment and trade-restricting measures carries significant risks to the outlook. If the current GDP growth forecasts are realized, trade volumes will expand by 4.4 percent in 2018; developing economies will see import growth of 4.8 percent and export growth of 5.4 percent, while developed economies will expand their imports by 4.1 percent and their exports by 3.8 percent. A slowdown to 4.0 percent in global trade volume growth in 2019 will affect these estimates roughly in proportion.
Merchandise Exports
In nominal terms, the CIS (Commonwealth of Independent States) was the surprising world leader in exports growth in 2017 among the world’s regions, recording a 24.4-percent increase from the previous year. This was partly due to higher energy prices, which buoyed a large proportion of the region’s exports, and partly to lower trade levels of 2016 due to a recession in Russia (whose exports expanded by over a quarter in 2017). Commodity price increases also occasioned a strong growth in value of Africa’s exports, which were up 18.3 percent, and those from the Middle East, up 18.0 percent. The SCAC region also benefited from higher commodity prices with 13.0-percent growth as well as from the end of a recession in Brazil (whose exports expanded by 17.5 percent in 2017). Asia’s nominal exports grew 10.7 percent, with India leading the ranks at 13.0-percent growth and NIEs not far behind with a combined 12.6-percent growth performance. Exports from Europe expanded to 9.3 percent with a strong performance from Italy (up 9.6 percent), the United Kingdom (up 8.6 percent) and Germany (up 8.5 percent). North America’s exports grew at the slowest pace among the world’s regions (up 7.3 percent) with Mexico in the lead at 9.5 percent. Europe remained the globe’s greatest exporter with a 37.8-percent share, followed by Asia with 34.0 percent and the other regions far behind.
| Value US$B | Share (%) | Growth (%) | |
|---|---|---|---|
| US$B | (%) | (%) | |
| World | 17,198 | 100.0 | 10.7 |
| North America | 2,377 | 13.8 | 7.3 |
| United States | 1,547 | 9.0 | 6.6 |
| Canada | 421 | 2.4 | 7.8 |
| Mexico | 409 | 2.4 | 9.5 |
| South & Central America | 583 | 3.4 | 13.0 |
| Brazil | 218 | 1.3 | 17.5 |
| Europe | 6,501 | 37.8 | 9.3 |
| EU-28 | 5,904 | 34.3 | 9.7 |
| Germany | 1,448 | 8.4 | 8.5 |
| France | 535 | 3.1 | 6.7 |
| United Kingdom | 445 | 2.6 | 8.6 |
| Italy | 506 | 2.9 | 9.6 |
| CIS | 518 | 3.0 | 24.4 |
| Russia | 353 | 2.1 | 25.3 |
| Africa | 417 | 2.4 | 18.3 |
| Middle East | 961 | 5.6 | 18.0 |
| Asia | 5,842 | 34.0 | 10.7 |
| China | 2,263 | 13.2 | 7.9 |
| Japan | 698 | 4.1 | 8.3 |
| India | 298 | 1.7 | 13.0 |
| NIEs | 1,283 | 7.5 | 12.6 |
Source: WTO Press Release, April 2018
Merchandise Imports
In nominal terms, world merchandise imports also rose 10.7 percent on the year to reach US$17.6 trillion. Import values were up across the globe, but the CIS again was the fastest-growing region, with 20.8-percent increase in import value. This was mainly due to Russia coming out of the recession and the greater value of its energy-intensive exports (Russia’s imports were up 24.1 percent in 2017). Asia also recorded a big jump in its imports, which expanded 15.3 percent. India was the leader again with a 23.8-percent import increase, followed by China with 16.0 percent.
Nominal import growth in most other regions was clustered just short of 10 percent: Europe was third with 9.9 percent, Africa and SCAC regions next at 7.8 percent and North America at 7.3 percent (with Mexico again in the lead with 8.7-percent growth). Imports were stagnant in the Middle East, which was last among the regions with a tepid 1.1-percent growth performance.
| Value US$B | Share (%) | Growth (%) | |
|---|---|---|---|
| World | 17,572 | 100.0 | 10.7 |
| North America | 3,285 | 18.7 | 7.3 |
| United States | 2,409 | 13.7 | 7.1 |
| Canada | 442 | 2.5 | 7.0 |
| Mexico | 432 | 2.5 | 8.7 |
| South & Central America | 579 | 3.3 | 7.8 |
| Brazil | 157 | 0.9 | 9.7 |
| Europe | 6,521 | 37.1 | 9.9 |
| EU-28 | 5,878 | 33.5 | 10.0 |
| Germany | 1,167 | 6.6 | 10.5 |
| France | 625 | 3.6 | 9.2 |
| United Kingdom | 644 | 3.7 | 1.2 |
| Italy | 453 | 2.6 | 11.2 |
| CIS | 402 | 2.3 | 20.8 |
| Russia | 238 | 1.4 | 24.1 |
| Africa | 534 | 3.0 | 7.8 |
| Middle East | 712 | 4.1 | 1.1 |
| Asia | 5,541 | 31.5 | 15.3 |
| China | 1,842 | 10.5 | 16.0 |
| Japan | 672 | 3.8 | 10.6 |
| India | 447 | 2.5 | 23.8 |
| NIEs | 1,203 | 6.8 | 13.7 |
Source: WTO Press Release, April 2018
Among the large economies, import expansions in Italy (up 11.2 percent), Germany (up 10.5 percent) Brazil (up 9.7 percent) and France (up 9.2 percent) are worth noting, as is the United Kingdom’s weak import growth of just 1.2 percent, mainly occasioned by the depreciation of its currency.
Europe remained the world’s leading importer, at 37.1 percent of the global trade, while Asia’s imports accounted for 31.5 percent of the total; together these two regions import well over two-thirds of the world’s merchandise. North America’s share was 18.7 percent, while all other regions together accounted for less than 13 percent of global imports.
Services Exports
After two years of languishing, nominal world services exports measured in U.S. dollars grew strongly in 2017, rising 7.4 percent to reach US$5.3 trillion. Transport services grew the fastest at 8.3 percent, and travel services were up 7.2 percent, while goods-related services Footnote 1-5 registered the slowest growth of all categories as their value increased 5.2 percent. The latter category was the best performer in the years 2015 and 2016.
On a regional basis, “other regions” (which includes Africa, the CIS and the Middle East) performed the best, recording 9.8-percent growth in service exports. Growth was particularly remarkable in Egypt (up 38.2 percent) and Russia (up 15.9 percent). Europe recorded the next-highest increase with 8.5-percent aggregate growth, reaching a US$2.5-trillion total. The Netherlands led this region with a 15.6-percent expansion while growth was slow in the United Kingdom at 4.9 percent. Asia was third-fastest in service exports growth, up 7.1 percent; India was in the lead again with 11.0-percent growth and China ahead of the average at 8.7 percent, while the NIEs recorded only a 2.1-percent increase.
Exports of services from SCAC countries were 6.8-percent higher than in 2016; Brazil’s expansion was only half as fast at 3.4 percent. North America registered the smallest increase of all regions, up 4.2 percent, with Mexico showing the largest growth at 10.1 percent and the United States the smallest at 3.8 percent. Canada’s services exports increased by 5.8 percent. Footnote 1-6
Europe continued to be the world’s leading provider of services, accounting for 47.6 percent of global value of exports, due largely to intra-EU trade in services. Asia ranked second, with just over a quarter of the global exports (US$1.3 trillion), while North America was third, with US$0.9 trillion – accounting for 16.7 percent of the global services exports in 2017.
| Value US$B | Share (%) | Growth (%) | |
|---|---|---|---|
| World | 5,252 | 100.0 | 7.4 |
| North America | 876 | 16.7 | 4.2 |
| United States | 762 | 14.5 | 3.8 |
| Canada | 86 | 1.6 | 5.8 |
| Mexico | 27 | 0.5 | 10.1 |
| South & Central America | 155 | 3.0 | 6.8 |
| Brazil | 34 | 0.6 | 3.4 |
| Europe | 2,499 | 47.6 | 8.5 |
| EU-28 | 2,226 | 42.4 | 8.5 |
| Germany | 296 | 5.6 | 7.0 |
| United Kingdom | 354 | 6.7 | 4.9 |
| France | 249 | 4.7 | 5.5 |
| Netherlands | 216 | 4.1 | 15.6 |
| Asia | 1,321 | 25.2 | 7.1 |
| China | 226 | 4.3 | 8.7 |
| Japan | 180 | 3.4 | 6.7 |
| India | 179 | 3.4 | 11.0 |
| NIEs | 400 | 7.6 | 2.1 |
| Other Regions | 401 | 7.6 | 9.8 |
| Russia | 58 | 1.1 | 15.9 |
| Egypt | 19 | 0.4 | 38.2 |
| South Africa | 15 | 0.3 | 9.3 |
| United Arab Emirates | 70 | 1.3 | 7.5 |
Source: Statistics Canada, Table 380-0064
Services Imports
The total value of world services imports rose 6.5 percent to US$5.1 trillion in 2017. “Other regions” was the bestperforming import region; services imports expanded 10.3 percent, led by Russia’s increase of 18.8 percent despite some countries, like Egypt and the UAE, posting marginal growth rates. SCAC was the next-highest region of import growth with a combined increase of 8.5 percent. Brazil performed just below this average with 7.9-percent growth.
North America recorded next-highest import growth at 6.9 percent: Mexico led with 9.9-percent growth, followed by the United States at 6.8 percent, while Canada’s imports of services increased 6.5 percent. Footnote 1-7
Uncharacteristically, Europe and Asia found themselves at the back of the rankings with growth of 5.9 percent and 5.5 percent, respectively. The Netherlands led Europe with 14.7-percent growth, but the performances of France and the United Kingdom were weaker than the average. Among the large Asian countries, India’s performance of 13.1-percent services import growth was exceptional; the NIEs grew at the average pace of 5.5 percent, while China’s 3.3-percent growth fell far short of the average for the region.
Europe remained the largest importer of services, with 42.2 percent of the world’s imports in 2017, followed by Asia with 29.9 percent. North America’s import share equalled 13.0 percent, while Africa, the Middle East and the CIS combined equalled 11.4 percent of the total, significantly expanding their share.
| Value US$B | Share (%) | Growth (%) | |
|---|---|---|---|
| World | 5,072 | 100.0 | 6.5 |
| North America | 659 | 13.0 | 6.9 |
| United States | 516 | 10.2 | 6.8 |
| Canada | 105 | 2.1 | 6.5 |
| Mexico | 37 | 0.7 | 9.9 |
| South & Central America | 180 | 3.5 | 8.5 |
| Brazil | 66 | 1.3 | 7.9 |
| Europe | 2,139 | 42.2 | 5.9 |
| EU-28 | 1,915 | 37.8 | 5.4 |
| Germany | 319 | 6.3 | 5.2 |
| United Kingdom | 218 | 4.3 | 4.2 |
| France | 244 | 4.8 | 3.4 |
| Netherlands | 211 | 4.2 | 14.7 |
| Asia | 1,514 | 29.9 | 5.5 |
| China | 464 | 9.1 | 3.3 |
| Japan | 189 | 3.7 | 3.5 |
| India | 150 | 3.0 | 13.1 |
| NIEs | 421 | 8.3 | 5.5 |
| Other Regions | 580 | 11.4 | 10.3 |
| Russia | 87 | 1.7 | 18.8 |
| Egypt | 16 | 0.3 | 1.3 |
| South Africa | 16 | 0.3 | 7.5 |
| United Arab Emirates | 84 | 1.7 | 1.9 |
Source: WTO Press Release, April 2018
Overview of Global Foreign Direct Investment Flows
According to preliminary estimates from the United Nations Conference on Trade and Development (UNCTAD), global FDI inflows decreased by 16.3 percent in 2017 to US$1.5 trillion. This was well below their peak of US$1.9 trillion in 2007.
FDI inflows to developed economies fell 27.0 percent to an estimated US$810 billion in 2017, accounting for a 53.4-percent share of world FDI inflows. North American inflows declined by 33.2 percent to US$330 billion. This was partly caused by the decline in cross-border M&A between Canada and the United States. Inflows into the United States decreased in 2017, yet the country remained the world’s largest recipient of inflows for the third year in a row with an estimated US$311 billion. Within the EU countries, inflows declined by 26.0 percent, accounting for just below one-quarter of global inflows. A significant portion of this decline can be attributed to lower FDI inflows into the United Kingdom, which experienced a 90-percent drop in 2017. Inward flows to Belgium, Spain and the Netherlands also fell. Germany was the highlight of developed economy inflows, which more than tripled in value (from US$10 billion to an estimated US$35 billion), and France experienced a significant increase in FDI flows, mainly due to a number of high value M&A deals.
| 2016 (US$B) | 2017 (US$B) | Growth (%) | Share (%) | |
|---|---|---|---|---|
| World | 1,814 | 1,518 | -16 | 100.0 |
| Developed Economies | 1,109 | 810 | -27 | 53.4 |
| EU | 500 | 370 | -26 | 24.4 |
| North America | 494 | 330 | -33 | 21.7 |
| Developing Economies | 638 | 653 | 2 | 43.0 |
| Africa | 50 | 49 | -1 | 3.2 |
| Latin America & Caribbean | 139 | 143 | 3 | 9.4 |
| Developing Asia | 448 | 459 | 2 | 30.2 |
| Transition Economies] | 67 | 55 | -17 | 3.6 |
Source: UNCTAD, Investment Trends Monitor, April 2018
FDI inflows to developing economies grew 2.4 percent, to US$653 billion in 2017, accounting for 43.0 percent of global inflows. In Latin America and the Caribbean, flows increased by 2.9 percent to US$143 billion. Inflows to Africa registered a marginal decline of 2.0 percent to US$49 billion. In developing Asia, FDI inflows grew 2.5 percent to US$459 billion. Mainland China and Hong Kong were the second- and third-largest recipients of FDI, at US$144 billion and US$85 billion, respectively.
FDI inflows to transition economies decreased sharply in 2017, falling 17.9 percent from US$67 billion to US$55 billion. This was largely driven by a drop for the Russian Federation and lower inflows across most of the Commonwealth of Independent States (CIS).
Cross-border M&A contracted by 23 percent to US$666 billion in 2017. The decline was driven by a decrease of 30 percent (to US$553 billion) in developed economies, while in developing economies the value of cross-border M&A increased by 44 percent (to US$100 billion). Worldwide greenfield FDI also decreased significantly, to US$571 billion.
Figure 1-3
Top Performing Trade Regions: Europe VS. Asia, 2017 (Estimated)

Figure 1.3 Text Alternative
| Europe | Asia | |
|---|---|---|
| Export Volume, Growth (%) | 3.5 | 6.7 |
| Import Volume, Growth (%) | 2.5 | 9.6 |
| Nominal Total Merchandise Trade (US$ Trillion) | 13.0 | 11.4 |
| Nominal Merchandise Exports (US$ Trillion) | 6.5 (+9.3% growth) | 5.8 (+10.7% growth) |
| Nominal Merchandise Imports (US$ Trillion) | 6.5 (+9.9% growth) | 5.5 (+15.3% growth) |
| Nominal Total Service Trade (US$ Trillion) | 4.6 | 2.8 |
| Nominal Service Exports (US$ Trillion) | 2.5 (+8.5% growth) | 1.3 (+7.1% growth) |
| Nominal Service Imports (US$ Trillion) | 2.1 (+5.9% growth) | 1.5 (+5.5% growth) |
2. Economic and Trade Developments: Regional and Country Overview


Infographic 2.1 Text Alternative
| Population (M) | GDP per Capita (US$) | GDP Growth (%) | Canadian Merchandise Exports (US$B) | Canadian Merchandise Imports (US$B) | |
|---|---|---|---|---|---|
| United States | 325.9 | 59,531.6 | 2.3 | 319.5 (+7.3%) | 221.9 (+5.6%) |
| China | 1,390.1 | 8,643.1 | 6.9 | 18,200.3 (+15.0%) | 54,777.2 (+12.7%) |
| Mexico | 123.5 | 9,304.2 | 2.0 | 6,057.8 (+5.0%) | 27,353.8 (+9.1%) |
Infographic 2.2 Text Alternative
| Emerging Asia | |
|---|---|
| Population (M) | 3,574.9 |
| GDP Growth (%) | 6.5 |
| Canadian Merchandise Exports (US$M) | |
| Total | 26,282.2 (+14.6%) |
| Wood Pulp | 3,515.5 |
| Oil Seeds | 3,144.6 |
| Mineral Fuels | 1,635.4 |
| Cereals | 1,611.6 |
| Wood & Articles | 1,463.9 |
| Canadian Merchandise Imports (US$M) | |
| Total | 71,718.9 (+11.3%) |
| Electric Machinery & Equipment | 17,623.7 |
| Mechanical Machinery & Equipment | 11,903.1 |
| Knit Apparel & Accessories | 3,870.7 |
| Furniture | 3,850.4 |
| Non-Knit Apparel & Accessories | 3,399.4 |
Infographic 2.3 Text Alternative
| Eurozone | |
|---|---|
| Population (M) | 338.5 |
| GDP Growth (%) | 2.3 |
| Canadian Merchandise Exports (US$M) | |
| Total | 16,296.8 (+4.5%) |
| Ores | 2,195.1 |
| Mechanical Machinery & Equipment | 1,978.5 |
| Aircraft | 1,472.5 |
| Mineral Fuels | 1,327.9 |
| Precious Stones & Metals | 1,227.4 |
| Canadian Merchandise Imports (US$M) | |
| Total | 38,431.1 (+11.1%) |
| Mechanical Machinery & Equipment | 6,855.8 |
| Automotive Products | 5,587.5 |
| Pharmaceuticals | 4,135.1 |
| Mineral Fuels | 2,324.2 |
| Electric Machinery & Equipment | 2,310.8 |
Infographic 2.4 Text Alternative
| Latin America and the Caribbean | |
|---|---|
| Population (M) | 619.8 |
| GDP Growth (%) | 1.3 |
| Canadian Merchandise Exports (US$M) | |
| Total | 11,688.0 (+4.6%) |
| Mechanical Machinery & Equipment | 1,319.7 |
| Cereals | 1,137.8 |
| Automotive Products | 1,099.0 |
| Mineral Fuels | 801.6 |
| Oil Seeds | 743.6 |
| Canadian Merchandise Imports (US$M) | |
| Total | 40,192.0 (+8.9%) |
| Automotive Products | 9,339.8 |
| Electric Machinery & Equipment | 5,390.1 |
| Mechanical Machinery & Equipment | 4,414.3 |
| Precious Stones & Metals | 3,363.0 |
| Fruits & Nuts | 1,768.1 |
Strong economic performance with the fastest growth since 2011 buoyed global investment and trade in 2017. Activity was particularly impressive in the eurozone, Japan, China and the United States, all of which exceeded expectations last year. As an open economy, Canada is strongly affected by events in other economies and global trends. For example, in 2017, the enactment of a new budget in the United States affected the flow of foreign investment into Canada, and tensions in the Middle East have supported oil prices, thus positively affecting Canada’s terms of trade. Since Canada’s trade is fairly strongly concentrated, it may be particularly affected by events in a handful of key countries and regions. While the previous chapter briefly dealt with important global influences, this chapter describes the economic situation in Canada’s most important trading partners – the United States, China and Mexico – and in the key regions for Canada’s international activities – emerging Asia, the eurozone and Latin America and the Caribbean (LAC).
Many risks and policy challenges facing economies in 2017 are widely shared. A more interconnected world should make it easier to work together for the common good, but that is not what is observed at the moment. Ensuring stable external demand, fostering business and consumer confidence, raising productivity, improving income distribution and preserving a rules-based system of international exchange are the necessary conditions of prosperity for most countries. Yet when there is no domestic agreement on the solutions for these standard economic problems, political deadlock ensues and aggravates them. International institutions have long been a source of economic guidance, but currently there is a lack of worldwide agreement on their future role. Thus the whole multilateral trading and investment system reflecting the post-WWII consensus is in question, representing a threat to economic stability as we know it.
Advanced economies have an additional set of their own peculiar issues: the effect of their aging populations on labour force and productivity, income inequality, and sharing economic influence with emerging powers. The emerging economies have the advantage of a rosier labour force picture (with an important exception of China), grappling instead with challenges of continuous economic and social reforms, infrastructure, labour standards, human rights, pollution and governance institutions.
Considering the above picture, the key regions for Canada’s commercial policy offer greater challenges and greater opportunities than before. While the paramount importance of the United States to Canada’s economy will not change, other regions and countries may become more or less crucial for Canada – often depending on shared values and treaties that link it to these nations. In the coming years, the well-established links with the eurozone should expand further, as the implementation of the Canada-European Union Comprehensive Economic and Trade Agreement (CETA) occurs. For similar reasons, proximity to and engagement with LAC, and particularly Mexico, are to be expected, especially given the potential barriers in their economic relationship with the United States.
Emerging Asia continues to be a global growth leader, with China and India still the lands of peerless opportunities
Emerging Asia continues to be a global growth leader and cannot be ignored, with China and India still the lands of peerless opportunities; the trade talks with China are an important step in taking advantage of these opportunities. This chapter provides a brief overview of the most important facets of economic and trade developments in these countries and regions.
Country Overview
United States
Annual economic growth in the United States accelerated by the better part of a percentage point, from 1.5 percent in 2016 to 2.3 percent in 2017. This real GDP growth primarily reflected positive contributions from household expenditures, non-residential fixed investment, and exports. Government spending made a near-zero contribution. These contributions were partly offset by negative contributions from private inventory investment and imports. Compared with the previous year, the acceleration in real GDP reflected upturns in non-residential fixed investment and in exports. These positive contributing factors were partly offset by decelerations in residential fixed investment and in state and local government spending, as well as the acceleration in imports.
Growth in U.S. business fixed investment increased dramatically
Household spending expanded 2.8 percent in 2017, a slight pickup from 2.7 percent in the previous year, and once again made a dominant contribution of 1.89 percentage points to the final economic growth tally of 2.3 percent. The pace of spending rose for goods, up to 3.9 percent, but slowed marginally for services, down to 2.2 percent. Expenditures on durable goods accelerated to a 6.7-percent pace while growth in spending on nondurables slowed down to 2.4 percent. Growth in business fixed investment increased dramatically from 0.7 percent in 2016 to 4.0 percent in 2017. The pace of expansion in residential investment slowed down sharply from 5.5 percent in 2016 to 1.8 percent in 2017. Meanwhile, the reverse was the case for non-residential investment, which rebounded from a contraction of 0.6 percent in 2016 to post a 4.7-percent growth in 2017. Within the latter, investment rebounded both in the area of structures and that of machinery and equipment, while growth in investment in intellectual property products declined. As a result, business fixed investment contributed 0.65 percentage point to GDP growth in 2017, up from 0.12 percentage point in the previous year.
Contribution to GDP growth from net exports was negative again (-0.18 percentage point), but slightly less so than in 2016. Exports shrugged off their 2016 contraction to expand 3.4 percent, but imports accelerated from 1.3 percent in 2016 to 4.0 percent. The contribution to growth from both federal and state and local government spending was near-zero as both federal and state and local expenditures expanded marginally.
As in several previous years, weakness in the first quarter was again the case in 2017, as the economy grew just 1.2 percent. Residual seasonality was partly to blame, as well as a fall in consumer spending on autos and utilities, and lower defence spending. Strong consumer spending and non-residential investment boosted the growth to 3.1 percent in the second quarter of 2017. In the third quarter, investment and net exports pushed the economic growth even higher to 3.2 percent, before slowing down to a more restrained 2.9-percent pace in the last quarter of the year, mainly due to a sharp fall in inventory investment.
Overall, the latest U.S. data show signs of continuing strong recovery with 3.0 percent average annualized growth over the last three quarters of 2017, followed by unexpected first-quarter strength of 2.3 percent in 2018.
| Share in current dollars (%) | Growth from previous year (%) | Contributions to percent change in real GDP (percentage points) | |||
|---|---|---|---|---|---|
| 2017 | 2016 | 2017 | 2016 | 2017 | |
| Gross domestic product | 100 | 1.5 | 2.3 | 1.5 | 2.3 |
| Household expenditures | 69.6 | 2.7 | 2.8 | 1.86 | 1.89 |
| Goods | 4.7 | 3.7 | 3.9 | 0.81 | 0.85 |
| Durable goods | 10.0 | 5.5 | 6.7 | 0.41 | 0.50 |
| Non-durable goods | 15.1 | 2.8 | 2.4 | 0.40 | 0.35 |
| Services | 44.9 | 2.3 | 2.2 | 1.05 | 1.05 |
| Business fixed investment | 17.1 | 0.7 | 4.0 | 0.12 | 0.65 |
| Residential | 3.5 | 5.5 | 1.8 | 0.20 | 0.07 |
| Non-residential | 13.5 | -0.6 | 4.7 | -0.08 | 0.58 |
| Structures | 2.8 | -4.1 | 5.6 | -0.12 | 0.2 |
| Machinery & equipment | 6.4 | -3.4 | 4.8 | -0.20 | 0.27 |
| Intellectual property products | 4.4 | 6.3 | 3.9 | 0.25 | 0.16 |
| Investment in inventories | 0.1 | -66.8 | -54.5 | -0.40 | -0.11 |
| Net exports of goods and services | -3.6 | 7.5 | 6.1 | -0.23 | -0.18 |
| Exports | 12.8 | -0.3 | 3.4 | -0.04 | 0.40 |
| Goods | 8.8 | 0.3 | 4.5 | 0.02 | 0.35 |
| Services | 4.0 | -1.5 | 1.3 | -0.06 | 0.05 |
| Less imports | 16.5 | 1.3 | 4.0 | 0.19 | 0.58 |
| Goods | 13.5 | 0.9 | 4.3 | 0.11 | 0.51 |
| Services | 2.9 | 3.1 | 2.5 | 0.09 | 0.07 |
| Government expenditures and gross investment | 17.0 | 0.8 | 0.1 | 0.13 | 0.02 |
| Federal | 6.5 | 0.0 | 0.2 | 0.00 | 0.01 |
| State and Local | 10.4 | 1.2 | 0.1 | 0.13 | 0.01 |
Source: U.S. Bureau of Economic Analysis, Tables 1.1.2 and 1.1.6
Combined with other factors such as stronger and earlier federal outlays related to the Bipartisan Budget Act of 2018, this bodes well for the 2018 growth. Most cyclical indicators suggest that growth will stop accelerating by 2019 due to higher projected resource prices, upward pressure on inflation, a quicker monetary tightening schedule by the Federal Reserve, and global risks. Labor market data indicate that the country is close to full employment as the jobless rate reached 4.1 percent at the end of 2017 and is projected to dip below 4 percent in 2018. The IMF expects GDP growth of 2.9 percent in 2018, slowing down to 2.7 percent in 2019.
The IMF expects U.S. GDP growth of 2.9 percent in 2018, slowing down to 2.7 percent in 2019
Canada’s goods exports to the United States increased by 4.8 percent in 2017, slightly slower than the overall increase of 5.4 percent for Canada’s overall goods exports. Growth in goods imports from the United States rose 2.9 percent, also slower than the overall import growth rate of 4.8 percent.Footnote 2-1 Exports of services to the United States grew 2.7 percent, and imports of services from it grew 2.5 percent. Canada’s top five categories of export commodities to its greatest trading partner were: mineral fuels and oil, automotive products, mechanical machinery, plastics, and wood and articles of wood; its top five imports were automotive products, mechanical machinery, mineral fuels and oil, electric machinery and equipment, and plastics.
China
In 2017, China’s economy did better than many analysts expected. Economic growth accelerated to 6.9 percent (up 0.1 percentage point from 2016 and equal to 2015), surpassing the government’s target of around 6.5 percent. Even more impressively, this occurred while excessive credit growth was being reined in, following years of credit stimulus, previously flagged as a concern by many economic organizations.
China’s economy continued to switch over from investment-fueled to consumption-based growth while decelerating very gradually. Within the industrial sector, growth is slowing down in construction activities, manufacturing and mining. On the other hand, growth was observed to rise in the agriculture and service sectors. Real fixed investment growth continued to slow down, from 6.6 percent in 2016 to 5.7 percent in 2017.
IMF data indicate that China’s real exports of goods and services expanded by 9.2 percent in 2017. Real imports rose at a 6.9-percent pace. General government expenditures as a proportion of GDP were reduced from 31.9 percent in 2016 to 31.5 percent in 2017, and the current account surplus narrowed from 1.8 percent of GDP in 2016 to 1.4 percent of GDP in 2017. Inflation dipped to 1.6 percent, and so did reported unemployment, now at 3.9 percent.
China’s current economic policy targets were identified as pollution control, mitigation of financial system risk and new anti-poverty measures
China’s government, directing its economy to achieve a more sustainable consumption-based growth, is indicating satisfaction with its strong performance in setting its objectives. Current economic policy targets, identified in December’s annual economic work conference, were identified as pollution control, mitigation of financial system risk and new anti-poverty measures. These policies can be expected to slow down economic growth, indicating the Chinese government’s confidence in the strength of the economy to withstand them.
According to the IMF, China’s economy is expected to continue to slow down in the medium term – to 6.6 percent in 2018 and to 6.4 percent in 2019. Labour markets remain stable, and a controlled slowdown in housing is under way. Nevertheless, risks to China’s forecast in the medium term are on the downside. Large commercial indebtedness, excess industrial capacity, and a housing glut are all headwinds against the economy beyond the short term. In the short term, severe risks are associated with the trade spat with the United States, although the trading relationship of these countries is widely believed to be too extensive and lucrative to end in a full-scale trade war (for example, the latest IHSFootnote 2-2 forecast for China cites the risks of a trade war as “non-negligible”, but foresees a deal as the most probable outcome).
Canada’s goods exports to China rose 11.5 percent in 2017, a rate almost triple that of 2016. Meanwhile, Canada’s goods imports from China grew even faster, up 13.3 percent, to reach $42.6 billion. China remains Canada’s second-largest trade partner; Canada’s main export commodities to China in 2017 were oil seeds and miscellaneous plants, wood pulp, wood and articles of wood, automotive products, and ores; Canada’s main import commodities from China were electrical and electronic machinery, mechanical machinery, furniture, toys and sporting equipment, and plastics and articles thereof.
Mexico
After higher-than-expected GDP growth of 2.9 percent in 2016, Mexico’s economy has slowed to a 2.0-percent pace in 2017. A marked slowdown took place in the second half of 2017, as the growth figures were just short of a recession. A combination of factors is responsible. Public investment has declined, as the government is attempting to rein in the fiscal deficit stemming from lower oil prices, while the country’s central bank is fighting high inflation. But it is the renegotiation of NAFTA that remains the gravest external threat to the economy. Mexico’s manufacturing industry is the country’s engine, and the uncertainties or disruptions that the lengthening NAFTA negotiation process implies are not conducive to its normal business. Total investment was flat in 2016 and then contracted 1.0 percent in 2017, as business sentiment declined and private investment no longer compensated for the dip in public investment. FDI into Mexico declined 0.2 percent in 2017 and may be expected to fall further due to uncertainty.
Thus the outlook remains problematic for Mexico’s economy. Private consumption has driven growth in recent quarters, but may lose strength due to high inflation. Real exports increased 3.2 percent in 2017, while real imports increased 6.0 percent. The current account deficit narrowed to 1.6 percent of GDP, down from 2.1 percent in 2016; the unemployment rate edged down to a very low 3.4 percent in 2017. The Mexican peso will continue to show volatility in the short term. Elections scheduled for July 2018 are also a source of uncertainty. Nevertheless, the IMF projects a pickup in growth to 2.3 percent in 2018 and all the way to 3.0 percent in 2019; other forecasters disagree. IHS expects only 1.9-percent growth in 2018 and 2.0 percent in 2019; the Economist Intelligence Unit (EIU) forecast is in the similar range. Most risks are associated with U.S. policy, punitive trade barriers or a complete failure of NAFTA negotiations. The climate of fiscal austerity and rising interest rates is a damper on economic growth.
While IMF projects a pickup in Mexico’s growth to 2.3 percent in 2018 and to 3.0 percent in 2019, other forecasters disagree
Mexico remains one of Canada’s key trading partners, and the current situation may be very conducive to expanding these ties, as Mexico will need more friends in the Americas in the medium term. In some industries, Canadian businesses looking to expand abroad might consider Mexico as a viable alternative to the United States. Canada’s goods imports from Mexico grew 12.4 percent in 2017. In contrast, Canada’s goods exports to Mexico grew much slower – up 3.3 percent. Canada’s merchandise trade deficit with Mexico expanded to $27.6 billion in 2017, second only to the deficit with China. This deficit is largely generated by three sectors: automotive, electric and electronic machinery, and mechanical machinery, which together account for over three-quarters of it.
Regional Overview
Emerging Asia
According to the IMF’s estimates, growth in emerging Asia averaged 6.5 percent in 2017, unchanged from the previous year. This is the world’s fastest-growing region, and is projected to continue to grow at that level in the medium term. Among the large economies in this region, China regained its growth lead with reported 6.9-percent growth in 2017, slightly ahead of India, which grew at 6.7 percent. The ASEAN-5 economies (Indonesia, Malaysia, the Philippines, Thailand and Vietnam) improved their economic performance, as their growth increased from 5.0 percent in 2016 up to 5.3 percent in 2017. Medium-term growth prospects remain favourable in the region. In India, the domestic demand is recovering from the double shock of its currency exchange program in 2016 and the introduction of a goods and services tax in 2017, and economic growth is expected to continue approaching the 8-percent mark, with 7.4-percent performance in 2018 and accelerating to 7.8 percent by 2019. Stronger domestic demand will underpin continued strength in the ASEAN-5 economies, and broadly stable growth is expected. Continued policy support and careful management underpin China’s growth, but this support is expected to weaken as the government deals with its anti-pollution, anti-poverty and anti-debt agenda. Vast diversity and inequality remain the keynote within this region; e.g. India’s per capita income is less than one quarter that of China, and while Malaysia, like China, runs a current account surplus, the opposite is true of India and Indonesia.
| 2017 | Emerging Asia | China | India | Indonesia | Malaysia |
|---|---|---|---|---|---|
| GDP Growth (%) | 6.5 | 6.9 | 6.7 | 5.1 | 5.9 |
| GDP per capita ($US) | - | 8,643.1 | 1,982.7 | 3,875.8 | 9,812.8 |
| Inflation (%) | 2.4 | 1.6 | 3.6 | 3.8 | 3.8 |
| Unemployment (%) | - | 3.9 | - | 5.4 | 3.4 |
| Current Account Balance (% of GDP) | 0.9 | 1.4 | -2.0 | -1.7 | 3.0 |
| Real Exports Growth, Goods and Services (%) | 8.8 | 9.2 | 7.2 | 5.6 | 8.2 |
| Real Imports Growth, Goods and Services (%) | 8.1 | 6.9 | 10.6 | 8.9 | 9.0 |
| Canadian exports (merchandise, $US M) | 26,282.2 | 18,200.3 | 3,283.7 | 1,334.3 | 552.9 |
| Canadian imports (merchandise, $US M) | 71,718.9 | 54,777.2 | 3,204.0 | 1,334.1 | 2,151.2 |
| Canada's trade balance (merchandise, $US M) | -45,436.7 | -36,576.9 | 79.7 | 0.2 | -1,598.3 |
Source: IMF WEO Database, April 2018; and Global Trade Atlas
Inflation continues to be moderate in most of the region, recently moderating in India; average inflation in emerging Asia fell to 2.4 percent in 2017. Unemployment is also fairly low across emerging Asia, with Indonesia’s 5.4 percent as the highest among large economies, although data for India were not available. Real exports of goods and services grew at a strong pace of 8.8 percent in 2017; China and Malaysia benefited the most. Real imports registered a similar growth pace, up 8.1 percent, with India in the lead at 10.6 percent while China’s import growth, at 6.9 percent, was comparatively modest. Current account balances were 0.9 percent of GDP on average, with a strong surplus in Malaysia and a deficit of 2.0 percent of GDP in India.
China is and will remain Canada’s most important trading partner in emerging Asia, accounting for over twothirds of Canada’s exports and over three-quarters of Canada’s imports. Of key importance in Canada’s trade with the region are the imports of electrical and electronic machinery conducted through the key international export platforms (e.g. China, Malaysia and, increasingly, Vietnam). Canada’s trade with this region’s countries that are not part of that platform, such as India and Indonesia, is nearly balanced, demonstrating that trade deficit is not necessarily a feature of Canada’s commercial activities in the region. Emerging Asia now accounts for 16.6 percent of Canada’s imports and 6.2 percent of Canada’s exports, both up considerably from the previous year.
Canada’s trade with India and Indonesia is nearly balanced, demonstrating that trade deficit is not necessarily a feature of trade with emerging Asia
Eurozone
After many years of tentative and uncertain economic conditions in the eurozone, proper recovery has finally arrived. Growth expectations have been exceeded, as the 2.3-percent performance of 2017 ranks it as the best year after the Great Recession. Many years of substandard performance in the region mean that it is in mid-cycle of the recovery, that there is relatively more slack in the economy than is the case for other developed countries, and so the current spurt of growth has the potential to be stronger and last longer. At the same time, some preliminary survey data indicate that growth may already be peaking in early 2018; as the projections of output gaps in the aftermath of a lasting crisis are very uncertain, it is difficult to estimate when growth in the eurozone will fall back to normal levels. Current projections call for a moderate speed-up to 2.4 percent in 2018 as some countries catch up with the trend, before falling back to 2.0 percent in 2019. Medium-term growth is projected at 1.4 percent, as low productivity and unfavorable demographics dominate. Sizeable risks remain, chiefly associated with potential trade disruption and the rolling back of monetary stimulus by the European Central Bank, as well as internal disagreements between members.
| 2017 | Eurozone | France | Germany | Italy | Spain |
|---|---|---|---|---|---|
| GDP Growth (%) | 2.3 | 1.8 | 2.5 | 1.5 | 3.1 |
| GDP per capita ($US) | - | 39,869.1 | 44,549.7 | 31,984.0 | 28,358.8 |
| Inflation (%) | 1.5 | 1.2 | 1.7 | 1.3 | 2.0 |
| Unemployment (%) | 9.1 | 9.4 | 3.8 | 11.3 | 17.2 |
| Current Account Balance (% of GDP) | 3.5 | -1.4 | 8.0 | 2.9 | 1.7 |
| Real Exports Growth, Goods and Services (%) | 5.0 | 3.3 | 4.7 | 5.4 | 5.0 |
| Real Imports Growth, Goods and Services (%) | 4.2 | 4.1 | 5.1 | 5.3 | 4.7 |
| Canadian exports (merchandise, $US M) | 16,296.8 | 2,624.9 | 3,188.6 | 1,768.2 | 1,274.2 |
| Canadian imports (merchandise, $US M) | 38,431.1 | 4,769.3 | 13,826.2 | 6,285.7 | 2,159.7 |
| Canada's trade balance (merchandise, $US M) | -22,134.2 | -2,144.4 | -10,637.6 | -4,517.5 | -885.5 |
Source: IMF WEO Database, April 2018; and Global Trade Atlas
In 2017, strong growth was observed in Germany and Spain; both are now expected to have peaked. Outlook for Germany calls for the same 2.5-percent growth in 2018, and 2.0 percent in 2019; Spain is projected to slow down to 2.8 percent and 2.2 percent, respectively. France, which has lost some time and whose trade exposure is less, has posted 1.8-percent growth and should continue to expand in the short term, to 2.1 percent in 2018 and then down to 2.0 percent in 2019. Italy was up to 1.5-percent growth in 2017 and should produce equal growth in 2018 before falling back to 1.1 percent in 2019. As for the United Kingdom, growth was 1.8 percent in 2017, but the combination of continued uncertainty about the path of Brexit, high inflation and strengthening currency points to a declining short-term outlook. Growth is projected to decelerate to 1.6 percent in 2018 and 1.5 percent in 2019.
Inflation picked up to somewhat normal levels in 2017, averaging 1.5 percent for the year, as deflation in Italy and Spain has ended. The unemployment rate improved further to 9.1 percent, but is very unevenly distributed; surveys in Germany show tight labour markets while Italy and Spain are still running double-digit unemployment rates. Current account balances as a proportion of GDP in the region remain strongly positive at 3.5 percent, rising as high as 8.0 percent in Germany but dipping to negative 1.4 percent for France.
Total imports by Canada from the eurozone rose substantially in 2017 and now amount to 8.9 percent of Canada’s total imports; imports from Germany – mainly automotive products and machinery – account for over one-third of that figure. Exports to the eurozone are smaller, amounting to 3.9 percent of Canada’s total exports to the world, with this share falling slightly in 2017. Trade with the eurozone countries is much more diverse in detail than with most other regions. While Germany is very important, it does not dominate Canada’s trade with its eurozone partners. Many eurozone countries occupy key positions in Canada’s global supply chains, and the importance of Europe as a global services hub may be of key value to Canada in the future, especially in light of the new trade agreement between us.
Many eurozone countries occupy key positions in Canada’s global supply chains, and the importance of Europe as a global services hub may be of key value to Canada
Latin America and the Caribbean (LAC)
After three consecutive years of slowing down, LAC economies finally saw better times in 2017. Local giants, Argentina and Brazil, both came out of the recession that year, and the region followed: growth picked up from negative 0.6 percent in 2016 to 1.3 percent in 2017. The external environment is much more favourable to growth in the short term, and improved commodity prices, which fuel the region’s economy, provide a crucial boost to regional balances. Nevertheless, business investment and confidence are still relatively low. Brazil, Mexico and Colombia will hold general elections in 2018, and many important investment decisions might be deferred until then. Growth could be boosted by timely fiscal stimulus, but this is likely not in the cards as the fiscal balances of most countries are stretched already (partly due to the collapse in commodity prices over 2014-2015). Thus the potential for growth to surprise on the upside is limited. Current growth projections call for 2.0-percent growth in 2018, which is fairly low for the region; this is partly due to the ongoing collapse of Venezuela’s economy.
| 2017 | Latin America & the Caribbean | Brazil | Chile | Mexico | Peru |
|---|---|---|---|---|---|
| GDP Growth (%) | 1.3 | 1.0 | 1.5 | 2.0 | 2.5 |
| GDP per capita ($US) | - | 9,894.9 | 15,070.4 | 9,304.2 | 6,762.2 |
| Inflation (%) | 4.1 | 3.4 | 2.2 | 6.0 | 2.8 |
| Unemployment (%) | - | 12.8 | 6.7 | 3.4 | 6.7 |
| Current Account Balance (% of GDP) | -1.6 | -0.5 | -1.5 | -1.6 | -1.3 |
| Real Exports Growth, Goods and Services (%) | 3.7 | 10.9 | -1.0 | 3.2 | 7.3 |
| Real Imports Growth, Goods and Services (%) | 4.6 | 3.8 | 4.7 | 6.0 | 4.4 |
| Canadian exports (merchandise, $US M) | 11,688.0 | 1,321.4 | 682.7 | 6,057.8 | 546.1 |
| Canadian imports (merchandise, $US M) | 40,192.0 | 3,633.1 | 1,545.2 | 27,353.8 | 1,389.1 |
| Canada's trade balance (merchandise, $US M) | -28,504.0 | -2,311.7 | -862.6 | -21,296.0 | -843.0 |
Source: IMF WEO Database, April 2018; and Global Trade Atlas
In 2017, stronger growth was observed in Uruguay at 3.1 percent and Argentina at 2.9 percent. Peru at 2.5 percent and Mexico at 2.0 percent were also above average, but this year was the low point of the cycle for them; growth in Peru was 4.1 percent in 2016, and is expected to rebound to 3.7 percent in 2018. As for Mexico, strong growth of 2.9 percent in 2016 faltered somewhat in 2017, but is expected to ratchet back to 3.0 percent by 2019. The big regional stories were the rebounds in Brazil (up from negative 3.5 percent in 2016 to 1.0 percent in 2017) and Argentina (up from negative 1.8 percent in 2016 to 2.9 percent in 2017). Brazil’s economic growth is expected to strengthen to 2.3 percent in 2018 and 2.5 percent in 2019, while Argentina’s reforms will cause its pace to dip to 2.0 percent in 2018 before they will allow it to accelerate to 3.2 percent in 2019. Meanwhile, economic activity in Venezuela went from bad to worse as GDP was down 16.5 percent in 2016 and then estimated to have dropped another 14.0 percent in 2017 by the IMF (although precise calculations are difficult due to the economic chaos).
Inflation averaged 4.1 percent through the region, an improvement over the last year. Data for Argentina, not available from the national sources for 2016, indicated 25.7 percent inflation in 2017, while Venezuela’s exceeded 1,000 percent. Inflation abated in Brazil (down from 8.7 percent to 3.4 percent), Colombia and Uruguay, but rose to 6.0 percent in Mexico. Conversely, the unemployment picture was fairly difficult in Brazil where the rate was 12.8 percent, while Mexico clicked along smartly at only 3.4 percent. The current account balance for the region as a whole improved further to negative 1.6 percent of GDP; every major economy was in the negative territory. The LAC region’s real exports continued their recovery, going up 3.7 percent, while real imports rose 4.6 percent. Brazil’s real exports soared 10.9 percent while Chile’s fell; import growth was the rule among the large economies.
Imports from LAC rose to 9.3 percent of Canada’s total, with Mexico accounting for over two-thirds of these, seven and a half times the value of imports from Brazil
Canada’s links with this region were getting stronger in the recent years. Imports from LAC rose to 9.3 percent of Canada’s total imports in 2017, with Mexico accounting for over two-thirds of Canada’s imports from the region, 7.5 times the value of imports from the next-biggest partner (Brazil). Exports to the region represented 2.7 percent of Canada’s total exports, over half of those to Mexico. Canada ran substantial trade deficits with Mexico, Brazil, Chile and Peru in 2017, importing two to four times as much as it exported to those countries. This region is of particular interest to Canada’s trade policy, with a number of trade and investment protection agreements signed in recent years, and culminating in the recent Comprehensive and Progressive Agreement for Trans-Pacific Partnership (CPTPP). Other initiatives may be expected as LAC countries search for stronger hemispheric links in the wake of possible policy and trade risks emanating from the United States, and Canada is deepening its ties with MERCOSUR and the Pacific Alliance.
World Merchandise Trade Value Rankings
For the ninth consecutive year, China was the world-leading merchandise exporter at US$2.3 trillion, accounting for 12.8 percent of the global exports (down from 13.2 percent in 2016). The United States, in second place, exported US$1.5 trillion worth of merchandise. Germany was third with US$1.4 trillion in exports and 8.2 percent of the global market.
These top three exporters were followed, at a considerable distance, by Japan, with US$698 billion in exports, and the Netherlands, with US$652 billion in exports. South Korea vaulted to sixth place with exports of US$574 billion, and Hong Kong slipped down to seventh with US$550 billion in exports. France went from seventh to eighth place with exports of US$535 billion.
Italy remained ninth with US$506 billion in exports and a 2.9-percent share and the United Kingdom closed out the top ten with US$445 billion in exports. Canada remained in 12th place with exports of US$421 billion – which translated to a 2.4-percent share of the world’s exports.
Canada slipped out of world’s top ten merchandise importers, from 9th down to 12th place
On the import side, Canada slipped out of the top ten and all the way down to 12th place, having imported US$442 billion worth of merchandise. Other changes in the top ten were Japan passing the United Kingdom to capture the fourth spot with US$672 billion in imports and a 3.7-percent share of the import market. South Korea and Italy went up a rank to ninth and tenth positions, respectively. The United States was the leading importer with US$2.4 trillion in imports, but China took back the distinction of the world’s leading trading nation overall, after yielding it to the United States in 2016.
| 2017 | 2016 | 2017 | 2017 | |
|---|---|---|---|---|
| Rank | Rank | Exporters | US $B Value | % Share |
| 1 | 1 | China | 2,263 | 12.8 |
| 2 | 2 | United States | 1,547 | 8.7 |
| 3 | 3 | Germany | 1,448 | 8.2 |
| 4 | 4 | Japan | 698 | 3.9 |
| 5 | 5 | Netherlands | 652 | 3.7 |
| 6 | 8 | South Korea | 574 | 3.2 |
| 7 | 6 | Hong Kong | 550 | 3.1 |
| 8 | 7 | France | 535 | 3 |
| 9 | 9 | Italy | 506 | 2.9 |
| 10 | 10 | United Kingdom | 445 | 2.5 |
| 12 | 12 | Canada | 421 | 2.4 |
| 2017 | 2016 | 2017 | 2017 | |
| Rank | Rank | Importers | US $B Value | % Share |
| 1 | 1 | United States | 2,409 | 13.4 |
| 2 | 2 | China | 1,842 | 10.2 |
| 3 | 3 | Germany | 1,167 | 6.5 |
| 4 | 5 | Japan | 672 | 3.7 |
| 5 | 4 | United Kingdom | 644 | 3.6 |
| 6 | 6 | France | 625 | 3.5 |
| 7 | 7 | Hong Kong | 590 | 3.3 |
| 8 | 8 | Netherlands | 574 | 3.2 |
| 9 | 10 | South Korea | 478 | 2.7 |
| 10 | 11 | Italy | 453 | 2.5 |
| 12 | 9 | Canada | 442 | 2.5 |
Source: WTO Press Release, April 2018
World Services Trade Value Rankings
In 2017, the United States remained the world’s foremost supplier and consumer of services, although the margin of its supremacy fell back considerably. Its US$762 billion in services exports accounted for 14.5 percent of global exports, a decrease from 15.4 percent in 2016. The United Kingdom was a distant second, at US$354 billion, or 6.7 percent of the global exports, also a relative decrease from 2016. Germany and France remained third and fourth with US$296 billion and US$249 billion, respectively. China kept its fifth place, with US$226 billion in services exports; all those positions were unchanged since 2013.
| 2017 | 2016 | 2017 | 2017 | |
|---|---|---|---|---|
| Rank | Rank | Exporters | US $B Value | % Share |
| 1 | 1 | United States | 762 | 14.5 |
| 2 | 2 | United Kingdom | 354 | 6.7 |
| 3 | 3 | Germany | 296 | 5.6 |
| 4 | 4 | France | 249 | 4.7 |
| 5 | 5 | China | 226 | 4.3 |
| 6 | 6 | Netherlands | 216 | 4.1 |
| 7 | 10 | Ireland | 182 | 3.5 |
| 8 | 7 | Japan | 180 | 3.4 |
| 9 | 8 | India | 179 | 3.4 |
| 10 | 9 | Singapore | 165 | 3.1 |
| 18 | 18 | Canada | 86 | 1.6 |
| 2017 | 2016 | 2017 | 2017 | |
| Rank | Rank | Importers | US $B Value | % Share |
| 1 | 1 | United States | 516 | 10.2 |
| 2 | 2 | China | 464 | 9.2 |
| 3 | 3 | Germany | 319 | 6.3 |
| 4 | 4 | France | 244 | 4.8 |
| 5 | 6 | United Kingdom | 218 | 4.3 |
| 6 | 8 | Netherlands | 211 | 4.2 |
| 7 | 5 | Ireland | 196 | 3.9 |
| 8 | 7 | Japan | 189 | 3.7 |
| 9 | 9 | Singapore | 171 | 3.4 |
| 10 | 10 | India | 150 | 3 |
| 14 | 14 | Canada | 105 | 2.1 |
Source: WTO Press Release, April 2018
The Netherlands remained sixth, exporting US$216 billion worth of services; Ireland vaulted up three spots from 2016 to end up in seventh rank, with US$182 billion exported and a 3.5-percent share of the global market. Japan and India followed with US$180 billion and US$179 billion in the eighth and ninth spot, respectively. Singapore closed out the top ten with US$165 billion in services exports. Canada remained in 18th place, with exports of US$86 billion, accounting for 1.6 percent of the world’s services exports, a marginal relative decrease from 2016.
In terms of imports, the United States remained in first place, with US$516 billion in imports of services and a 10.2-percent global share. China remained a close second with US$464 billion in services imports in 2017. Germany, with imports of US$319 billion, was a distant third; France was ranked fourth, with US$244 billion in services imports and a 4.8-percent global share. The United Kingdom rose to fifth with imports of US$218 billion and the Netherlands to sixth at US$211 billion in imports. Ireland slipped past them into seventh, having imported US$196 billion worth of services and accounted for 3.9 percent of global imports. Japan was eighth and Singapore ninth, with imports of US$189 billion and US$171 billion, respectively, while India stayed in tenth. Canada’s services imports were US$105 billion, which put it in 14th place, the same rank as in 2016, with 2.1 percent of the global services import market.
Trade is Not Gender Neutral: Gender Analysis of the Impacts of Trade Agreements
Trade agreements were often said to be gender neutral.Footnote m1- 1 More accurately they would be described as gender blind – there are no innate biases in design favouring or disadvantaging one sex over the other. However, that does not mean that there could not be differential impacts by gender. The opportunities and costs could be claimed by or fall on one gender disproportionally due to other biases or historical roles or norms. This report describes recent work undertaken by the Office of the Chief Economist at Global Affairs Canada to understand the differentiated labour market impacts of trade agreements in Canada by gender and complements previous work on women-owned exporters.Footnote m1- 2 The results clearly indicate that trade is not gender neutral.
Methodology for Estimating Gender Impacts of Trade Policy
Although developed independently, the methodology employed by Global Affairs Canada follows closely that described by the United Nations Conference on Trade and Development (UNCTAD) in its Trade and Gender Toolbox.Footnote m1- 3 Global Affairs Canada has for some time used a Computable General-Equilibrium (CGE) model to estimate the economic impacts of trade policy. A CGE model compares two points in time: as close an approximation to the current state of the economy as it can manage, versus a state of the world after a shock is applied and the economy has had time to adjust and find a new equilibrium level. In the present context, that shock is a new trade agreement and the difference between these two states is the impact of the shock.Footnote m1- 4
Trade creates an impact on the economy by encouraging the reallocation of resources away from sectors where the country does not have a comparative advantage and toward sectors in which it does. By so doing, capital and labour become more productive and this results in a net increase in economic output. Estimating the labour market impacts, however, poses a special challenge. The increased output of sectors with comparative advantage could be achieved by hiring only a few new workers and employing much more capital resulting in a large increase in labour productivity and wages, but few employment impacts. Alternatively, output could simply be increased by employing more labour, resulting in an increase in jobs but not much for wages. In addition, if labour markets adjust freely, workers should shift easily from contracting sectors to expanding sectors resulting in little if any employment impacts. Conversely, if labour markets fail to adjust, the new employment in expanding sectors may be met through new entrants to the labour force. A common interpretation is that inflexible labour markets approximate a short-term impact while that of flexible labour markets reflects the longer-term impact once all adjustments have taken place.
The precise method by which labour adjusts to the shock of a trade agreement is an issue for empirical study and will be covered in the section on next steps. At present, it is assumed that the sectoral output impacts are translated directly into employment impacts and that there are no productivity changes (i.e. if a sector is expected to see an increase of output of 6 percent, then that sector is assumed to also see an increase in employment of 6 percent). These labour market impacts are then applied to a matrix of employment by sector in Canada disaggregated by gender.
Employment by gender is obtained from Statistics Canada’s labour force survey. The data are highly disaggregated with more than 300 four-digit North American Industrial Classification (NAICS) industries. The basis of the CGE model used by Global Affairs Canada is a modified version of the Global Trade Analysis Project (GTAP) model. As this model is international in nature, the sectors do not conform precisely to Canadian employment data by gender. As such, it is necessary to concord the employment data to the GTAP model’s approximately 50 sectors.
Figure 1
Gender Composition of Select Industries in Canada, 2016

Source: Labour Force Statistics
Figure 1 Text Alternative
| Men | Women | |
|---|---|---|
| Forestry & Logging | 23.9 | 2.9 |
| Construction | 1,222.6 | 162.4 |
| Fishing | 12.0 | 2.5 |
| Mining | 211.2 | 52.7 |
| Transport & Warehousing | 695.5 | 211.9 |
| Manufacturing | 1,218.4 | 476.4 |
| Agriculture | 187.8 | 78.9 |
| Retail | 961.3 | 1,106.5 |
| Finance & Insurance | 333.3 | 474.8 |
| Education | 416.7 | 853.3 |
| Health | 408.1 | 1,931.2 |
For Canada, men dominate sectors where physical strength is, or was at some point, an important characteristic of the job such as forestry and logging, construction, mining, and manufacturing. These also tend to be more traded sectors. In contrast, women account for more than half of employment in the health, education, finance and insurance, and retail sectors.
The Results
The shock in this case is a fictitious regional trade agreement with a group of both developed and developing economies. Overall, as a result of the agreement, Canadian GDP is predicted to increase by 0.7 percent implying an agreement of significant size.
As there is a net positive impact of the agreement overall, as indicated by the positive impact on GDP, the overall employment impact is also positive. Overall, using the method described above, the estimated employment impact of this scenario is 8,300 job losses and 32,800 job gains for a net increase of 24,700 jobs. To put those numbers into perspective, the 8,300 job losses of this scenario represent approximately five-one hundredths of one percent of total Canadian employment, which stood at more than 18 million in 2016, the year for which this analysis was done. Or to put it another way, the Canadian economy has been adding between 30,000 and 40,000 net new jobs per month on average for the past year. Also, as the current methodology implies no productivity gains, the results may be interpreted as an upper bound, and so the job impacts of even this extreme scenario results in relatively modest job impacts.
Figure 2
Post Agreement Employment Change
(Level Change in Contracting/Expanding Sectors)
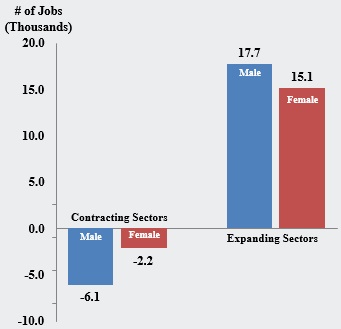
Source: Gender Impact Trade Shock Scenario
Figure 2 Text Alternative
| Contracting Sectors | Expanding Sectors | |||
|---|---|---|---|---|
| Male | Female | Male | Female | |
| # of Jobs (Thousands) | -6.1 | -2.2 | 17.7 | 15.1 |
The broad outline of the estimated gender impacts is not surprising. Given that men account for the largest share of employment in traded sectors, men are found to be the most impacted by the trade agreement, in both contracting and expanding sectors. The proportions are very different however; while men dominate employment in contracting sectors by a ratio of almost three to one, they are only slightly ahead among expanding sectors. By design, the sex ratio of each sector is held constant based on the most recent full year of employment data. As a result, even if men were to be disproportionately impacted by job losses, which would potentially imply that more men were seeking jobs in other sectors, this would not be accounted for by the job gains. In this particular scenario, the jobs gains are nearly four times as great as the number of those lost and so this would not likely be a constraining factor.
The sectors being impacted will vary by agreement, but the results in this example are likely illustrative in a number of dimensions. First, the losses are highly concentrated. In this example, the motor vehicles and parts industry accounts for the majority of losses for both sexes. This implies that the fictitious trade agreement is with a country or group of countries that has scope for expanding automotive exports to Canada or to existing destinations for Canadian auto exports. The more general takeaway, however, is that the motor vehicles and parts sector is a large employer in Canada and continues to enjoy relatively high tariff barriers both in Canada as well as in countries where Canadian automotive products are sold. The sectoral impacts will largely be determined by the degree of protections removed and the level of employment of the sector.
Figure 3
Contracting Sectors

Source: Gender Impact Trade Shock Scenario
Figure 3 Text Alternative
| Male Employment | Female Employment | |||||||
|---|---|---|---|---|---|---|---|---|
| TOTAL | Business services nec | Trade | Construction | TOTAL | Business services nec | Public Administration, Defense, Education, Health | Trade | |
| # of Jobs (Thousands) | 17.8 | 7.57 | 2.09 | 1.93 | 15.2 | 5.86 | 4.57 | 2.13 |
Figure 4
Expanding Sectors
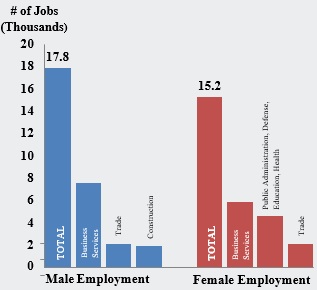
Source: Gender Impact Trade Shock Scenario
Figure 4 Text Alternative
| Male Employment | Female Employment | |||||
|---|---|---|---|---|---|---|
| TOTAL | Motor vehicles and parts | Chemical, rubber, plastic products | TOTAL | Motor vehicles and parts | Chemical, rubber, plastic products | |
| # of Jobs (Thousands) | -6.27 | -4.12 | -0.47 | -1.99 | -1.11 | -0.25 |
A second takeaway comes from looking at expanding sectors. The business services sector appears among the largest gainers for both sexes. Again, this can often be anticipated as an advanced country like Canada would be expected to face competitive pressures in more traditional manufacturing sectors as the result of a trade agreement with low-wage countries but will have comparative advantage in higher-knowledge sectors such as business services, which includes many professional services such as legal, accounting, architecture, engineering, and similar sectors.
It is also notable that the expanding sectors are more diverse than the contracting sectors. The trade,Footnote m1- 5 construction, and public administration sectors are not expanding due to export opportunities for the most part, but rather from the general expansion of economic activity that results from the trade agreement. These expanding sectors are more difficult to identify specifically as well as to link them to the trade agreement whereas the losses will be more easily identified creating a communications challenge for policy-makers.
Conclusions and Next Steps
Trade policy may be gender blind, but it is not gender neutral. As previously shown, majority female-owned SMEs are less likely to export, and while this may be explainable once industry and size of firm are taken into account, it does not imply that more should not be done.Footnote m1- 6 Similarly, women are less likely to be employed in highly traded sectors, particularly in import competing sectors, and as a result are more insulated from trade policy, but by the same token may see less of the benefits from trade.
This analysis has only looked at the gender impacts of trade for Canada and has not looked at our trading partners. Any such work should be done cooperatively. The data required to undertake this analysis are not onerous. Most advanced countries would have the basic gender composition of the labour force, and in those countries for which such data are not available, analysis can focus on those sectors that are being most impacted and for which the gender imbalance is significant.
The refinement of these results is not in the data but rather in the methodology. A methodology that allows for a more nuanced link between trade policy shocks and labour impacts without requiring a one-for-one transmission from changes in output to labour would likely have the most significant impact on the results and potentially allow for the demand and supply of workers to balance. A better understanding of within-industry responses to trade shocks would provide more dynamic results.
3. Canada’s Economic Performance


Overview of Canada's Economy, 2017
Infographic 3.1 Text Alternative
| Growth (%) | |
|---|---|
| Gross Domestic Product | 3.0 |
| Household Expenditure | 1.96 |
| Business Investment | 0.50 |
| Inventory Investment | 0.75 |
| Net Exports of Goods and Services | -0.89 |
| Government Expenditure and Gross Investment | 0.61 |
Infographic 3.2 Text Alternative
| Goods | |
|---|---|
| Industry | Growth (%) |
| Machinery Manufacturing | 15.9 |
| Mining, Quarrying and Oil and Gas Extraction | 8.2 |
| Non-Metallic Minerals | 8.1 |
| Plastics and Rubber | 7.7 |
| Petroleum and Coal Products | 7.6 |
| Services | |
| Wholesale Trade | 7.4 |
| Transportation and Warehousing | 4.8 |
| Retail Trade | 4.6 |
| Professional and Technical | 3.3 |
| Arts and Entertainment | 2.9 |
Infographic 3.3 Text Alternative
| Growth | |
|---|---|
| Employment | 336,500 Jobs (+1.9%) |
Infographic 3.4 Text Alternative
| Provinces and Territories | Number of Employees (000's) |
|---|---|
| Alberta | 2,286.9 |
| British Columbia | 2,466.8 |
| Manitoba | 644.1 |
| New Brunswick | 352.9 |
| Newfoundland and Labrador | 224.1 |
| Nova Scotia | 449.0 |
| Ontario | 7,128.0 |
| Prince Edward Island | 73.7 |
| Quebec | 4,223.3 |
| Saskatchewan | 567.6 |
| Northwest Territories | 21.3 |
| Yukon | 21.2 |
| Nunavut | 13.4 |
| Total | 18,416.4 |
2017 was a year of very robust growth for Canada’s economy, which expanded 3.0 percent – its best performance since the economic recovery from the Great Recession in 2010 and 2011. The cyclical recovery in manufacturing and trade that began in the second half of 2016 in most developed countries continued in 2017, benefiting Canada and leading to a more balanced growth in the economy. With the economy operating close to its capacity, the labour market near equilibrium and inflation stable, the signs for the future are also encouraging. These trends are broad-based across regions and sectors, but are particularly advantageous in British Columbia, which led the Canadian provinces in relative employment gains for the second year running. The resource sector of Canada’s economy has also benefited from the continuing upturn in commodity prices. Strong gains in employment brought the unemployment rate to near-historic lows. Substantial monetary stimulus remains in the system despite the beginning of a tightening cycle by the Bank of Canada, while existing federal fiscal stimulus is projected to be strengthened by the recent provincial announcements in Ontario and Quebec. The weighty issues on the short-term economic horizon both involve uncertainty. The first one is the uncertainty around the NAFTA renegotiation process, and the global rules-based trading system in general. The second is the uncertainty related to the impact of high household debt load on consumer demand in Canada. In the short term, the IMF expects Canada’s growth to moderate to 2.1 percent in 2018 and to 2.0 percent in 2019.
A year of robust growth for Canada at 3.0 percent, with the economy operating close to its capacity, the labour market near equilibrium and inflation stable
Strong first-quarter growth of 4.0 percent and second-quarter growth of 4.4 percent brought about most of the past year’s economic gains. This white-hot pace was obviously not sustainable, given the potential long-term growth is estimated at about 1.8 percent by the Bank of Canada. Growth slowed down in the third quarter to 1.5 percent before recovering to 1.7 percent in the last quarter of the year. Output soared in goods sectors after two years of declines, with substantial increases in mining and oil extraction, construction, and manufacturing.
Trade policy uncertainty and competitiveness challenges continued to weigh on the numbers and outlook, as the NAFTA negotiations and worldwide trade policy volatility continued. Employment rose briskly during this expansion year, generating 336,500 new jobs, with substantial gains across the country. A strong recovery in resource prices helped the economy in 2017, and the generally supportive monetary and fiscal environment continued.
Business investment began recovering in 2017, though household spending remained the major source of growth. Robust increases in household spending last year were mostly due to spending on goods and were the highest for durable goods. Inventory investment, followed by government spending and investment, were the other major contributors to economic growth. The contribution of net exports to growth turned negative in 2017, as import growth outpaced that of the exports. The Canadian dollar did not move substantially during the year, though its end-year value was higher than in the beginning in U.S. dollar terms. Inflation rose slightly to 1.6 percent while core inflation moderated.
Figure 3-1
Canadian Real GDP Growth %, 2013-2017

Figure 3-1 Text Alternative
Canadian Real GDP Growth, 2013-2017
| 2013 | 2014 | 2015 | 2016 | 2017 |
|---|---|---|---|---|
| 2.5 | 2.9 | 1.0 | 1.4 | 3.0 |
| Q4 2016 | Q1 2017 | Q2 2017 | Q3 2017 | Q4 2017 |
| 2.2 | 4.0 | 4.4 | 1.5 | 1.7 |
Gross Domestic Product (GDP)
Canada’s real GDP growth soared to 3.0 percent in 2017, more than doubling the 1.4-percent performance of 2016. The year ended with the sixth straight quarter of growth, and much of the yearly strength was due to the first half of the year, with deceleration in the second half. This was the highest growth observed in Canada since 2011, considerably exceeding the IMF forecast of 1.9 percent made in April 2017. The IMF currently expects this growth to be rolled back to 2.1 percent in 2018 and to 2.0 percent in 2019, in spite of considerable acceleration forecast for the U.S. economy for those years. The Canadian economy is now operating close to capacity, with some short-term fluctuations due to temporary factors. Inflation is on target, and economic growth in the next few years will benefit from some additional fiscal stimulus.
In 2017, the main contributions to GDP growth came from household expenditures, followed by inventory investment, government expenditure and business investment. Growth in household expenditures (i.e. private consumption) continued to increase its pace, up to 3.5 percent in 2017 after 2.4-percent growth in 2016. This was due to higher spending on both goods and services, but particularly on durable goods. Growth in spending on services accelerated from 2.2 percent in 2016 to 3.2 percent in 2017. As a result, private consumption of goods and services contributed about equally to the 1.97-percentage point boost that household expenditures gave to GDP growth. This contribution was dominant, accounting for about two-thirds of the total GDP growth.
After two years of decline, business investment rose 2.6 percent
After two years of decline, business investment rose in 2017, up 2.6 percent. Business investment in residential structures grew 3.1 percent, with non-residential investment growing 2.6 percent, mostly due to investment in machinery and equipment. Overall, business investment added 0.50 percentage point to GDP growth in 2017. Investment in inventories rebounded after shrinking in the previous year and was a strong factor in GDP growth with a 0.75-percentage point contribution in 2017, dominated by non-farm investment.
Net exports, the difference between exports and imports, reversed their positive contribution to growth, subtracting 0.89 percentage point from GDP growth last year. Growth in real exports remained at 1.0 percent, led by continuing strong growth in services (up 2.8 percent). Growth in real imports advanced 3.6 percent in 2017, mostly due to the 3.9-percent growth in goods imports, as real services imports expanded 2.2 percent. Government expenditure and investment continued to support GDP growth with a contribution of 0.61 percentage point to GDP growth, a similar level of support to 2016.
| Share in current dollars (%) | Growth from previous year (%) | Contributions to percent change in real GDP (p. p.) | |||
|---|---|---|---|---|---|
| 2017 | 2016 | 2017 | 2016 | 2017 | |
| Gross domestic product | 100.0 | 1.4 | 3.0 | 1.4 | 3.0 |
| Household expenditures | 56.3 | 2.4 | 3.5 | 1.35 | 1.97 |
| Goods | 24.8 | 2.6 | 3.9 | 0.65 | 0.95 |
| Durable goods | 7.5 | 4.5 | 6.4 | 0.32 | 0.47 |
| Semi-durable goods | 4.0 | 2.2 | 3.4 | 0.09 | 0.14 |
| Non-durable goods | 13.3 | 1.7 | 2.6 | 0.24 | 0.34 |
| Services | 31.6 | 2.2 | 3.2 | 0.71 | 1.01 |
| Business investment | 19.0 | -4.5 | 2.6 | -0.90 | 0.50 |
| Residential | 7.7 | 3.3 | 3.1 | 0.25 | 0.24 |
| Non-residential | 9.6 | -9.4 | 2.6 | -1.03 | 0.25 |
| Structures | 5.7 | -11.5 | 0.3 | -0.78 | 0.02 |
| Machinery & equipment | 3.8 | -6.0 | 6.0 | -0.24 | 0.23 |
| Intellectual property products | 1.7 | -6.3 | 1.0 | -0.12 | 0.02 |
| Inventory investment | 0.7 | -79.2 | 1,303.4 | -0.23 | 0.75 |
| Non-farm | 0.7 | -88.2 | 2,053.9 | -0.27 | 0.74 |
| Farm | 0.0 | -191.1 | - | 0.04 | 0.03 |
| Net exports of goods and services | -2.3 | - | - | 0.63 | -0.89 |
| Exports | 30.9 | 1.0 | 1.0 | 0.35 | 0.28 |
| Goods | 25.6 | 0.5 | 0.6 | 0.16 | 0.13 |
| Services | 5.3 | 3.5 | 2.8 | 0.19 | 0.15 |
| Less imports | 33.2 | -1.0 | 3.6 | -0.28 | 1.17 |
| Goods | 26.7 | -1.3 | 3.9 | -0.31 | 1.03 |
| Services | 6.4 | 0.3 | 2.2 | 0.02 | 0.14 |
| Government expenditure and gross investment | 24.7 | 2.7 | 2.5 | 0.67 | 0.61 |
| Non-profit institutions serving households expenditures and gross investment | 1.6 | -0.4 | 0.4 | -0.01 | 0.01 |
Source: Statistics Canada, Tables 380-0064 and 380-0100
GDP by Industrial Activity
Real GDP at basic prices, by industry, increased 3.3 percent in 2017, more than double the 1.4-percent growth in the previous year. After two years of declines, output soared in goods-producing industries in 2017, rising 4.6 percent. Growth in service-producing industries, traditionally more stable, also accelerated, from 2.2 percent in 2016 to 2.8 percent in 2017.
Among the goods industries, GDP growth was the highest in mining, quarrying, and oil and gas extraction where after two years of decline GDP grew at 8.2 percent. Construction expanded briskly at 4.0 percent and utilities grew at 2.8 percent, while agriculture, forestry, fishing and hunting slowed down a notch in 2017.
The massive growth in machinery manufacturing stood out at 15.9 percent
Manufacturing increased at a 3.2-percent rate with output in non-durables growing faster at 3.5 percent, while output in durables improved the most during the year (from a 1.2-percent decline in 2016 to 3.0-percent increase in 2017). The runaway growth recorded in machinery manufacturing stood out at 15.9 percent. Increases were the rule, with the highest growth observed in non-metallic minerals (up 8.1 percent), plastics and rubber (up 7.7 percent), and petroleum and coal products (up 7.6 percent). Activity declined considerably in miscellaneous manufacturing (down 5.1 percent), with decreases also observed in transportation equipment manufacturing (down 3.0 percent), printing (down 1.6 percent) and furniture (down 0.6 percent).
| 2015 | 2016 | 2017 | |
|---|---|---|---|
| All industries | 1.0 | 1.4 | 3.3 |
| Goods-producing industries | -1.7 | -0.5 | 4.6 |
| Agriculture, forestry, fishing and hunting | 3.8 | 3.9 | -0.1 |
| Mining, quarrying and oil and gas extraction | -2.3 | -0.6 | 8.2 |
| Utilities | -0.8 | 1.0 | 2.8 |
| Construction | -4.6 | -3.3 | 4.0 |
| Manufacturing | 0.2 | 0.6 | 3.2 |
| Non-durable manufacturing | 1.8 | 2.8 | 3.5 |
| Food | 1.4 | 5.0 | 5.0 |
| Beverages and tobacco | 2.7 | 2.3 | 1.4 |
| Textiles, clothing and leather | -2.8 | -6.2 | 3.1 |
| Pulp and paper | 3.2 | -1.5 | 1.2 |
| Printing | -1.3 | -0.6 | -1.6 |
| Petroleum and coal products | -2.2 | -1.1 | 7.6 |
| Chemicals | 5.0 | 5.3 | 0.0 |
| Plastics and rubber | 2.7 | 4.4 | 7.7 |
| Durable manufacturing | -1.1 | -1.2 | 3.0 |
| Wood | 5.5 | 6.0 | 1.7 |
| Non-metallic minerals | -2.5 | -0.7 | 8.1 |
| Primary metals | -4.7 | 3.5 | 4.1 |
| Fabricated metal products | -5.2 | -7.0 | 5.2 |
| Machinery manufacturing | -4.4 | -5.7 | 15.9 |
| Computers and electronic products | 0.1 | -1.3 | 2.9 |
| Electrical equipment etc. | -2.2 | -1.1 | 1.9 |
| Transportation equipment | 0.4 | -0.8 | -3.0 |
| Furniture | 3.1 | 2.5 | -0.6 |
| Miscellaneous manufacturing | 7.0 | -0.9 | -5.1 |
| Services-producing industries | 2.1 | 2.2 | 2.8 |
| Wholesale trade | 1.0 | 0.2 | 7.4 |
| Retail trade | 2.9 | 3.2 | 4.6 |
| Transportation and warehousing | 2.8 | 2.8 | 4.8 |
| Information and culture | -0.1 | 1.0 | 1.1 |
| Finance and insurance | 5.0 | 4.5 | 2.7 |
| Real estate | 3.4 | 3.2 | 2.8 |
| Professional and technical | 1.4 | 1.1 | 3.3 |
| Management of companies | 1.7 | -1.7 | -3.4 |
| Administrative and support | -0.4 | -0.3 | 0.3 |
| Education | 2.0 | 1.3 | 1.2 |
| Health care and social assistance | 2.0 | 2.8 | 1.9 |
| Arts and entertainment | 5.3 | 4.3 | 2.9 |
| Hotels and restaurants | 1.4 | 2.6 | 2.7 |
| Other | 0.3 | -1.2 | 0.8 |
| Public administration | 0.4 | 1.8 | 1.9 |
Source: Statistics Canada, Table 379-0031
Most major services industries grew during 2017 with the single exception of management of companies (down 3.4 percent). Wholesale trade was the fastest-growing industry at 7.4 percent, followed by transportation and warehousing, retail trade, and professional and technical services.
Employment
In 2017, employment in Canada expanded by 336,500 jobs (up 1.9 percent) and reached 18.4 million. The unemployment rate that stood at 6.9 percent in December 2016 declined 1.1 percentage points to 5.8 percent at the end of 2017. There was no change in the participation rate during the year, which was at 65.8 percent in both December 2016 and December 2017.
After three consecutive annual declines, employment increased 1.1 percent in the goods-producing industries. This increase amounted to 43,000 jobs and was led by an increase of 30,000 jobs in manufacturing (up 1.8 percent) and an increase of 24,300 jobs in construction (up 1.8 percent). The most significant relative increase in jobs was observed in forestry and fishing, which was up 3.7 percent, although that only translated to 2,400 more jobs, predominantly in fishing. Employment in utilities and agriculture each dropped by 3.4 percent during the year and remained stable in mining, oil and gas extraction.
Employment in the services-producing industries recorded a growth of 2.1 percent and accounted for 87.3 percent of the total increase in Canadian employment. Jobs grew the fastest in transportation and warehousing services (up 4.0 percent), professional and technical services (up 4.0 percent) and finance, insurance and real estate services (up 3.9 percent). Employment in wholesale and retail trade increased 2.3 percent but added the most jobs to the economy (up 63,700). Employment declined in business and support services (down 1.3 percent) and hotels and restaurants (down 0.1 percent).
British Columbia’s employment gains were the highest among the provinces, up 3.7 percent
Regionally, job gains and losses diverged somewhat, although the general trend was toward higher employment. Ontario had the highest total job gains (up 128,400 jobs), followed by Quebec (up 90,200 jobs) and British Columbia (up 87,300 jobs). In relative terms, British Columbia’s employment gains were the highest among the provinces (up 3.7 percent), with Prince Edward Island registering the next largest increase (up 3.1 percent). Declines in employment occurred in Newfoundland and Labrador (down 8,500 jobs) and Saskatchewan (down 900 jobs). Among the territories, Yukon alone showed employment growth of 1,000 jobs (up 5 percent), while employment fell 1,200 jobs in Northwest Territories (down 5.3 percent) and marginally in Nunavut (down 0.7 percent).
| 2017 (000's) | Share (%) | Change (%) | |
|---|---|---|---|
| Total, all industries | 18,416.4 | 100.0 | 1.9 |
| Industrial Employment | |||
| Goods-producing industries | 3,876.0 | 21.0 | 1.1 |
| Agriculture | 279.5 | 1.5 | -3.4 |
| Forestry and fishing | 65.4 | 0.4 | 3.7 |
| Mining, oil and gas extraction | 264.2 | 1.4 | 0.2 |
| Utilities | 132.6 | 0.7 | -3.4 |
| Construction | 1,409.3 | 7.7 | 1.8 |
| Manufacturing | 1,724.8 | 9.4 | 1.8 |
| Services-producing industries | 14,540.5 | 79.0 | 2.1 |
| Trade | 2,809.6 | 15.3 | 2.3 |
| Transportation and warehousing | 943.7 | 5.1 | 4.0 |
| Finance, insurance and real estate | 1,171.3 | 6.4 | 3.9 |
| Professional/technical | 1,448.8 | 7.9 | 4.0 |
| Business and support | 756.6 | 4.1 | -1.3 |
| Education | 1,285.0 | 7.0 | 1.2 |
| Health care/social assistance | 2,383.2 | 12.9 | 1.9 |
| Information, culture and recreation | 789.2 | 4.3 | 0.9 |
| Hotels and restaurants | 1,210.8 | 6.6 | -0.1 |
| Other | 781.3 | 4.2 | 0.8 |
| Public administration | 961.0 | 5.2 | 3.6 |
| Provincial Employment | |||
| Alberta | 2,286.9 | 12.4 | 1.0 |
| British Columbia | 2,466.8 | 13.4 | 3.7 |
| Manitoba | 644.1 | 3.5 | 1.7 |
| New Brunswick | 352.9 | 1.9 | 0.4 |
| Newfoundland and Labrador | 224.1 | 1.2 | -3.7 |
| Northwest Territories | 21.3 | 0.1 | -5.3 |
| Nova Scotia | 449.0 | 2.4 | 0.6 |
| Nunavut | 13.4 | 0.1 | -0.7 |
| Ontario | 7,128.0 | 38.7 | 1.8 |
| Prince Edward Island | 73.7 | 0.4 | 3.1 |
| Quebec | 4,223.3 | 22.9 | 2.2 |
| Saskatchewan | 567.6 | 3.1 | -0.2 |
| Yukon | 21.2 | 0.1 | 5.0 |
Source: Statistics Canada, Tables 282-0007 and 282-0123
Inflation
Canada’s annual rate of inflation rose slightly from 1.4 percent in 2016 to 1.6 percent in 2017. The Bank of Canada’s core inflation measures all showed declines during the year, with one of these, CPI-trim,Footnote 3-1 decelerating from 1.9-percent growth in 2016 to 1.5-percent pace in 2017. Thus both the CPI and the core inflation rate are well within the target area of the Bank of Canada monetary policy, with monetary support from the Bank continuing at high levels. Increases in core inflation measures are expected in 2018 due in part to recent minimum wage increases.
Services prices grew considerably faster (up 2.2 percent) than goods prices (up 0.8 percent). Prices of nondurable goods grew the fastest (up 1.4 percent), followed by durables (up 0.6 percent) while prices of semidurables declined (down 0.2 percent). Growth in food prices slowed down to a crawl in 2017 (up 0.1 percent), a considerable change from the 3.7-percent pace of 2015. Prices of shelter increased at a steady rate of 1.7 percent, while prices of household operations increased marginally, up 0.2 percent. Prices of alcohol and tobacco continued to grow faster than the average at 2.7 percent, while recreation and education activities cost 2.4 percent more in 2017 than in the previous year. Prices of gasoline jumped 11.8 percent after two annual decreases, driving transportation prices up as well (up 3.9 percent), while prices of clothing and footwear declined again (down 0.7 percent).
Quebec had the lowest inflation recorded in Canada at 1.0 percent
Regionally, the highest level of inflation was again observed in Newfoundland and Labrador at 2.4 percent. Inflation was also higher than the national average in New Brunswick (up 2.3 percent), British Columbia (up 2.1 percent), Prince Edward Island (up 1.8 percent) and Ontario (up 1.7 percent). Quebec had the lowest inflation recorded in Canada at 1.0 percent.
| 2015 | 2016 | 2017 | |
|---|---|---|---|
| All-items CPI | 1.1 | 1.4 | 1.6 |
| Food | 3.7 | 1.5 | 0.1 |
| Shelter | 1.1 | 1.6 | 1.7 |
| Household operations | 2.7 | 1.7 | 0.2 |
| Clothing and footwear | 1.5 | -0.2 | -0.7 |
| Transportation | -3.0 | 1.1 | 3.9 |
| Gasoline | -16.5 | -6.0 | 11.8 |
| Health and personal care | 1.3 | 1.4 | 1.7 |
| Recreation and education | 1.9 | 1.7 | 2.4 |
| Alcohol and tobacco | 3.7 | 3.2 | 2.7 |
| CPI-trim | 1.6 | 1.9 | 1.5 |
| Durable goods | 1.5 | 3.1 | 0.6 |
| Semi-durable goods | 1.5 | 0.2 | -0.2 |
| Non-durable goods | -0.7 | 0.1 | 1.4 |
| Services | 2.0 | 1.8 | 2.2 |
| Provincial CPI | |||
| Alberta | 1.1 | 1.1 | 1.6 |
| British Columbia | 1.1 | 1.8 | 2.1 |
| Manitoba | 1.2 | 1.3 | 1.6 |
| New Brunswick | 0.5 | 2.2 | 2.3 |
| Newfoundland and Labrador | 0.5 | 2.7 | 2.4 |
| Northwest Territories [Yellowknife] | 1.6 | 1.2 | 1.2 |
| Nova Scotia | 0.4 | 1.2 | 1.1 |
| Nunavut [Iqaluit] | 1.9 | 2.5 | 1.6 |
| Ontario | 1.2 | 1.8 | 1.7 |
| Prince Edward Island | -0.6 | 1.2 | 1.8 |
| Quebec | 1.1 | 0.7 | 1.0 |
| Saskatchewan | 1.6 | 1.1 | 1.7 |
| Yukon [Whitehorse] | -0.2 | 1.0 | 1.7 |
Source: Statistics Canada, Tables 282-0123, 326-0021 and 326-0023
The Canadian Dollar
After declining against the U.S. dollar for five consecutive years, the value of the Canadian dollar vis-à-vis the greenback rose by 2.0 percent in 2017. The value of the loonie relative to the European euro was almost unchanged (up 0.1 percent). The Canadian dollar rose substantially against both the Japanese yen (up 5.4 percent) and the British pound (up 7.4 percent).
Throughout most of 2017 and similarly to the previous year, the Canadian dollar traded in a narrow 10-cent band relative to the U.S. dollar (between 72¢ and 82¢). After opening at US 74.4¢ on January 3, the Canadian dollar hovered around US 76¢ till late February, but declined to US 74.0¢ by March. On May 4, the currency hit its low for the year at US 72.8¢ and rallied from there until a peak of US 80.3¢ on July 28. After a weakening in August, the Canadian dollar continued rising in September, briefly exceeding US 82¢ to hit its high for the year at US 82.5¢ on September 11. From that high point, the currency quickly declined to a plateau at US 78¢ by October and continued trading around that mark until a rally in the last week of the year sent it up to close at US 79.7¢ on December 29, 2017.
Figure 3-2
CAN$-US$ Daily Exchange Rate (2017)

Figure 3-2 Text Alternative
| Date | Conversion Rate |
|---|---|
| 1/3/2017 | 0.744324525 |
| 1/4/2017 | 0.75103267 |
| 1/5/2017 | 0.755058895 |
| 1/6/2017 | 0.756773119 |
| 1/9/2017 | 0.755287009 |
| 1/10/2017 | 0.756830394 |
| 1/11/2017 | 0.754716981 |
| 1/12/2017 | 0.763009309 |
| 1/13/2017 | 0.760977095 |
| 1/16/2017 | 0.760340633 |
| 1/17/2017 | 0.765872712 |
| 1/18/2017 | 0.763417055 |
| 1/19/2017 | 0.751710141 |
| 1/20/2017 | 0.748727164 |
| 1/23/2017 | 0.752388835 |
| 1/24/2017 | 0.759070897 |
| 1/25/2017 | 0.76405868 |
| 1/26/2017 | 0.763184004 |
| 1/27/2017 | 0.762020879 |
| 1/30/2017 | 0.762543846 |
| 1/31/2017 | 0.767459708 |
| 2/1/2017 | 0.764876855 |
| 2/2/2017 | 0.768285187 |
| 2/3/2017 | 0.768285187 |
| 2/6/2017 | 0.763417055 |
| 2/7/2017 | 0.759474444 |
| 2/8/2017 | 0.760051684 |
| 2/9/2017 | 0.76178868 |
| 2/10/2017 | 0.764292265 |
| 2/13/2017 | 0.764409112 |
| 2/14/2017 | 0.765110941 |
| 2/15/2017 | 0.76405868 |
| 2/16/2017 | 0.765990042 |
| 2/17/2017 | 0.763242253 |
| 2/21/2017 | 0.76057195 |
| 2/22/2017 | 0.758667779 |
| 2/23/2017 | 0.762776506 |
| 2/24/2017 | 0.763650248 |
| 2/27/2017 | 0.762311328 |
| 2/28/2017 | 0.754773945 |
| 3/1/2017 | 0.749737592 |
| 3/2/2017 | 0.746993352 |
| 3/3/2017 | 0.745990302 |
| 3/6/2017 | 0.746045956 |
| 3/7/2017 | 0.745323098 |
| 3/8/2017 | 0.742115028 |
| 3/9/2017 | 0.740028121 |
| 3/10/2017 | 0.742721331 |
| 3/13/2017 | 0.743660296 |
| 3/14/2017 | 0.741619697 |
| 3/15/2017 | 0.744712541 |
| 3/16/2017 | 0.750807118 |
| 3/17/2017 | 0.749793807 |
| 3/20/2017 | 0.748615062 |
| 3/21/2017 | 0.750919877 |
| 3/22/2017 | 0.748502994 |
| 3/23/2017 | 0.74985003 |
| 3/24/2017 | 0.747719456 |
| 3/27/2017 | 0.747775368 |
| 3/28/2017 | 0.747719456 |
| 3/29/2017 | 0.748278958 |
| 3/30/2017 | 0.751653638 |
| 3/31/2017 | 0.751314801 |
| 4/3/2017 | 0.747160789 |
| 4/4/2017 | 0.744878957 |
| 4/5/2017 | 0.745767768 |
| 4/6/2017 | 0.745267551 |
| 4/7/2017 | 0.746547219 |
| 4/10/2017 | 0.749119784 |
| 4/11/2017 | 0.750075008 |
| 4/12/2017 | 0.751879699 |
| 4/13/2017 | 0.753295669 |
| 4/17/2017 | 0.752502069 |
| 4/18/2017 | 0.747551768 |
| 4/19/2017 | 0.742942051 |
| 4/20/2017 | 0.741729714 |
| 4/21/2017 | 0.740411669 |
| 4/24/2017 | 0.741179958 |
| 4/25/2017 | 0.735726898 |
| 4/26/2017 | 0.735672773 |
| 4/27/2017 | 0.733998826 |
| 4/28/2017 | 0.731957254 |
| 5/1/2017 | 0.732064422 |
| 5/2/2017 | 0.728862974 |
| 5/3/2017 | 0.729181858 |
| 5/4/2017 | 0.727643164 |
| 5/5/2017 | 0.729288215 |
| 5/8/2017 | 0.729660708 |
| 5/9/2017 | 0.728438228 |
| 5/10/2017 | 0.731421884 |
| 5/11/2017 | 0.729554242 |
| 5/12/2017 | 0.729181858 |
| 5/15/2017 | 0.733084085 |
| 5/16/2017 | 0.735510444 |
| 5/17/2017 | 0.734537976 |
| 5/18/2017 | 0.734699875 |
| 5/19/2017 | 0.738334318 |
| 5/23/2017 | 0.741289844 |
| 5/24/2017 | 0.742942051 |
| 5/25/2017 | 0.743328626 |
| 5/26/2017 | 0.743162901 |
| 5/29/2017 | 0.743715603 |
| 5/30/2017 | 0.742445616 |
| 5/31/2017 | 0.740740741 |
| 6/1/2017 | 0.740740741 |
| 6/2/2017 | 0.740521327 |
| 6/5/2017 | 0.741674701 |
| 6/6/2017 | 0.742886858 |
| 6/7/2017 | 0.741179958 |
| 6/8/2017 | 0.740576168 |
| 6/9/2017 | 0.743328626 |
| 6/12/2017 | 0.745434215 |
| 6/13/2017 | 0.755401118 |
| 6/14/2017 | 0.757059581 |
| 6/15/2017 | 0.752841978 |
| 6/16/2017 | 0.755743652 |
| 6/19/2017 | 0.756429652 |
| 6/20/2017 | 0.753749906 |
| 6/21/2017 | 0.751314801 |
| 6/22/2017 | 0.755229968 |
| 6/23/2017 | 0.753693096 |
| 6/26/2017 | 0.755401118 |
| 6/27/2017 | 0.758265089 |
| 6/28/2017 | 0.765696784 |
| 6/29/2017 | 0.768344218 |
| 6/30/2017 | 0.770594128 |
| 7/4/2017 | 0.77273781 |
| 7/5/2017 | 0.770297335 |
| 7/6/2017 | 0.772439364 |
| 7/7/2017 | 0.77597579 |
| 7/10/2017 | 0.77591558 |
| 7/11/2017 | 0.773993808 |
| 7/12/2017 | 0.781616383 |
| 7/13/2017 | 0.784744566 |
| 7/14/2017 | 0.789141414 |
| 7/17/2017 | 0.789328282 |
| 7/18/2017 | 0.791891036 |
| 7/19/2017 | 0.793965859 |
| 7/20/2017 | 0.794596742 |
| 7/21/2017 | 0.796876245 |
| 7/24/2017 | 0.799232737 |
| 7/25/2017 | 0.799552251 |
| 7/26/2017 | 0.799680128 |
| 7/27/2017 | 0.798722045 |
| 7/28/2017 | 0.803406443 |
| 7/31/2017 | 0.800961153 |
| 8/1/2017 | 0.799105002 |
| 8/2/2017 | 0.796178344 |
| 8/3/2017 | 0.795038957 |
| 8/4/2017 | 0.791264441 |
| 8/8/2017 | 0.789141414 |
| 8/9/2017 | 0.787091696 |
| 8/10/2017 | 0.786720164 |
| 8/11/2017 | 0.788332676 |
| 8/14/2017 | 0.787091696 |
| 8/15/2017 | 0.784006272 |
| 8/16/2017 | 0.78746358 |
| 8/17/2017 | 0.790701352 |
| 8/18/2017 | 0.794533609 |
| 8/21/2017 | 0.795228628 |
| 8/22/2017 | 0.796685787 |
| 8/23/2017 | 0.795924865 |
| 8/24/2017 | 0.798148296 |
| 8/25/2017 | 0.800512328 |
| 8/28/2017 | 0.801153661 |
| 8/29/2017 | 0.799041151 |
| 8/30/2017 | 0.793335978 |
| 8/31/2017 | 0.797702616 |
| 9/1/2017 | 0.807102502 |
| 9/5/2017 | 0.80834209 |
| 9/6/2017 | 0.815394651 |
| 9/7/2017 | 0.82318077 |
| 9/8/2017 | 0.824266403 |
| 9/11/2017 | 0.824538259 |
| 9/12/2017 | 0.822436056 |
| 9/13/2017 | 0.820546484 |
| 9/14/2017 | 0.819806526 |
| 9/15/2017 | 0.82088327 |
| 9/18/2017 | 0.817126982 |
| 9/19/2017 | 0.814531237 |
| 9/20/2017 | 0.814796708 |
| 9/21/2017 | 0.810438447 |
| 9/22/2017 | 0.811886011 |
| 9/25/2017 | 0.810307106 |
| 9/26/2017 | 0.808407437 |
| 9/27/2017 | 0.80567193 |
| 9/28/2017 | 0.803212851 |
| 9/29/2017 | 0.801282051 |
| 10/2/2017 | 0.799680128 |
| 10/3/2017 | 0.8 |
| 10/4/2017 | 0.801346262 |
| 10/5/2017 | 0.796939751 |
| 10/6/2017 | 0.796876245 |
| 10/10/2017 | 0.799936005 |
| 10/11/2017 | 0.80012802 |
| 10/12/2017 | 0.801796023 |
| 10/13/2017 | 0.800832866 |
| 10/16/2017 | 0.798148296 |
| 10/17/2017 | 0.796939751 |
| 10/18/2017 | 0.800897005 |
| 10/19/2017 | 0.801410482 |
| 10/20/2017 | 0.79358781 |
| 10/23/2017 | 0.790888959 |
| 10/24/2017 | 0.789515238 |
| 10/25/2017 | 0.783024039 |
| 10/26/2017 | 0.779362481 |
| 10/27/2017 | 0.77675936 |
| 10/30/2017 | 0.778998208 |
| 10/31/2017 | 0.775614675 |
| 11/1/2017 | 0.776096236 |
| 11/2/2017 | 0.77990953 |
| 11/3/2017 | 0.783453463 |
| 11/6/2017 | 0.784559862 |
| 11/7/2017 | 0.782166601 |
| 11/8/2017 | 0.785607668 |
| 11/9/2017 | 0.787897888 |
| 11/10/2017 | 0.78845699 |
| 11/14/2017 | 0.785360873 |
| 11/15/2017 | 0.782901433 |
| 11/16/2017 | 0.78462142 |
| 11/17/2017 | 0.782288978 |
| 11/20/2017 | 0.78167748 |
| 11/21/2017 | 0.782595085 |
| 11/22/2017 | 0.785607668 |
| 11/23/2017 | 0.78647267 |
| 11/24/2017 | 0.786905886 |
| 11/27/2017 | 0.785237534 |
| 11/28/2017 | 0.780822987 |
| 11/29/2017 | 0.778028476 |
| 11/30/2017 | 0.77591558 |
| 12/1/2017 | 0.785607668 |
| 12/4/2017 | 0.787711698 |
| 12/5/2017 | 0.788643533 |
| 12/6/2017 | 0.783883358 |
| 12/7/2017 | 0.778634275 |
| 12/8/2017 | 0.777604977 |
| 12/11/2017 | 0.777967948 |
| 12/12/2017 | 0.776940409 |
| 12/13/2017 | 0.778089013 |
| 12/14/2017 | 0.780944943 |
| 12/15/2017 | 0.779180302 |
| 12/18/2017 | 0.777302759 |
| 12/19/2017 | 0.776036008 |
| 12/20/2017 | 0.778694907 |
| 12/21/2017 | 0.785299199 |
| 12/22/2017 | 0.783760483 |
| 12/27/2017 | 0.791076655 |
| 12/28/2017 | 0.794407372 |
| 12/29/2017 | 0.797130331 |
In consequence, at the year-end mark the Canadian dollar appreciated in value 7.0 percent against the U.S. dollar relative to the previous year-end mark.
The Canadian dollar appreciated in value 7.0 percent against the U.S. dollar relative to the previous year-end mark
At the same time, Canada’s currency depreciated against the European euro (down 5.9 percent) and the British pound (down 2.3 percent) while appreciating 3.2 percent against the Japanese yen at the end-year mark.
Using NAFTA? Trends in Coverage Rates and Utilization Rates
Introduction
The North American Free Trade Agreement (NAFTA) between Canada, the United States and Mexico is Canada’s most important regional free trade agreement (FTA) to date in terms of the size of trade. It delivered significant tariff elimination and fostered high trade growth among the three partner countries since it came into effect 24 years ago. However, doubts have been raised in various recent publications about whether FTAs such as NAFTA actually foster trade and economic growth to the extent claimed. In 2015, for example, Thomson Reuters published a survey that suggested FTAs were actually underutilized globally. There is a possibility of an institutional failure that firms may not be making optimal use of tariff treatment to maximize the potential benefits of an FTA. Footnote m2-1
Using the recent Canadian customs data, the following analysis looks specifically at the relationship between Canada’s imports from the United States and the utilization of NAFTA preferential tariffs to provide an updated perspective on whether Canadian importers actually make full use of NAFTA.
Do Companies Actually Take Full Advantage of NAFTA Preferences?
There is no formal definition of the utilization of tariff preferences in publications; as a result, there are different ways to measure whether firms are utilizing tariff preferences available to them under any FTA, whether bilateral or regional. One approach is to compare the level of imports that claim the preferences in the agreement in question with total imports. This is referred to as the coverage rate. This approach often gives rise to a moderate rate of use because total imports include both Most Favoured Nation (MFN) duty-free and excluded products that are not affected by the trade agreement. A second approach, the utilization rate, compares imports that claim the tariff preferences with dutiable imports Footnote m2-2 only, thus excluding all MFN duty-free and imports excluded from the agreement. This method results in a high rate of use.
Figure 1 below depicts the coverage rate of NAFTA for Canadian imports from the United States from 1994 to 2016. Throughout the entire period, only about half (between 40 percent and 50 percent) of Canadian imports from the United States claimed NAFTA preferences. Footnote m2-3 This result appears to support the conclusions of the 2015 Thomson Reuters survey that preferential tariff rates are underutilized. However, the coverage rate is not necessarily the best indicator to measure the rate of use of tariff preferences because it includes in the calculations products that are either already MFN duty-free or excluded from the trade agreement. Conversely, the utilization rate only considers dutiable products and is therefore a better option as it is derived from the share of imports actually receiving preferential tariff treatments out of the total dutiable imports covered by the trade agreement.
Figure 1
NAFTA Coverage rate for Canadian imports from the U.S., 1994-2016

Source: Statistics Canada
Figure 1 Text Alternative
| Year | % |
|---|---|
| 1994 | 43.6 |
| 1995 | 44.5 |
| 1996 | 45 |
| 1997 | 47.2 |
| 1998 | 43.8 |
| 1999 | 40.6 |
| 2000 | 39.1 |
| 2001 | 42.6 |
| 2002 | 45.1 |
| 2003 | 44.1 |
| 2004 | 42.9 |
| 2005 | 43.6 |
| 2006 | 43.8 |
| 2007 | 42.7 |
| 2008 | 41.7 |
| 2009 | 43.8 |
| 2010 | 42.9 |
| 2011 | 40.9 |
| 2012 | 41.7 |
| 2013 | 41.9 |
| 2014 | 40.4 |
| 2015 | 41.1 |
| 2016 | 41.8 |
Figure 2 illustrates the utilization rate of NAFTA preferences from the United States between 1994 and 2016. As shown, the NAFTA utilization rate is clearly higher than the coverage rate since the denominator is restricted to dutiable imports. While the coverage rate remained stable roughly between 40 percent and 50 percent, the utilization rate of NAFTA preferences increased from 50 percent in 1994 when NAFTA came into effect to over 80 percent in 2016. This means the proportion of dutiable products from the United States that entered Canada using preferential rates increased 30 percentage points since the implementation of the FTA.
Figure 2
NAFTA Utilization Rates for Canadian Imports from the U.S. (1994 - 2016)
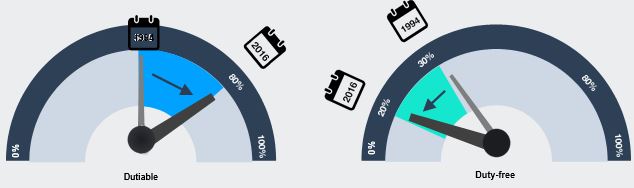
Source: Statistics Canada
Figure 2 Text Alternative
| Years | Dutiable | Duty-free |
|---|---|---|
| 1994 | 48.8 | 33.4 |
| 1995 | 49.6 | 34.1 |
| 1996 | 48.7 | 35.1 |
| 1997 | 55.6 | 25.6 |
| 1998 | 52.5 | 33.6 |
| 1999 | 51.1 | 28.2 |
| 2000 | 52.3 | 24.3 |
| 2001 | 60.8 | 21.9 |
| 2002 | 66.6 | 19.1 |
| 2003 | 66.8 | 17.9 |
| 2004 | 67.4 | 15.5 |
| 2005 | 69.5 | 15.9 |
| 2006 | 70.9 | 14.5 |
| 2007 | 70.5 | 13.4 |
| 2008 | 73.3 | 13.2 |
| 2009 | 76.3 | 16.1 |
| 2010 | 79.8 | 21.4 |
| 2011 | 79.1 | 19.0 |
| 2012 | 79.8 | 20.1 |
| 2013 | 80.9 | 21.1 |
| 2014 | 82.3 | 19.3 |
| 2015 | 81.3 | 20.3 |
| 2016 | 80.9 | 20.1 |
The calculations of rates of use are impacted by changes in the Canadian MFN rates through multilateral trade liberalization under the Uruguay Round of Negotiations as well as Canadian unilateral trade liberalization announced under Budget 2010 and Budget 2011. Both liberalizations reduced the number of dutiable tariff lines. Nonetheless, the utilization of NAFTA preferences is clearly characterized by an increasing trend.
Noteworthy is the proportion of duty-free imports that continued to declare NAFTA preferential treatment: Figure 2 shows that about 30 percent of duty-free products had declared NAFTA preferential treatment in 1994 while this figure declined to 20 percent in 2016. This puzzling phenomenon requires further investigation as there is no difference between MFN and NAFTA tariff rates for these products. A possible explanation is that importers might have been unfamiliar with the declaration process itself.
Similarly, even for products that are dutiable on an MFN basis, and for which NAFTA provides preferential treatment, a substantial proportion of Canada’s imports from the United States still occur on an MFN basis. The likely reasons for this are two-fold; first, some goods may not be eligible for duty-free treatment under NAFTA because they do not meet the applicable product-specific rule of origin. Second, in the face of low MFN tariff rates, importers may prefer to claim MFN treatment over NAFTA, as it is easier and more cost-effective to demonstrate compliance. Footnote m2-4
At the product level, NAFTA utilization rates vary significantly. Footnote m2-5 In 1994, the utilization rates ranged from 11.5 percent in the motor vehicles and parts sector to over 99 percent in the products of animal origin sector. Similarly, in 2016, they ranged from 11 percent for nickel to almost 100 percent for meat and meat offal. Over the last two decades, the utilization rates of some products increased markedly (see Table 1). Tables 1 and 2 present the Canadian products for which NAFTA utilization rates varied the most. The motor vehicles and parts sector (representing 21 percent of total imports from the United States in 2016), experienced the largest utilization increase; growing over 60 percentage points from only 11.5 percent in 1994 (see Figure 3). The low utilization rate in 1994 for Canadian imports of certain motor vehicles and parts is likely due to the use of preferential tariff treatment under the Auto Pact Footnote m2-6 (1965) rather than NAFTA. Under the Auto Pact, Canada eliminated its tariffs on motor vehicles and parts imported from the United States by automotive companies that made vehicles in Canada, provided certain conditions were met. Whereas, under NAFTA, Canadian tariffs on originating motor vehicles and parts were not fully eliminated until 1998. As such, claiming duty-free treatment under the Auto Pact was therefore preferable until tariffs were fully eliminated. By 2001, Canada repealed the provisions under the Auto Pact that provided duty-free treatment for imports from the United States. Footnote m2-7 As imports could no longer enter under the Auto Pact, the use of NAFTA for motor vehicles and auto parts likely increased considerably as a result as illustrated in Figure 3.
| Utilization Rate | |||
|---|---|---|---|
| Product Sector | 1994 (%) | 2016 (%) | Percentage Point Change (%) |
| 75 Nickel and Articles | 72.3 | 11.2 | 63.9 |
| 37 Photographic Goods | 52.9 | 94.6 | 41.7 |
| 61 Articles of Apparel, Knitted | 56.9 | 97.8 | 41.0 |
| 42 Articles of Leather | 81.2 | 99.0 | 17.9 |
| 63 Other Made up Textiles | 57.7 | 73.0 | 15.2 |
Following motor vehicles and parts, the products with the next largest increases in utilization rates are nuclear reactors and machinery, trees and plants, edible products of animal origin and optical instruments. These products combined with motor vehicles and parts accounted for over 60 percent of all dutiable imports from the United States in 2016. On the other hand, nickel and articles thereof and apparel product sectors displayed the largest utilization rate decreases. In fact, dutiable imports from these sectors accounted for less than 1 percent of all dutiable imports from the United States in 2016.
Figure 3
NAFTA Utilization Rates for Canadian Imports from the U.S. in the Sector of Motor Vehicle and Parts (1994 – 2016)

Source: Statistics Canada
Figure 3 Text Alternative
| Years | Percent |
|---|---|
| 1994 | 11.55 |
| 1995 | 12.94 |
| 1996 | 13.08 |
| 1997 | 16.04 |
| 1998 | 18.48 |
| 1999 | 18.62 |
| 2000 | 18.56 |
| 2001 | 39.69 |
| 2002 | 56.97 |
| 2003 | 59.22 |
| 2004 | 58.42 |
| 2005 | 62.22 |
| 2006 | 65.13 |
| 2007 | 65.77 |
| 2008 | 66.80 |
| 2009 | 69.45 |
| 2010 | 70.10 |
| 2011 | 70.31 |
| 2012 | 70.69 |
| 2013 | 73.55 |
| 2014 | 76.03 |
| 2015 | 75.56 |
| 2016 | 75.40 |
| Utilization Rate | |||
|---|---|---|---|
| Product Sector | 1994 (%) | 2016 (%) | Percentage Point Change (%) |
| 87 Motor Vehicle and Parts | 11.5 | 75.4 | -61.0 |
| 84 Nuclear Reactors and Machinery | 85.4 | 37.2 | - 48.2 |
| 6 Trees and Plants | 93.7 | 63.0 | -30.7 |
| 4 Edible Products of Animal Origin | 81.0 | 51.2 | -29.9 |
| 90 Optical Instruments | 91.4 | 62.8 | -28.6 |
Conclusion
Over time, FTAs have increasingly become a tool for countries to foster strong trade relations. Globally, there has been a consensus that, overall, FTAs benefit all participating countries. The 2015 Thomson Reuters survey, however, provided a less optimistic view of FTAs as they were perceived as underutilized.
The analysis provided here offers a different perspective, arguing that the utilization rates of NAFTA preferences actually increased over time. This suggests that the process of fully utilizing any FTA preferences may take time, thus that there is an adaptation period.
Trade theory demonstrates that FTAs can foster stronger trade relations and provide firms with lower cost imported products as a means to profit from these agreements. Raising awareness and educating the public about the benefits is therefore crucial. From NAFTA to recent FTAs such as the Canada-European Union Comprehensive Economic and Trade Agreement (CETA) and the Comprehensive and Progressive Agreement for Trans-Pacific Partnership (CPTPP), the Canadian government has embarked on a systematic approach to promote the benefits of FTAs both before and after their implementation. The results from this study are concrete examples that ascertain this approach is successful in making firms aware of the benefits of FTAs.
4. Canada’s International Transactions


Canada’s International Transactions
Infographic 4.1 Text Alternative
| Value ($B) | |
|---|---|
| Current Balance | -63.9 |
| Goods | -23.9 |
| Services | -25.1 |
| Income | -14.9 |
Canada's Principal Movements in Account Balance, 2017
Within the current account, two principal movements were of interest.
1. On the goods trade side, there was a considerable $2.0-billion narrowing of the deficit in goods trade, mainly caused by the upward movement in prices for energy exports and a reduction in import volumes.
2. On the Services side, the trade deficit increased by $1.8 billion. The travel deficit, the principal item on the balance, was the principal contributor, but high imports of transportation services and a sharp reduction in financial services were a big factors also. Lastly, exports of financial
Infographic 4.2 Text Alternative
| 2014 | 2016 | 2017 | |
|---|---|---|---|
| Terms of Trade | 100.4 | 91.7 | 94.3 |
Canada's terms of trade index tracks the combined relative prices of Canada's exports and imports. It is measured relative to 2007, when its value was set at 100; values for 2014, 2016 and 2017 are given above. Values below 100 indicate that Canada's exports are worth comparatively less than its imports, and vice versa.
Infographic 4.3 Text Alternative
| Exports ($B) | Imports($B) | Balance ($B) | |
|---|---|---|---|
| Travel | 26.4 | 41.5 | -15.2 |
| Transportation | 17.0 | 28.2 | -11.2 |
| Commercial | 67.8 | 66.9 | 0.9 |
| Government | 1.6 | 1.2 | 0.4 |
After two years of sliding commodity prices, with consequent reductions in value of Canada’s resource-based exports, 2017 was the year of a rebound. Overall prices of Canada’s goods exports rose by 4.4 percent, with most of the impact occurring in the energy sector, where prices soared 22.7 percent from 2016 levels. At the same time, the price index of Canada’s imports grew only 1.1 percent. The result was a very substantial improvement in Canada’s overall terms of trade index, which rose from 91.6 in 2016 (its lowest value since 2007) to 94.3 in 2017 (2007 level = 100). This index level is still the third-lowest in the past 11 years and just below the 2009 terms of trade.
The value of both exports and imports of goods increased moderately in 2017. While the price increases strongly supported nominal exports, real exports grew as well (though at a smaller rate), while growth in nominal imports was predominantly due to growth in real imports. The recovery in energy prices strengthened the Canadian dollar and spurred the adjustment process in Canada’s trade in the opposite direction to the one followed in 2015 and 2016. In 2017, exports of resources and resource-based goods soared, supported by volume and price expansion (particularly energy products; metal ores and minerals; and metal and mineral products), while the relatively more expensive manufactured exports were rolled back in both volumes and prices (particularly motor vehicles and consumer goods). Meanwhile, relatively less expensive manufactured imports experienced large volume gains (particularly electronic and electrical equipment, and aircraft and other transport equipment).
The recovery in energy prices strengthened the Canadian dollar and spurred a moderate increase in exports
While these developments narrowed Canada’s trade deficit in goods, that narrowing was almost entirely offset by the widening of the deficit in services. Both exports and imports of services continued to expand strongly during the year, but imports were larger and grew faster. Canada’s expanding aggregate services trade deficit is principally due to two causes that have nothing to do with trade policy: travel and transportation services. Canadians spend much more abroad than do visitors to Canada, and Canadian overseas trade is carried in foreign ships (both for exports and imports). Commercial services, on the other hand, have now run a surplus for 15 years, starting in 2003 and continuing throughout the Great Recession. More detail on the structure of Canada’s services trade is provided in the special feature.
As a result of these and other developments on the income accounts, Canada’s current account deficit narrowed somewhat, declining from $65.4 billion in 2016 to $63.9 billion in 2017.
The Balance of Payments
The summary of Canada’s international transactions is recorded in its Balance of Payments (BoP) accounts. BoP entries track all the exchanges and transfers of economic value between Canadian residents and nonresidents, viewed from the Canadian perspective. The BoP accounts consist of two main sections: the financial account and the current account. Transactions that involve financial assets are recorded in the financial account;Footnote 4-1 these include direct investment assets and liabilities, portfolio investments, official reserves and other investments such as loans, currency and deposits.
Transactions that involve movements of goods and services, investment income or transfers are recorded in the current account. The values of exports of goods and services are recorded as receipts in the current account. The values of imports of goods and services are recorded as payments. When receipts and payments do not match, the result is a trade account imbalance – a trade surplus if receipts exceed payments, and a trade deficit otherwise.
The Current Account
Canada’s current account balance – a net measure of the flow of goods, services, income, and transfers – recorded a deficit of $63.9 billion in 2017. This represented a $1.4-billion narrowing from the $65.4-billion deficit of 2016 and was not far from the 2013 deficit level of $61.1 billion. In the intervening period, Canada’s current account deficit narrowed considerably in 2014, widened in 2015 and moderated again in 2016.
Most of those movements were due to a combination of the changes in energy prices and the Canadian dollar exchange rate (mostly versus the U.S. dollar). Expressed as a share of GDP, the 2017 deficit amounted to 3.0 percent. This is down from 3.2 percent of GDP in both 2013 and 2016, the smallest proportion since 2014, when it amounted to just 2.4 percent of GDP due to favourable terms of trade.
It could be argued that the data in the past few years imply that Canada’s current account deficit has largely stabilized. However, this stability may be illusory. The current account balance depends on a great number of variables outside Canada’s control, and in these volatile times there are good reasons to expect at least some of these to change rapidly. Neither should deficit be regarded as a weakness. Since the BoP accounts are connected, running a deficit on the current account implies relatively more Canadian assets are being sold to foreigners, who are purchasing them as a form of investment. If Canadian assets are relatively more attractive (in terms of their perceived safety, stability, and potential), they can only be acquired through shifting the financial account into surplus and thus creating a deficit on the current account; it is difficult to determine which of the two motives is primary as they represent two sides of the same transaction.
Within the current account, two principal movements were of interest. On the trade side, there was a considerable $2.0-billion narrowing of the deficit in goods trade, as growth in goods exports was faster than growth in goods imports. That, in turn, was mainly caused by the upward movement in prices for energy exports, which rose 22.7 percent overall compared to the previous year. Although a similar increase took place in prices for energy imports (up 22.3 percent), a reduction in import volumes mitigated that increase; furthermore, the value of Canada’s energy imports is considerably smaller than that of its energy exports.
Figure 4-1
Canada’s Current Account Balance and Components, 2013-2017

Source: Statistics Canada, CANSIM Table 380-0064
Figure 4-1 Text Alternative
| Current account and capital account | 2013 | 2014 | 2015 | 2016 | 2017 |
|---|---|---|---|---|---|
| Total current account | -61.12 | -47.78 | -71.53 | -65.37 | -63.93 |
| Goods | -8.15 | 4.67 | -23.74 | -25.87 | -23.89 |
| Services (2) | -23.10 | -24.26 | -25.57 | -23.31 | -25.09 |
| Total Income | -29.88 | -28.20 | -22.22 | -16.19 | -14.95 |
The dynamics of the goods balance can be traced directly to the fluctuations in Canada’s terms of trade index. From 100.4 in 2014 (roughly equal to 2007 level of 100), that index dropped to 93.4 in 2015 and further declined to 91.6 percent in 2016. A two-year decline of 8.8 percentage points is drastic; it approaches the severity of the 9.6-percentage points plunge during 2009 (the start of the Great Recession) when resource prices collapsed. The terms of trade index rebounded somewhat in 2017 to 94.3, but will not necessarily trend upward much further. Canada’s trade structure must adjust to the new terms of trade in conditions of uncertainty, with their dampening impacts on investment and growth.
The terms of trade index, after a drastic two-year decline of 8.8 percentage points, rebounded to 94.3, but may not trend upward much further
The narrowing of the goods trade deficit described above was almost negated by the widening of the services trade deficit, which increased $1.8 billion. The travel deficit, the principal item on the balance, was the principal contributor, and high imports of transportation services were a big factor also. Lastly, exports of financial services declined sharply, offsetting most of the other growth in commercial service exports and preventing this area of strength for Canada from retrieving the balance.Footnote 4-2 Thus the combined goods and services deficit narrowed only by $0.2 billion to $49.0 billion.
| 2016 | 2017 | |
|---|---|---|
| Current account and capital account balance | -65,372 | -63,929 |
| Goods | -25,871 | -23,894 |
| Services | -23,313 | -25,089 |
| Primary income | -12,677 | -12,175 |
| Secondary income | -3,511 | -2,771 |
| Capital account | -91 | -76 |
| Financial account balance | -68,194 | -56,464 |
| Net acquisition of financial assets | 198,714 | 223,924 |
| Canadian direct investment assets | 93,850 | 102,272 |
| Canadian portfolio investment | 13,792 | 84,658 |
| Official international reserves | 7,481 | 1,053 |
| Other Canadian investment | 83,591 | 35,940 |
| Net incurrence of liabilities | 266,909 | 280,388 |
| Foreign direct investment liabilities | 45,793 | 33,824 |
| Foreign portfolio investment | 171,766 | 188,523 |
| Other foreign investment | 49,350 | 58,040 |
| Discrepancy (net errors and omissions) | -2,731 | 7,541 |
| BALANCE OF PAYMENTS | 0 | 0 |
Source: Statistics Canada, CANSIM Tables 376-0101 and 376-0102
Meanwhile, the other large movement occurred on the income side of the current account balance (which includes investment income, compensation of employees and transfers). Due to a 25.9-percent increase in the direct investment income receipts of Canadians from abroad, the direct investment income balance improved by $4.6 billion. This was mitigated by the opposite movement from the portfolio investment income balance, which worsened by $3.4 billion, and a $0.8-billion worsening in the other investment income balance. As a result, the combined effect on the primary income balance was a $0.5-billion improvement. The secondary income balance improved by $0.7 billion due to a large increase in government transfers receipts.
The Financial Account
Canada’s financial account describes the balance between the transactions involving the acquisition and disposition of Canadian assets abroad, on one side, and foreign acquisition and disposition of assets in Canada, on the other. The sum of the former (i.e. transactions involving the acquisition and disposition of Canadian assets abroad) is termed net acquisition of financial assets, while the sum of the latter is labelled net incurrence of liabilities. The financial account balance, which is the sum of these two, represents the balance of all transactions involving financial assets and is referred to as “net borrowing” (or lending).
In Canada’s financial account, net borrowing of Canadians declined substantially, from $68.2 billion in 2016 down to $56.5 billion in 2017. This narrowing of $11.7 billion came about as a result of much faster growth in the net acquisition of financial assets (up $25.2 billion) than in the net incurrence of liabilities (up $13.5 billion). The principal factor in the 12.7-percent growth of net acquisitions was Canadian portfolio investment, which jumped fivefold in 2017 to hit $84.7 billion. Most of that growth was in the form of transfers from other Canadian investment (loans, currency and deposits etc.), but there was enough new growth to generate a substantial net increase. It is important to note that these processes were largely the result of a shift from less profitable to more profitable activities, whereas in 2016 a massive movement in the opposite direction took place (i.e. these financial assets stayed abroad while switching between investments). Net acquisitions of direct investment assets grew moderately, while official international reserves declined to just one-seventh of their 2016 level.
Canadian portfolio investment jumped fivefold, reaching $84.7 billion, largely as a result of transfers from other Canadian investments
Growth in net incurrence of liabilities, i.e. Canadian financial assets acquired by foreigners, was also principally in the area of foreign portfolio investment, which rose by $16.8 billion to $188.5 billion (among its components, Canadian bonds did well, rising $32.5 billion, and Canadian debt securities gained $13.6 billion). Meanwhile, net incurrence of foreign direct investment liabilities (i.e. net inflows of foreign FDI) declined by over a quarter in 2017.
There was also a large statistical discrepancy ($7.5 billion), which balanced the net borrowing on the financial account with the balance of receipts and payments on the current account. This discrepancy, which represents net errors and omissions, indicates that there may be significant adjustments to the quoted figures with the passage of time, particularly those in the financial account.
Goods Exports
Canada’s exports of goods on a BoP basis soared $28.0 billion in 2017 (up 5.4 percent) to $549.5 billion, with growth in 7 of 11 sectors and declines in the other 4. This put an end to the run of two consecutive decreases in goods exports in 2015 and 2016. As in those previous years, this movement was due largely to the change in export prices, which were up 4.4 percent during 2017, and was aided by the 1.0-percent expansion in volumes.
Canada’s exports of goods on a balance of payments basis soared $28.0 billion (up 5.4 percent) to $549.5 billion, with growth in 7 of 11 sectors
Resource prices, which were on the decline in the previous years, have now reversed direction, led by the energy products’ export prices, which rose 22.7 percent on the year. Prices of exported metal ores and minerals rose 4.2 percent, while export prices of metal and mineral products grew at over twice that pace (up 8.6 percent). Price growth extended to chemicals, plastics and rubber as well as forestry and building sectors. Meanwhile, the agri-food sector prices continued to stagnate after healthy growth in 2015. Finally, export prices in all 5 non-resource-based goods sectors declined marginally. Export volumes rose in 5 out of 11 sectors (notably energy, metal ores and minerals, and industrial machinery and equipment) and fell in the other 6 sectors (notably aircraft and other transport equipment, and motor vehicles).
| Products | Value of Exports ($B) | Change, Values (%) | Change, Volumes (%) | Change, Prices (%) |
|---|---|---|---|---|
| Total, all sectors | 549,511 | 5.4 | 1.0 | 4.4 |
| Agri-food & fish | 33,167 | 4.3 | 3.7 | 0.6 |
| Energy | 95,104 | 32.8 | 8.2 | 22.7 |
| Metal ores & minerals | 18,287 | 12.1 | 7.6 | 4.2 |
| Metal & mineral products | 63,704 | 10.9 | 2.1 | 8.6 |
| Chemicals, plastics & rubber | 34,861 | 3.3 | -1.8 | 5.3 |
| Forestry, building & packaging | 42,805 | 3.9 | -2.3 | 6.3 |
| Industrial machinery & equipment | 34,591 | 6.8 | 7.2 | -0.4 |
| Electronic & electrical equipment | 27,497 | -0.9 | -0.2 | -0.7 |
| Motor vehicles | 92,820 | -5.3 | -3.8 | -1.6 |
| Aircraft & other transport equipment | 21,923 | -4.8 | -4.6 | -0.3 |
| Consumer goods | 69,888 | -5.3 | -3.4 | -2.0 |
| By Region | ||||
| U.S. | 411,120 | 4.8 | ||
| EU | 43,450 | 3.7 | ||
| Japan | 12,163 | 10.5 | ||
| China | 24,941 | 11.5 | ||
| India | 4,445 | 9.3 | ||
| Mexico | 9,170 | 3.3 | ||
| South Korea | 5,471 | 17.5 | ||
| Rest of World | 38,751 | 6.9 |
Source: Statistics Canada, CANSIM Tables 376-0101, 376-0110 and 380-0070
The combination of a large price increase and a substantial volume growth boosted exports of energy products 32.8 percent to $95.1 billion. A similarly structured increase of about one-third the magnitude propelled exports of metal and mineral products to 10.9-percent growth, while the 12.1-percent rise in exports of metal ores and minerals was predominantly indebted to the 7.6-percent increase in export volumes. A comparable increase in export volumes of industrial machinery and equipment dominated a marginal price reduction to boost export values of those products by 6.8 percent.
Exports in the rest of the non-resource-based goods sectors were dragged down largely by the volume reductions rather than by price decreases (with the exception of exports of electronic and electrical equipment, where prices played the main role in the declines, which were all small).
Exports of motor vehicles and consumer goods both declined by 5.3 percent in 2017. These developments put an end to three years of notable export growth for Canada’s non-resource-based (or “advanced manufacturing”) sectors. In 2015 and 2016, growth in those areas was supported by export price increases (with the exception of aircraft and other transport equipment, where growth fell in spite of those increases).
Largely due to an increase in their relative prices, export growth for Canada’s non-resource-based goods has come to an end after three years
Regionally, exports to all large trading partners increased, with exports to the United States growing 4.8 percent, marginally slower than the overall growth of 5.4 percent. Consequently, the share of goods exports destined for the United States declined from 75.2 percent in 2016 to 74.8 percent in 2017. Exports to the EU rose 3.7 percent, and exports to Japan were up 10.5 percent. Exports to Switzerland soared (up 53.0 percent), as did those to Norway, Algeria and Indonesia. Exports to China increased 11.5 percent, exports to India went up 9.3 percent and exports to South Korea rose 17.5 percent.
Goods Imports
Canada’s imports of goods on a BoP basis rose $26.1 billion in 2017, up 4.8 percent over their 2016 total. Total imports were up to $573.4 billion, with increases occurring in 9 out of 11 sectors. Overall growth in import prices was positive but minimal, at 1.1 percent, with prices actually falling in 6 out of 11 sectors. Among the 5 sectors where import prices increased, energy prices led the way with a 22.3-percent hike, while price growth in other sectors was substantially more modest. Import volumes rose in 8 out of 11 sectors and dropped in the other 3, including the energy sector.
Imports of consumer goods, the largest import category, grew 3.3 percent in 2017 (up $4.0 billion). This growth was driven by volume growth of 4.0 percent, while import prices decreased 0.6 percent. The second-largest import sector, motor vehicles, grew by 4.9 percent (up $5.2 billion) on volume growth of 7.2 percent, in spite of the 2.2-percent fall in prices. Imports of metal ores and minerals showed the largest proportional increase, growing 19.4 percent, as strong volume growth of 12.6 percent was complemented by a 6.0-percent increase in price. On the other hand, imports of metal and mineral products went down 1.3 percent, mostly on volume decline of 3.9 percent, moderated by the 2.8-percent hike in import price. Imports of energy products were up 16.4 percent, as the price jump of 22.3 percent was partly offset by a 4.8-percent reduction in import volume.
Goods imports from the United States expanded only by 2.9 percent, reducing the share of goods imports from Canada’s main trading partner to 64.6 percent
Imports from all key destinations increased, with the exception of South Korea, where the fall in imports was due to a one-time event in 2016. Japan led the way in relative growth of imports, up 15.1 percent; growth in imports from China and Mexico was not far behind at 13.3 percent and 12.4 percent, respectively. Imports from the EU grew very robustly at 7.9 percent, while imports from the United States expanded only by 2.9 percent, further reducing the share of goods imports from Canada’s main trading partner to 64.6 percent. Other import suppliers in the rest of the world increased their shipments to Canada by 6.7 percent in 2017 – significantly faster growth than in the previous two years.
| Products | Value of Exports ($B) | Change, Values (%) | Change, Volumes (%) | Change, Prices (%) |
|---|---|---|---|---|
| Total, all sectors | 573,405 | 4.8 | 3.6 | 1.1 |
| Agri-food & fish | 17,064 | -0.1 | 0.4 | -0.5 |
| Energy | 31,879 | 16.4 | -4.8 | 22.3 |
| Metal ores & minerals | 12,820 | 19.4 | 12.6 | 6.0 |
| Metal & mineral products | 44,030 | -1.3 | -3.9 | 2.8 |
| Chemicals, plastics & rubber | 47,550 | 7.1 | -2.1 | 9.4 |
| Forestry, building & packaging | 24,759 | 3.7 | 3.6 | 0.2 |
| Industrial machinery & equipment | 54,182 | 2.1 | 3.2 | -1.1 |
| Electronic & electrical equipment | 65,954 | 4.5 | 12.1 | -6.8 |
| Motor vehicles | 111,850 | 4.9 | 7.2 | -2.2 |
| Aircraft & other transport equipment | 20,835 | 10.6 | 10.8 | -0.2 |
| Consumer goods | 123,422 | 3.3 | 4.0 | -0.6 |
| By Region | ||||
| U.S. | 370,624 | 2.9 | ||
| EU | 56,604 | 7.9 | ||
| Japan | 13,548 | 15.1 | ||
| China | 42,614 | 13.3 | ||
| India | 3,035 | 2.7 | ||
| Mexico | 21,260 | 12.4 | ||
| South Korea | 7,375 | -17.6 | ||
| Rest of World | 58,345 | 6.7 |
Source: Statistics Canada, CANSIM Tables 376-0101, 376-0110 and 380-0070
Trade in Services
In 2017, Canada’s services exports increased for the eighth consecutive year, rising by $3.9 billion to reach an all-time high of $112.8 billion, which was an increase of 3.6 percent over 2016. Meanwhile, services imports rose by $5.7 billion (up 4.3 percent). As a consequence of those movements, Canada’s deficit in services trade widened by $1.8 billion, reaching $25.1 billion. Canada continued to run a services trade deficit with every broad region, over half of which was with the United States.
Canada continued to run a services trade deficit with every broad region, over half of the total being with the United States
Travel exports, which represent the purchase of goods and services for own use or as gifts by foreign travellers in Canada, were again the most rapidly growing area of services exports. From $23.9 billion in 2016, travel exports expanded 10.3 percent to reach $26.4 billion in 2017 (up $2.5 billion). Personal travel accounted for 85.5 percent of total travel exports and saw a $2.1-billion increase, but business travel grew at a slightly higher rate of 11.0 percent (vs. 10.2-percent growth for personal travel). This growth in travel exports abated somewhat from 2016, but still remains the key source of growth in services exports and was likely influenced by the relatively low value of the Canadian dollar.
Exports of transportation services grew at a more moderate rate of 5.9 percent, somewhat faster than in 2016, adding $0.9 billion to their total value and reaching $17.0 billion. The fastest relative growth occurred in the exports of water transportation services (up 9.5 percent) after two years of declines, but growth in air transportation services contributed more in absolute value with a $0.4-billion increase (up 5.7 percent). Growth in land and other transportation services exports was 4.1 percent.
Commercial services exports, the crucial component accounting for just over 60 percent of the total services exports, grew marginally at 0.7 percent in 2017, much slower than other services categories. Exports increased $0.5 billion to reach $67.8 billion. The primary cause for this slow growth was a considerable reduction of $0.8 billion in exports of financial services (down 7.8 percent); the only other sub-sector whose exports declined was maintenance and repair services (down 5.6 percent). Exports increased in the other eight sub-sectors, notably in insurance services (up 7.2 percent), charges for the use of intellectual property (up 4.8 percent) and in technical, trade-related and other business services (up 4.1 percent). The last-mentioned sub-sector exhibited the largest absolute increase among all, growing its exports by $0.6 billion.
On the import side of services trade, travel imports (or spending by Canadians while abroad) have likewise been the key growth item in 2017. Growth was 8.9 percent (up $3.4 billion) to reach $41.5 billion. Transportation service imports grew briskly as well at 6.3 percent (up $1.7 billion). Imports of air transportation services led the way with 7.7-percent growth and water transportation services were not far behind with a 6.5-percent increase.
| 2016 | 2017 | % change | |
|---|---|---|---|
| Total, all services | 108,885 | 112,785 | 3.6 |
| Travel | 23,886 | 26,352 | 10.3 |
| Business travel | 3,260 | 3,617 | 11.0 |
| Personal travel | 20,627 | 22,736 | 10.2 |
| Transportation | 16,067 | 17,012 | 5.9 |
| Water transport | 3,135 | 3,432 | 9.5 |
| Air transport | 7,298 | 7,714 | 5.7 |
| Land and other transport | 5,635 | 5,867 | 4.1 |
| Commercial services | 67,366 | 67,848 | 0.7 |
| Maintenance and repair services | 2,099 | 1,981 | -5.6 |
| Construction services | 697 | 700 | 0.4 |
| Insurance services | 1,738 | 1,863 | 7.2 |
| Financial services | 10,813 | 9,972 | -7.8 |
| Telecommunications, computer, and information services | 9,787 | 10,131 | 3.5 |
| Charges for the use of intellectual property | 5,574 | 5,842 | 4.8 |
| Professional and management consulting services | 14,575 | 14,684 | 0.7 |
| Research and development services | 5,532 | 5,541 | 0.2 |
| Technical, trade-related, and other business services | 13,850 | 14,423 | 4.1 |
| Personal, cultural, and recreational services | 2,699 | 2,709 | 0.4 |
| Government services | 1,566 | 1,571 | 0.3 |
Source: Statistics Canada, CANSIM Table 376-0108
Like exports, imports of commercial services were largely stagnant. A 0.9-percent increase added $0.6 billion to their value, which reached $66.9 billion. Several smaller sub-sectors showed declines in imports during 2017, in particular maintenance and repair services (down 16.0 percent), research and development services (down 12.0 percent) and construction services (down 11.4 percent). However, the combined effect of these double-digit declines was only $0.4 billion, as the sub-sectors in question are not very large. On the other hand, some of the larger import sectors showed steady growth. Imports of financial services increased 5.2 percent, following up their rapid growth in the previous year, to reach $11.5 billion; professional and management consulting services imports rose 3.0 percent to reach $13.8 billion. Together, these two added $1.0 billion to Canada’s services imports. Highest relative growth of 8.3 percent was observed in personal, cultural, and recreational services (up $0.2 billion) – a second consecutive year of strong growth for this item. Charges for the use of intellectual property declined marginally in 2017, but remained the largest single import sub-sector, valued at $14.0 billion.
| 2016 | 2017 | % change | |
|---|---|---|---|
| Total, all services | 132,197 | 137,873 | 4.3 |
| Travel | 38,096 | 41,503 | 8.9 |
| Business travel | 4,736 | 5,164 | 9.0 |
| Personal travel | 33,360 | 36,338 | 8.9 |
| Transportation | 26,562 | 28,237 | 6.3 |
| Water transport | 11,843 | 12,616 | 6.5 |
| Air transport | 10,854 | 11,687 | 7.7 |
| Land and other transport | 3,863 | 3,933 | 1.8 |
| Commercial services | 66,346 | 66,925 | 0.9 |
| Maintenance and repair services | 1,123 | 943 | -16.0 |
| Construction services | 466 | 413 | -11.4 |
| Insurance services | 4,636 | 4,644 | 0.2 |
| Financial services | 10,946 | 11,518 | 5.2 |
| Telecommunications, computer, and information services | 6,486 | 6,499 | 0.2 |
| Charges for the use of intellectual property | 14,057 | 14,002 | -0.4 |
| Professional and management consulting services | 13,369 | 13,770 | 3.0 |
| Research and development services | 1,569 | 1,381 | -12.0 |
| Technical, trade-related, and other business services | 10,885 | 10,712 | -1.6 |
| Personal, cultural, and recreational services | 2,809 | 3,042 | 8.3 |
| Government services | 1,196 | 1,209 | 1.1 |
Source: Statistics Canada, CANSIM Table 376-0108
Canada’s surplus in commercial services has persisted for 15 years, but is narrowing due to the continued increases in imports of financial services and professional and management consulting services
Overall, exports of services grew slower than imports; combined with the greater value of the latter, this increased Canada’s deficit in services trade to $25.1 billion in 2017. Over three-fifths of that deficit ($15.2 billion) is due to the travel deficit, which widened by $0.9 billion during the year. The remainder of the services trade deficit can be traced to the large and growing deficits in water transportation services ($9.2 billion in 2017), which represents the international shipping industry services provided to Canada.Footnote 4-3
Commercial services, on the other hand, have now run a surplus for 15 years, starting in 2003 and throughout the Great Recession. However, this surplus has been declining for several years and it was razor-thin in 2017 at $0.9 billion. Continued increases in imports of financial services and professional and management consulting services were the chief influence on this trend. Some mitigation of the trend came from the growing surplus in technical, trade-related and other business services (widening by $0.7 billion to $3.7 billion) while the deficit in charges for the use of intellectual property improved again (narrowing by $0.3 billion to $8.2 billion) in 2017.
Figure 4-2 Canada's Travel Service Trade, 2017

Figure 4-2 Text Alternative
| 2017 | Exports | Imports | Balance |
|---|---|---|---|
| Total | 26.4 | 41.5 | -15.2 |
| United States | 10.2 | 22.1 | -11.9 |
| EU | 3.6 | 6.8 | -3.3 |
| Japan | 0.6 | 0.2 | 0.3 |
| ROW | 12.0 | 12.3 | -0.3 |
Source: Statistics Canada, CANSIM Table 376-0101
Trade in Services by Region
Canada’s trade in services with the United States was perfectly balanced in 2017, with 54.5 percent of its exports going to the United States and 54.5 percent of its imports arriving from there. Less than half of the overall increase in services exports in 2017 was due to exports to the United States (up $1.6 billion, or 2.7 percent). Imports from the United States grew at a comparable rate of 2.5 percent (up $1.8 billion). As a result, the services trade deficit with the United States expanded slightly (up $0.2 billion) to $13.7 billion. That deficit was overwhelmingly due to travel services, as Canadians travelling in the United States spent more than double what Americans travelling in Canada spent. This travel deficit with the United States reversed the recent trend of narrowing and widened by $1.0 billion in 2017 (up 9.1 percent).
| 2017 | Exports | % change | Imports | % change | Balance |
|---|---|---|---|---|---|
| Total | 112,785 | 3.6 | 137,873 | 4.3 | -25,089 |
| Travel | 26,352 | 10.3 | 41,503 | 8.9 | -15,151 |
| Transportation | 17,013 | 5.9 | 28,237 | 6.3 | -11,224 |
| Commercial | 67,849 | 0.7 | 66,925 | 0.9 | 924 |
| Government | 1,571 | 0.3 | 1,209 | 1.1 | 362 |
| United States | 61,462 | 2.7 | 75,201 | 2.5 | -13,739 |
| Travel | 10,219 | 6.3 | 22,075 | 7.8 | -11,856 |
| Transportation | 8,615 | 5.9 | 9,855 | 5.5 | -1,240 |
| Commercial | 42,229 | 1.3 | 42,846 | -0.6 | -617 |
| Government | 399 | -2.2 | 425 | 1.2 | -26 |
| EU | 17,933 | -0.9 | 25,241 | 6.8 | -7,308 |
| Travel | 3,550 | -0.6 | 6,848 | 12.9 | -3,298 |
| Transportation | 3,622 | 5.7 | 5,121 | 5.5 | -1,500 |
| Commercial | 10,527 | -3.2 | 12,996 | 4.4 | -2,469 |
| Government | 236 | 2.2 | 276 | 1.5 | -40 |
| Japan | 1,890 | -0.8 | 2,752 | 20.8 | -862 |
| Travel | 556 | 1.6 | 237 | 31.7 | 320 |
| Transportation | 540 | -0.7 | 901 | 21.1 | -361 |
| Commercial | 763 | -2.7 | 1,592 | 19.5 | -830 |
| Government | 31 | 3.3 | 21 | 0.0 | 10 |
| ROW | 31,500 | 8.4 | 34,680 | 5.4 | -3,181 |
| Travel | 12,027 | 18.5 | 12,344 | 8.6 | -317 |
| Transportation | 4,236 | 6.9 | 12,359 | 6.4 | -8,123 |
| Commercial | 14,331 | 2.1 | 9,491 | 0.6 | 4,840 |
| Government | 906 | 0.9 | 486 | 0.8 | 419 |
Source: Statistics Canada, CANSIM Table 376-0101
Transportation services showed a small deficit while trade in commercial services (over half of all transactions) was close to balanced with a $0.6-billion deficit on the Canadian side.
In services trade with the EU, exports declined marginally (down 0.9 percent) while imports grew substantially (up 6.8 percent). This was mostly due to higher imports from the United Kingdom (up 18.6 percent, driven by the 27.6-percent increase in imports of commercial services from that country). The role of the Brexit process in these developments is worth considering. Travel and particularly commercial exports to the EU declined, while on the import side travel was the strongest-growing item at 12.9 percent. These movements increased Canada’s services trade deficit with the EU by $1.8 billion, all due to a much wider deficit with the United Kingdom.
Canada’s services trade deficit with the EU increased by $1.8 billion due to higher imports from the United Kingdom (up 18.6 percent, chiefly driven by an increase in commercial services)
Japan is among the few locales where Canada has a consistent surplus on the travel account. However, travel imports expanded by nearly one-third in 2017 while travel exports were steady. Similarly, exports of transportation and commercial services showed small declines while imports increased considerably. This considerably widened the services trade deficit with Japan, from $0.4 billion in 2016 to $0.9 billion in 2017.
Services trade with the rest of the world (ROW) is the most travel-intensive, with travel accounting for more than a third of both exports and imports. Exports of travel services to ROW soared once again, up 18.5 percent in 2017, reaching $12.0 billion; imports growth was about half of that at 8.6 percent, and as a consequence the travel services trade with ROW became roughly balanced. Notably, growth in travel exports to non-OECD destinations in ROW was the highest of all at 20.3 percent. This growth in travel services provided could indicate a further strengthening in education, immigration and business travel to Canada from those countries.
The surplus in commercial services with ROW increased to $4.8 billion as exports increased 2.1 percent while imports grew just 0.6 percent. Exports and imports of transportation services grew by 6.9 percent and 6.4 percent, respectively; however, the vast preponderance of the latter over the former (driving the overall deficit with this region due to the role of transoceanic shipping) meant that the deficit in this category increased further to $8.1 billion. Overall, the services trade deficit with ROW narrowed from $3.9 billion in 2016 to $3.2 billion in 2017.
On a country basis, other than the increase of $1.6 billion to the United States, services exports increased notably to China (up $0.4 billion) and Hong Kong (up $0.3 billion), while services exports to India and Switzerland grew by $0.1 billion each and services exports to the United Kingdom fell by $0.4 billion. Services imports from the United States grew by $1.8 billion, followed closely by the $1.3-billion increase in imports from the United Kingdom. Other notable changes were increases in imports from Japan (up $0.5 billion), Hong Kong (up $0.3 billion), and China and Mexico (up $0.2 billion each).
5. Key Developments in Canadian Merchandise Trade in 2017


Infographic 5.1 Text Alternative
| Value ($B) | Growth | |
|---|---|---|
| Exports | 546.7 | +5.7% |
| Imports | 561.1 | +5.2% |
| Balance | -14.4 | +$1.7 B |
Infographic 5.2 Text Alternative
| Products | Merchandise Exports ($B) | Share (%) | Products | Merchandise Imports ($B) | Share (%) |
|---|---|---|---|---|---|
| Energy | 109.8 | 20.1 | Automotive Products | 96.2 | 17.1 |
| Automotive Products | 81.0 | 14.8 | Mechanical Machinery & Equipment | 82.3 | 14.7 |
| Mechanical Machinery & Equipment | 42.0 | 7.7 | Electrical Machinery & Equipment | 55.5 | 9.9 |
| Precious Stones & Metals | 24.4 | 4.5 | Energy | 38.6 | 6.9 |
| Wood & Articles | 18.3 | 3.3 | Plastics & Articles | 20.8 | 3.7 |
| Electrical Machinery & Equipment | 16.8 | 3.1 | Scientific & Technical Instruments | 16.0 | 2.8 |
| Plastics & Articles | 16.3 | 3.0 | Pharmaceuticals | 15.2 | 2.7 |
| Aluminum & Articles | 12.7 | 2.3 | Articles of Iron & Steel | 12.7 | 2.3 |
| Aircraft | 12.6 | 2.3 | Precious Stones & Metals | 12.6 | 2.3 |
| Oil Seeds | 10.2 | 1.9 | Furniture | 12.0 | 2.1 |
Infographic 5.3 Text Alternative
| Exports | Imports | ||||||
|---|---|---|---|---|---|---|---|
| Countries | Value ($B) | Share (%) | Rank | United States | Value ($B) | Share (%) | Rank |
| United States | 414.9 | 76.0 | 1 | Unites States | 288.0 | 51.3 | 1 |
| China | 23.6 | 4.3 | 2 | China | 70.9 | 12.6 | 2 |
| United Kingdom | 17.6 | 3.2 | 3 | Mexico | 35.5 | 6.3 | 3 |
| Japan | 11.8 | 2.2 | 4 | Germany | 17.9 | 3.2 | 4 |
| Mexico | 7.8 | 1.4 | 5 | Japan | 17.5 | 3.1 | 5 |
| South Korea | 5.2 | 1.0 | 6 | United Kingdom | 8.9 | 1.6 | 6 |
| India | 4.2 | 0.8 | 7 | South Korea | 8.7 | 1.6 | 7 |
| Germany | 4.1 | 0.8 | 8 | Italy | 8.2 | 1.5 | 8 |
| Belgium | 3.5 | 0.6 | 9 | France | 6.2 | 1.1 | 9 |
| France | 3.4 | 0.6 | 10 | Taiwan | 5.4 | 1.0 | 10 |
Infographic 5.4 Text Alternative
| 2016 | 2017 | Change | ||
|---|---|---|---|---|
| Top 10 Exports Destinations | 90.87% | 90.84% | 0.03% | No substantive change in diversification |
| Top 10 Imports Sources | 83.69% | 83.28% | 0.41% | Increase in Diversification |
The earlier chapters discussed the global economic situation and Canada’s economic performance in this context. They also presented a general view of Canada’s international trade and its contribution to Canada’s economic growth in 2017. The present chapter takes a closer look at the detailed developments in Canada’s merchandise trade over the course of last year. The use of Customs data on merchandise trade – as opposed to the Balance of Payments (BOP)Footnote 5-1 data used in Chapter Four – allows for a more detailed analysis of the trade statistics: by partner country, by commodity, and by province/territory of origin.
Canadian merchandise exports increased to record levels in 2017 after two consecutive years of declines. The 5.6-percent yearly growth saw exports reach $546.3 billion, a $29.2-billion increase from the 2016 level. Merchandise exports rose 20.0 percent in the five years since 2012, growing at a compound annual rate of 3.7 percent between 2012 and 2017. Canadian merchandise imports grew at a rate of 5.2 percent in 2017, rising by $27.8 billion to $561.0 billion. Imports recorded an overall growth of 21.4 percent since 2012, and a compound annual growth of 4.0 percent between 2012 and 2017. As exports grew more than imports, Canada’s merchandise trade deficit narrowed by $1.3 billion in 2017, down to $14.7 billion. Canada’s trade balance improved significantly with the United States (up $10.7 billion), South Korea (up $2.7 billion, one-time effect) and Algeria (up $1.2 billion). Conversely, the trade balance worsened significantly with China (down $3.9 billion to $47.3 billion), Mexico (down $2.1 billion), Brazil and Azerbaijan (each down $1.2 billion).
Figure 5-1
Merchandise Trade by Major Partners, 2016

Figure 5-1 Text Alternative
Merchandise Trade by Major Partners, 2017
| Exports by Destination | |
|---|---|
| United States | $414,927 |
| China | $23,602 |
| United Kingdom | $17,635 |
| Japan | $11,820 |
| Mexico | $7,845 |
| ROW | $70,465 |
| Imports by Source | |
| United States | $287,992 |
| China | $70,919 |
| Mexico | $35,491 |
| Germany | $17,939 |
| Japan | $17,520 |
| ROW | $131,179 |
The main influence on Canadian merchandise exports was exercised, as usual, by the exports of energy products. These rose by about one-third during 2017 (up 33.1 percent), which amounted to $27.3 billion and accounted for 93.5 percent of the overall increase in Canadian merchandise exports.
Energy exports rose 33.1 percent, or $27.3 billion, representing 93.5 percent of the overall increase in Canadian exports
The importance of energy exports was even greater for Canada’s most important trading relationship – that with the United States. Without the growth in energy exports, Canada’s total exports to the United States would have declined last year. Higher prices accounted for roughly two-thirds of the increase in the value of energy exports, and higher volumes of exports for the rest. Substantial growth was also observed in the exports of mechanical machinery, aluminum, iron and steel, and copper. On the other hand, notable declines occurred in the exports of automotive products, precious stones and metals, and pharmaceutical products.
The proportion of Canada’s exports destined for the United States dropped 0.3 percentage point to 76.0 percent. Growth in exports to China accelerated to 12.5 percent as their value reached $23.6 billion. Double-digit growth was also recorded in exports to Japan and South Korea. The extent of Canada’s export diversification in the top 10 (90.8 percent of all exports) and the top 20 destinations (94.6 percent of all exports) did not change substantially in 2017.
Imports from the United States grew considerably slower than total imports, leading to a decline in the U.S. import share from 52.2 percent in 2016 to 51.3 percent in 2017. Mostly as a result of that development, imports became slightly more diversified both for the top 10 (to 83.3 percent of all imports) and the top 20 destinations (to 89.9 percent of all imports).
In 2017, Ontario was the only province whose exports declined, falling by $8.9 billion (down 3.6 percent). That decline was offset by growth in exports from Quebec and British Columbia (up $4.7 billion and $4.9 billion, respectively). Alberta’s exports soared $21.1 billion (up 26.4 percent). Most provinces also reported higher imports, with double-digit increases for Alberta, New Brunswick and Saskatchewan. Meanwhile, imports were down by nearly half in Newfoundland and Labrador as well as down by one-fifth in Prince Edward Island. Nunavut reported substantial exports for the first time.
Trade by Top Products
Merchandise Exports
Canada’s merchandise exports increased 5.6 percent to an all-time high of $546.3 billion in 2017, after declining for two consecutive years. Export values rose $29.2 billion above the 2016 level. In the five-year period between 2012 and 2017, exports gained 20.0 percent on aggregate, implying a compound annual growth rate (CAGR) of 3.7 percent over that period.
For the top 10 export products in 2017, results were mostly positive as 7 of the 10 recorded an increase in exports during the year. The largest gains occurred in exports of energy products, which grew 33.1 percent (up $27.3 billion) to reach $109.8 billion. This allowed them to regain the top spot in Canada’s exports ranking and brought their share of total exports to over one-fifth. While higher prices were a driving force behind the growth in energy exports, they were not the only factor responsible. The contribution of higher prices to export value growth was roughly two-thirds in the case of crude oil, just under 60 percent for refined oil, over 80 percent for natural gas and over 95 percent for coal. The remainder of the contribution was accounted for by higher volumes of exports.
| Value 2017($B) | Chang 2017/2016 ($B) | Growth 2017/2016 (%) | Share 2017 (%) | |
|---|---|---|---|---|
| All Products | 546.3 | 29.2 | 5.6 | 100.0 |
| Energy | 109.8 | 27.3 | 33.1 | 20.1 |
| Automotive Products | 81.0 | -4.2 | -4.9 | 14.8 |
| Mechanical Machinery & Equipment | 42.0 | 2.3 | 5.7 | 7.7 |
| Precious Stones & Metals | 24.4 | -0.8 | -3.0 | 4.5 |
| Wood & Articles | 18.3 | 0.8 | 4.7 | 3.3 |
| Electrical Machinery & Equipment | 16.8 | 0.1 | 0.5 | 3.1 |
| Plastics & Articles | 16.3 | 0.3 | 1.7 | 3.0 |
| Aluminum & Articles | 12.7 | 2.0 | 19.0 | 2.3 |
| Aircraft | 12.6 | -1.0 | -7.6 | 2.3 |
| Oil Seeds | 10.2 | 0.7 | 7.2 | 1.9 |
| Top 10 Products | 344.1 | 27.5 | 8.7 | 63.0 |
| All Other Products | 202.2 | 1.7 | 0.8 | 37.0 |
Source: Global Trade Atlas
The bulk of energy exports and of the year’s increase were both accounted for by exports to the United States, which was the destination for 91.1 percent of Canada’s energy exports in 2017. However, growth in the U.S.- bound energy exports was only 31.2 percent, considerably below the 56.1-percent growth in energy exports to other destinations. Particularly notable is that shipments to the other four of the top five destinations rose more than 50 percent each; that all of these four destinations were in Asia; and that the main energy product exported there (coal, bituminous) was not even in the top three sub-products of Canada’s overall energy exports menu (which were occupied by crude oil, refined oil, and natural gas). The destinations in question were, in order: Japan, South Korea, China and India; coal exports were mostly responsible for the increases, but crude oil also figured prominently in the case of China and, to a lesser extent, India. This coal exports growth followed on the heels of a similar performance in 2016. Canada’s total coal exports nearly doubled in two years, having increased by $2.3 billion in 2017.
Figure 5-2
Canada’s Top 5 Energy Exports Destinations

Figure 5-2 Text Alternative
| Type of energy product: | ||||
|---|---|---|---|---|
| 1 | US | Crude Oil | Refined Oil | Natural Gas |
| Increase due to Price | 2/3 | 2/3 | 4/5 | |
| Increase due to Volume | 1/3 | 1/3 | 1/5 | |
| 2 | Japan | coal | ||
| 3 | South Korea | coal | ||
| 4 | China | coal | ||
| 5 | India | coal |
Automotive exports (also known as motor vehicles and parts) declined by 4.9 percent in 2017 (down $4.2 billion). Several factors might have played a role in this decline. First, there was increased domestic consumption: Canada saw a record year for new vehicle sales in 2017 at 2,077,000 units, up 4.7 percent.
Automotive exports declined by 4.9 percent with domestic consumption, production losses and a labour strike playing a role
Secondly, there were production losses in the car lines: end of production for Buick Regal (June 2017) and GMC Terrain (July 2017). Lastly, a labour strike at General Motor’s Ingersoll plant (September and October, 2017) cut production of the top-selling Chevrolet Equinox, and there was a five-week halt to minivan production at FCA Canada’s Windsor plant for retooling and modernization. All of these models are normally exported in large volumes, but with these developments, total Canadian light vehicle production dropped by 7.9 percent.
The decline in automotive exports to the United States was fairly commensurate with its dominant share in Canada’s auto exports (93 percent in 2017). Automotive exports to Mexico declined more than total automotive exports (down 20.9 percent) while those to China, Saudi Arabia and Germany increased (up 3.7 percent to China, 27.2 percent to Saudi Arabia and 69.1 percent to Germany).
Exports of mechanical machinery and equipment went on an upswing, adding $2.3 billion to reach $42.0 billion (up 5.7 percent). All of those increased exports were to the United States. Most notable increases were in turbojets, turbopropellers and other gas turbines (up $0.8 billion), machinery parts (up $0.2 billion), fork-lift trucks (up $0.2 billion) and molding boxes/mold bases (up $0.2 billion). The next largest expansion took place in exports of aluminum and its products, which grew by $2.0 billion (up 19.0 percent).
Changes in other major export sectors were smaller in absolute value. Exports of precious stones and metals contracted by 3.0 percent (down $0.8 billion), in spite of the continuing increase in shipments of gold to the United Kingdom, as exports of gold, silver, coin and other articles to the United States declined. Exports of gold to Hong Kong continued their decline (though at a slower rate than in the previous years), while exports of gold to China increased, and substantial shipments of waste and scrap of precious metals to Norway made an appearance.
Exports of aircraft and parts declined 7.6 percent in 2017 (down $1.0 billion). Shipments fell considerably to the United States, but grew to Switzerland and Latvia. Growth was notable in exports of iron and steel (up $1.7 billion), copper and its products (up $1.0 billion), ores, slag and ash (up $0.9 billion) and wood and its products (up $0.8 billion).
After long and sustained growth, exports of pharmaceutical products stumbled in 2017, losing over a quarter of their value (down $3.0 billion). Having grown at over 18 percent a year for five years to reach 9th place in 2016, this year’s performance sent them tumbling to 16th place in 2017. Medicaments in dosage form destined for the U.S. market accounted for nearly all of that decline.
Merchandise Imports
Canada’s merchandise imports rose by $27.8 billion (up 5.2 percent) in 2017, to $561.0 billion, another high. Import growth was observed in 9 out of 10 top import products, the only exception being precious stones and metals. In the five-year period between 2012 and 2017, imports gained 21.4 percent on aggregate, implying a CAGR of 4.0 percent over that period.
Automotive imports, the top item, grew substantially by 7.7 percent (up $6.9 billion). Less than half of that growth came from the United States, Canada’s top supplier, where the rate of growth was only 4.9 percent. Meanwhile, double-digit growth in auto imports was observed from Mexico, Japan, China, the United Kingdom, Italy and Belgium. Imports of trucks led the increases (up 18.7 percent), followed by imports of passenger vehicles (up 6.1 percent) and tractors (up 24.3 percent).
Mechanical machinery imports moved largely sideways for the second year running. Growth amounted to just $0.4 billion (up 0.5 percent). Imports from China grew robustly at 10.7 percent (up $1.3 billion) and imports from the United States also rose more than the average, at 3.0 percent. Offsetting those increases was a large decline of machinery imports from South Korea (down $3.1 billion) due to the Hebron Utilities/Process Module (UPM) shipment in 2016; few other significant changes occurred for this commodity.
| Value 2017 ($B) | Change 2017/2016 ($B) | Growth 2017/2016 (%) | Share 2017 (%) | |
|---|---|---|---|---|
| All Products | 561.0 | 27.8 | 5.2 | 100.0 |
| Automotive Products | 96.2 | 6.9 | 7.7 | 17.1 |
| Mechanical Machinery & Equipment | 82.3 | 0.4 | 0.5 | 14.7 |
| Electrical Machinery & Equipment | 55.5 | 3.0 | 5.7 | 9.9 |
| Energy | 38.6 | 5.1 | 15.3 | 6.9 |
| Plastics & Articles | 20.8 | 1.3 | 6.7 | 3.7 |
| Scientific & Technical Instruments | 16.0 | 0.1 | 0.8 | 2.8 |
| Pharmaceuticals | 15.2 | 0.1 | 0.8 | 2.7 |
| Articles of Iron & Steel | 12.7 | 1.5 | 13.8 | 2.3 |
| Precious Stones & Metals | 12.6 | -1.3 | -9.3 | 2.3 |
| Furniture | 12.0 | 0.4 | 3.6 | 2.1 |
| Top 10 Products | 361.9 | 17.6 | 5.1 | 64.5 |
| All Other Products | 199.1 | 10.2 | 5.4 | 35.5 |
Source: Global Trade Atlas
After a surprising decline in 2016, imports of electrical machinery and equipment resumed growth in 2017, gaining $3.0 billion (up 5.7 percent). Most of the growth ($2.4 billion) came from China and was due to increased cellphone imports; smaller increases occurred in the imports from Malaysia and Thailand. Meanwhile, imports in this sector from Japan, Germany and especially Vietnam declined. This put an end to years of explosive growth in imports of electrical machinery and equipment from Vietnam, which slipped from the fifth to seventh in the rankings of suppliers of this commodity to Canada.
Imports of electrical machinery and equipment gained $3.0 billion, with most of the growth due to increased cellphone imports from China
Imports of energy products grew the fastest in the top 10, rising 15.3 percent (up $5.1 billion) to $38.6 billion. The increase was mainly due to rising imports from the United States, due primarily to crude oil and natural gas, and in smaller part to refined oil. Price and volume dynamics were quite different for these components: while both price and volume of natural gas imports increased by roughly a quarter, volumes of oil imports (especially refined oil) were cut back, somewhat inelastically, in view of oil price increases of between 20 to 25 percent. Large increases in imports of energy products from Saudi Arabia, Azerbaijan, the United Kingdom, Belgium and South Korea were observed. Imports from Nigeria, Algeria, Kazakhstan and Mexico declined. Overall, imports of natural gas increased by over half and imports of coal by one-third.
Outside of these top four products, imports are considerably smaller, but those commodities still generated almost 45 percent of the overall import growth. Notable contributions came from the imports of articles of iron and steelFootnote 5-2 (up $1.5 billion), iron and steelFootnote 5-3 (up $1.5 billion), plastics and articles (up $1.3 billion) and copper and articles (up $0.9 billion). The only decline of note occurred in imports of precious stones and metals, which fell on lower imports of gold and silver from the United States.
Trade by Top Destinations
Merchandise Exports
In 2017, Canada’s merchandise exports to the United States reversed two years of declines and rose $20.5 billion, reaching $414.9 billion. Growth of exports to the U.S. market was, at 5.2 percent, slightly behind average export growth of 5.6 percent, resulting in the decline of the U.S. share of Canadian merchandise exports for the third consecutive year, down to 76.0 percent of the total (from 76.3 percent in 2016). Nevertheless, there was no increase in export diversification, as the other top 10 export destinations compensated by increasing their shares. All 10 top export destinations accounted for 90.84 percent of Canadian exports in 2017, little changed from 90.87 percent in 2016; notably, 87.1 percent went to the top five destinations. Concentration was also fairly stable in the top 20, from 94.68 percent in 2016 to 94.57 percent in 2017.
| Value 2017 ($B) | Change 2017/2016 ($B) | Growth 2017/2016 (%) | Share 2017 (%) | |
|---|---|---|---|---|
| World | 546.3 | 29.2 | 5.6 | 100.0 |
| United States | 414.9 | 20.5 | 5.2 | 76.0 |
| China | 23.6 | 2.6 | 12.5 | 4.3 |
| United Kingdom | 17.6 | 0.5 | 3.1 | 3.2 |
| Japan | 11.8 | 1.1 | 10.3 | 2.2 |
| Mexico | 7.8 | 0.2 | 2.8 | 1.4 |
| South Korea | 5.2 | 0.8 | 18.9 | 1.0 |
| India | 4.2 | 0.2 | 5.8 | 0.8 |
| Germany | 4.1 | 0.1 | 1.8 | 0.8 |
| Belgium | 3.5 | 0.2 | 7.5 | 0.6 |
| France | 3.4 | 0.0 | 0.2 | 0.6 |
| Top 10 | 496.3 | 26.3 | 5.6 | 90.8 |
| Next 25 | 34.7 | 2.0 | 6.1 | 6.3 |
| Next 75 | 14.4 | 0.8 | 6.1 | 2.6 |
| Last 120 | 1.0 | 0.0 | 2.4 | 0.2 |
Source: Global Trade Atlas
Growth of merchandise exports to the United States in 2017 was largely driven by exports of energy products, which grew 31.2 percent, or $23.8 billion, to reach exactly $100.0 billion. This returned energy products to the top rank in commodity exports to the United States, briefly lost to automotive exports in 2016. All major components of energy products exported to the U.S. market – crude oil, refined oil, and natural gas – grew markedly in 2017. In the case of oil, roughly two-thirds of the increase was due to higher prices; this proportion was up to four-fifths in the case of natural gas.
After a sizeable increase in 2016, automotive exports to the United States shrank by 5.3 percent in 2017 (down $4.2 billion) to $75.4 billion. This was mainly due to a $4.1-billion decline in passenger car exports (down 6.7 percent). Exports of auto parts dropped 4.6 percent while truck exports rose 14.7 percent. Among other major exports to the United States, Canada’s exports of mechanical machinery to the U.S. market increased by 8.0 percent in 2017, reaching $31.8 billion; the most significant component of that increase was a 125-percent growth in turbojet exports. Other top exports to the U.S. market – plastics, wood and articles of wood and electrical machinery – experienced modest increases in value, while aluminum exports grew 19.9 percent (up $1.8 billion). Other movements of significance included a 22.8-percent rise in iron and steel exports and a 33.2-percent rise in exports of copper and articles of copper (worth $1.3 billion and $0.9 billion, respectively). Meanwhile, exports of precious metals declined by 29.7 percent (down $2.9 billion), aircraft exports dropped by 14.8 percent (down $1.1 billion) and pharmaceutical products exports fell by 32.7 percent (down $2.6 billion).
Exports to the next top destination, China, grew strongly at 12.5 percent, expanding its share to 4.3 percent and picking up most of the room left by the declining U.S. share. The total of $23.6 billion in exports to China is Canada’s highest ever. Canada’s exports of oil seeds, wood pulp, and wood and articles of wood to China increased strongly (up $0.7 billion, $0.5 billion and $0.2 billion, respectively); other prominent increases occurred in the exports of energy products, fish and crustaceans, and organic chemicals. Exports to the United Kingdom increased by $0.5 billion (gold exports went up while most of the other top export items declined). Exports to Japan grew strongly for the second year running (up 10.3 percent, or $1.1 billion, primarily due to coal and pork exports). The highest rate of growth in the top 10 destinations was observed in exports to South Korea, which grew close to 20 percent (up $0.8 billion, mostly due to coal exports). Growth in exports was observed among all 10 top destinations.
In 2017, the six leading destinations for Canadian exports maintained their 2016 ranks. The United States remained on top, followed by China. The United Kingdom was next with 3.2 percent of total exports, Japan was fourth, Mexico fifth and South Korea sixth. The only change in the top 10 was India leapfrogging Germany into seventh place, as exports to India rose 5.8 percent (due to rising coal exports). Germany slipped to eighth place, followed by Belgium in ninth and France in tenth. The only change in the top 20 was Switzerland’s rise to 15th place at the expense of the United Arab Emirates.
Canadian export growth was the highest in Latvia (up 129.7 percent, mostly due to aircraft exports), followed by Vietnam (up 99.2 percent) and Switzerland (up 51.7 percent)
Among the 41 markets that represented at least $500 million of Canadian exports, growth was the highest in Latvia (up 129.7 percent, mostly due to aircraft exports), followed by Vietnam (up 99.2 percent, driven by wheat exports) and Switzerland (up 51.7 percent, driven by aircraft exports).
The largest proportional export reduction occurred in exports to Pakistan, down 30.8 percent; exports to Thailand declined by 18.9 percent and exports to Brazil dropped by 16.3 percent.
Merchandise Imports
The top import suppliers to Canada have been quite stable recently, and there were no newcomers to the top 10 in 2017. The only change was the United Kingdom regaining the sixth place that it lost to South Korea in 2016 due the one-time delivery of the Hebron UMP module. The United States, China and Mexico hold the top three spots as import suppliers to Canada, with Germany and Japan rounding out the top five. No other changes occurred in the top 10, and the only newcomer to the top 20 Canadian import sources was Saudi Arabia taking the place of Peru in 20th place.
Imports from the United States expanded by 3.5 percent in 2017, a slower pace than the 5.2-percent growth in overall imports. Total imports from the United States for the year rose by $9.8 billion to $288.0 billion. Thus the U.S. share in Canadian merchandise imports also decreased, down by 0.8 percentage point to 51.3 percent. Proportionally, over one-third of the import growth from the United States was due to a 15.7-percent expansion in energy imports (up $3.4 billion, driven in equal measure by increased imports of crude oil and natural gas). Nearly another 30 percent of the increase occurred due to the 4.9-percent growth in automotive imports (up $2.9 billion, entirely due to higher imports of trucks, trailers and tractors). Other significant changes occurred in imports of iron and steel (up 12.9 percent), miscellaneous chemical products (up 14.5 percent), pharmaceutical products (down 8.7 percent) and precious stones and metals (down 28.4 percent).
| Value 2017 ($B) | Change 2017/2016 ($B) | Growth 2017/2016(%) | Share 2017 (%) | |
|---|---|---|---|---|
| World | 561.0 | 27.8 | 5.2 | 100 |
| United States | 288.0 | 9.8 | 3.5 | 51.3 |
| China | 70.9 | 6.5 | 10.1 | 12.6 |
| Mexico | 35.5 | 2.3 | 7.0 | 6.3 |
| Germany | 17.9 | 0.7 | 4.2 | 3.2 |
| Japan | 17.5 | 1.7 | 10.9 | 3.1 |
| United Kingdom | 8.9 | 0.6 | 7.7 | 1.6 |
| South Korea | 8.7 | -1.9 | -17.8 | 1.6 |
| Italy | 8.2 | 0.6 | 8.1 | 1.5 |
| France | 6.2 | 0.2 | 4.2 | 1.1 |
| Taiwan | 5.4 | 0.4 | 7.1 | 1.0 |
| Top 10 | 467.2 | 21.0 | 4.7 | 83.3 |
| Next 25 | 67.0 | 6.1 | 10.0 | 11.9 |
| Next 75 | 26.5 | 0.9 | 3.5 | 4.7 |
| Last 120 | 0.4 | -0.2 | -30.1 | 0.1 |
Source: Global Trade Atlas
Imports from China grew robustly, rising 10.1 percent (up $6.5 billion) to reach the $70.9-billion mark. That expansion was broadly distributed among top import categories, with electrical machinery imports leading the way at 14.9 percent growth (up $2.4 billion, mostly cellphones). Other significant growth items were: mechanical machinery, with growth of 10.7 percent (up $1.3 billion, mostly computers); plastics, with growth of 13.0 percent (up $0.3 billion); articles of iron and steel, with growth of 18.5 percent (up $0.4 billion) and automotive products, with growth of 13.8 percent (up $0.3 billion). Imports from Mexico increased by 7.0 percent (up $2.3 billion) to $35.5 billion (about half of the value of imports from China), and imports from Germany and Japan were each valued, in turn, at about half of imports from Mexico. Imports from Germany grew 4.2 percent while imports from Japan jumped 10.9 percent – a third consecutive year of strong growth, and the strongest among Canada’s top 10 import sources. A large decrease in imports from South Korea (down 17.8 percent, or $1.9 billion) was due to higher than usual import levels of 2016, related to the delivery of the $2.9-billion, 30,000-tonne Hebron UPM module to Newfoundland and Labrador.
For imports, there was an increase in diversification: the top 10 supplying countries were responsible for 83.28 percent of total Canadian merchandise imports in 2017, which was down from the 83.69-percent share that the top 10 suppliers provided in 2016. Diversification also increased slightly in the top 20 import suppliers, with concentration down from 90.02 percent in 2016 to 89.89 percent in 2017.
Among the import-supplying countries of significance (providing imports in excess of $1 billion), imports from Azerbaijan registered the largest growth rate at 878.8 percent to reach $1.3 billion. Twelve other suppliers outside the top 10 to register double-digit growth rates were Saudi Arabia, Belgium, Finland, Norway, Denmark, Turkey, Brazil, Ireland, Chile, Russia, Spain and Argentina. Significant decreases in imports also took place: from Nigeria (down 34.1 percent) and Peru (down 26.8 percent).
Merchandise Trade by Provinces and Territories
Merchandise Exports
The top three exporting provinces – Ontario, Alberta and Quebec – accounted for 78.1 percent of Canada’s exports in 2017. Ontario, however, was the only province whose exports declined, falling by $8.9 billion (down 3.6 percent). Automotive exports, to a large degree concentrated in Ontario and already mentioned above, were the main culprit (down 5.8 percent), with additional impact coming from declines in exports of precious stones and metals (down 8.2 percent) and pharmaceutical products (down 29.1 percent). The Ontario decline, however, was offset by growth in exports from Quebec and British Columbia (up $4.7 billion and $4.9 billion, respectively), while Alberta’s exports soared $21.1 billion (up 26.4 percent), restoring it to the second rank among Canada’s exporter jurisdictions. Exports of energy products were driving Alberta’s growth, while in Quebec mechanical machinery and aluminum and articles were key; as for British Columbia, coal and gas exports caused most of the increase.
| Value 2017 ($B) | Change 2017/2016 ($B) | Growth 2017/2016 (%) | Share 2017 (%) | |
|---|---|---|---|---|
| Ontario | 240.7 | -8.9 | -3.6 | 44.1 |
| Alberta | 100.7 | 21.1 | 26.4 | 18.4 |
| Quebec | 85.1 | 4.7 | 5.8 | 15.6 |
| British Columbia | 44.6 | 4.9 | 12.3 | 8.2 |
| Saskatchewan | 29.0 | 2.3 | 8.5 | 5.3 |
| Manitoba | 14.0 | 0.4 | 2.8 | 2.6 |
| New Brunswick | 12.8 | 2.2 | 20.4 | 2.3 |
| Newfoundland and Labrador | 10.2 | 1.7 | 20.7 | 1.9 |
| Nova Scotia | 5.5 | 0.1 | 2.4 | 1.0 |
| Northwest Territories | 1.9 | 0.4 | 30.2 | 0.3 |
| Prince Edward Island | 1.4 | 0.1 | 4.5 | 0.3 |
| Nunavut | 0.3 | 0.3 | 8,225.0 | 0.1 |
| Yukon | 0.1 | -0.1 | -50.7 | 0.0 |
| All Jurisdictions | 546.3 | 29.2 | 5.6 | 100.0 |
Source: Global Trade Atlas
Saskatchewan’s exports grew 8.5 percent (up $2.3 billion) while Manitoba’s exports inched up 2.8 percent (up $0.4 billion). Further down the rankings, New Brunswick showed remarkable growth of 20.4 percent (up $2.2 billion), matched and exceeded by Newfoundland and Labrador with 20.7 percent (up $1.7 billion).
Nunavut reported substantial exports for the first time
Energy exports were behind both increases, though ores helped as well in the case of Newfoundland and Labrador. Nova Scotia’s exports grew modestly by 2.4 percent (up $0.1 billion), while Northwest Territories expanded exports by 30.2 percent (up $0.4 billion) due to higher diamond exports. Yukon’s main export article, copper ores, halved their (and the territory’s) exports, while Nunavut reported major exports ($320 million, gold) for the first time.
Merchandise Imports
On the import side, the three great import gateways to Canada are Ontario, Quebec and British Columbia, providing access to and from the United States and to the Atlantic and Pacific shipping routes, respectively. In 2017, 84.9 percent of Canada’s imports entered the country through these provinces.
| Value 2017 ($B) | Change 2017/2016 ($B) | Growth 2017/2016 (%) | Share 2017 (%) | |
|---|---|---|---|---|
| Ontario | 346.6 | 13.0 | 3.9 | 61.8 |
| Quebec | 77.3 | 3.7 | 5.0 | 13.8 |
| British Columbia | 52.1 | 3.3 | 6.7 | 9.3 |
| Alberta | 28.2 | 3.2 | 12.7 | 5.0 |
| Manitoba | 21.5 | 1.7 | 8.6 | 3.8 |
| Saskatchewan | 11.5 | 2.5 | 28.2 | 2.1 |
| New Brunswick | 11.4 | 2.2 | 23.7 | 2.0 |
| Nova Scotia | 8.9 | 0.8 | 9.5 | 1.6 |
| Newfoundland and Labrador | 3.2 | -2.6 | -44.2 | 0.6 |
| Yukon | 0.1 | 0.0 | 32.2 | 0.0 |
| Nunavut | 0.1 | 0.1 | 1,925.0 | 0.0 |
| Prince Edward Island | 0.1 | 0.0 | -19.7 | 0.0 |
| Northwest Territories | 0.0 | 0.0 | N/A | 0.0 |
| All Jurisdictions | 561.0 | 27.8 | 5.2 | 100.0 |
Source: Global Trade Atlas
Most provinces reported higher imports in 2017. Ontario led the way with a $13.0-billion increase, although that amounted to only 3.9-percent growth (led by the imports of automotive products and electrical machinery and equipment). Quebec imported $3.7 billion more (broad-based growth led by copper and articles) and British Columbia’s imports rose by $3.3 billion (broad-based growth led by mechanical machinery). Alberta, New Brunswick and Saskatchewan all saw double-digit import growth (12.7 percent, 23.7 percent and 28.2 percent, respectively). Meanwhile, imports were down by nearly half in Newfoundland and Labrador as well as down by one-fifth in Prince Edward Island. Nunavut reported a substantial increase in imports.
Figure 5-3
Provincial/Territorial Merchandise Exports And Imports, 2017

Figure 5-3 Text Alternative
| Value 2017 ($B) | Change 2017/2016 ($B) | Growth 2017/2016 (%) | |
|---|---|---|---|
| Ontario | 240.681 | -8.863 | -3.551678261 |
| Alberta | 100.734 | 21.057 | 26.42795286 |
| Quebec | 85.055 | 4.684 | 5.827972776 |
| British Columbia | 44.634 | 4.892 | 12.3093956 |
| Saskatchewan | 29.003 | 2.272 | 8.499494968 |
| Manitoba | 14.004 | 0.377 | 2.766566376 |
| New Brunswick | 12.829 | 2.173 | 20.39226727 |
| Newfoundland and Labrador | 10.189 | 1.749 | 20.72274882 |
| Nova Scotia | 5.47 | 0.126 | 2.357784431 |
| Northwest Territories | 1.871 | 0.434 | 30.20180932 |
| Prince Edward Island | 1.383 | 0.06 | 4.535147392 |
| Nunavut | 0.333 | 0.329 | 8.225 |
| Yukon | 0.109 | -0.112 | -50.67873303 |
| All Jurisdictions | 546.295 | 29.178 | 5.642436818 |
| Ontario | 346.629 | 12.98 | 3.890315871 |
|---|---|---|---|
| Quebec | 77.348 | 3.694 | 5.015342005 |
| British Columbia | 52.072 | 3.281 | 6.724600849 |
| Alberta | 28.215 | 3.174 | 12.67521265 |
| Manitoba | 21.45 | 1.706 | 8.640599676 |
| Saskatchewan | 11.524 | 2.534 | 28.1868743 |
| New Brunswick | 11.408 | 2.185 | 23.69077307 |
| Nova Scotia | 8.939 | 0.779 | 9.546568627 |
| Newfoundland and Labrador | 3.244 | -2.567 | -44.17484082 |
| Yukon | 0.078 | 0.019 | 32.20338983 |
| Nunavut | 0.081 | 0.077 | 1.925 |
| Prince Edward Island | 0.053 | -0.013 | -19.6969697 |
| Northwest Territories | 0 | 0 | N/A |
| All Jurisdictions | 561.041 | 27.849 | 5.222642637 |
Source: Global Trade Atlas
Merchandise Trade by Top Drivers
Canada’s trade performance can be examined in greater detail using a commodity breakdown comprising over 1,200 items.Footnote 5-4 However, only a few of these items account for a sufficient trade value to decisively influence Canada’s trade balance. The table below lists 20 commodities that drove Canada’s trade balance performance in 2017, expressed at the 4-digit HS level.
These 20 commodities accounted for $237.3 billion (43.4 percent) of Canada’s $546.3 billion in exports in 2017. At the same time, these products also represented 29.0 percent of overall imports, or $162.5 billion. Total trade in these 20 commodities thus amounted to nearly $400 billion and yielded a $74.7-billion trade surplus, which was $10.5 billion higher than in the previous year. That movement helped narrow Canada’s merchandise trade deficit to $14.7 billion in 2017, an improvement of $1.3 billion from $16.1-billion deficit registered in 2016.
A closer inspection of the trade performance of these commodities shows that Canada specializes in a relatively small number of products, mostly natural resources, in order to produce a sizeable trade surplus among these key products. It then uses this trade surplus to finance imports of a large variety of other products – mostly varieties of manufactured goods that are not produced in Canada because of a small domestic market (e.g., smart phones, medicine, vehicles and vehicle engines). Canada also seems to completely supply its domestic market in a range of natural resource products (wheat, lumber, canola seeds, aluminum, potash, etc.). Overall, this picture of more concentrated exports and more varied imports is consistent with the economic trade theories that derive trade from comparative advantage, resource endowment, and demand for variety, as well as firm-based theories of trade.
| Exports 2017 ($B) | Exports Δ2017/16 ($B) | Imports 2017 ($B) | Imports Δ2017/16 ($B) | Balance 2017 ($B) | Balance Δ2017/16 ($B) | |
|---|---|---|---|---|---|---|
| Large Exports, Large Imports, Surplus | ||||||
| Crude Oil (2709) | 70.1 | 17.8 | 16.6 | 2.1 | 53.6 | 15.6 |
| Passenger Cars (8703) | 60.3 | -4.4 | 37.1 | 2.1 | 23.2 | -6.5 |
| Gold (7108) | 17.1 | 0.6 | 7.1 | -0.3 | 10.0 | 0.9 |
| Natural Gas (2711) | 13.2 | 2.9 | 3.8 | 1.3 | 9.4 | 1.5 |
| Sub-total | 160.8 | 16.9 | 64.6 | 5.3 | 96.2 | 11.6 |
| Large Exports, Small Imports, Surplus | ||||||
| Lumber (4407) | 10.8 | 0.5 | 0.6 | 0.0 | 10.2 | 0.5 |
| Aluminum (7601) | 8.2 | 1.5 | 0.4 | 0.1 | 7.8 | 1.5 |
| Wheat (1001) | 6.6 | 0.6 | 0.0 | 0.0 | 6.6 | 0.6 |
| Canola Seed (1205) | 6.6 | 0.9 | 0.1 | 0.0 | 6.4 | 0.9 |
| Coal (2701) | 6.8 | 2.3 | 0.9 | 0.2 | 5.9 | 2.1 |
| Chemical Woodpulp (4703) | 5.7 | 0.4 | 0.3 | 0.0 | 5.5 | 0.4 |
| Potash (3104) | 5.1 | 0.4 | 0.1 | 0.0 | 5.0 | 0.4 |
| Sub-total | 49.8 | 6.6 | 2.3 | 0.3 | 47.4 | 6.4 |
| Small Exports, Large Imports, Deficit | ||||||
| Excavating machinery (8429) | 0.2 | 0.0 | 3.9 | 1.2 | -3.7 | -1.2 |
| Tractors (8701) | 0.5 | 0.0 | 4.6 | 0.9 | -4.1 | -0.9 |
| Sub-total | 0.7 | 0.0 | 8.5 | 2.1 | -7.8 | -2.1 |
| Large Exports, Large Imports, Deficit | ||||||
| Wire and Cable (8544) | 1.1 | 0.1 | 4.6 | 0.1 | -3.6 | 0.0 |
| Auto Parts (8708) | 13.6 | -0.4 | 26.6 | -0.6 | -13.0 | 0.2 |
| Trucks (8704) | 3.0 | 0.3 | 20.4 | 3.2 | -17.4 | -2.9 |
| Computers (8471) | 1.9 | 0.1 | 11.1 | 0.8 | -9.2 | -0.6 |
| Blood Products (3002) | 1.0 | 0.1 | 4.8 | 0.3 | -3.8 | -0.2 |
| Internal combustion engines (8407) | 3.0 | -0.5 | 6.4 | -0.1 | -3.4 | -0.3 |
| Telephones & Parts (8517) | 2.4 | -0.3 | 13.2 | 1.3 | -10.8 | -1.5 |
| Sub-total | 26.1 | -0.4 | 87.2 | 5.0 | -61.2 | -5.4 |
| 20-Commodity Total | 237.3 | 23.2 | 162.6 | 12.7 | 74.7 | 10.5 |
Source: Global Trade Atlas
Canada’s performance in the EU - A constant market share perspective
Background
Over the last 15 years, Canadian merchandise exports to the European Union (EU) have seen significant growth, nearly doubling from $24.2 billion in 2002 to $41.9 billion in 2016. A further push can be expected from the Canada-European Union Comprehensive Economic and Trade Agreement (CETA), whose provisional application began on September 21, 2017. Though $41.9 billion represents only about one tenth of Canadian exports to the United States in 2016, the EU (if treated as one partner) was the second-largest market for Canadian exports by a wide margin, ahead of China at $21.0 billion.Footnote m3-1 With total EU imports at $2.5 trillion in 2016, the Canadian share is about 1.7%. Remarkably, this market share stayed relatively constant from 2002 until 2016, despite the emergence of strong international competition. For example, China saw its market share of EU imports more than double from 9.7% in 2002 to 20.1% in 2016, while the U.S. share declined from 19.3% to 14.5%.
This analysis attempts to shed light on two issues: what drove the near doubling of Canadian exports to the EU and the resilience of Canada’s import share in the EU over the past 15 years. Another area of interest is the Canadian product mix and its impact on overall export performance in the European market. Based on the results of this analysis, this study aims to identify areas of strength and weakness in Canadian exports, which may help inform sectors of focus for the Canadian Trade Commissioner Service (TCS) as efforts move toward making the most of CETA.
Figure 1
Canadian Merchandise Exports To EU ($B) 2016
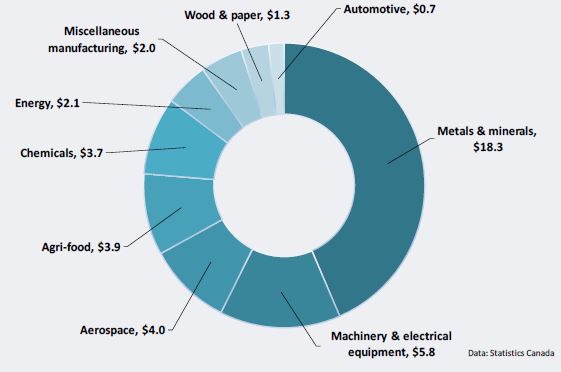
Figure 1 Text Alternative
| EU ($B) 2016 | |
|---|---|
| Metals & minerals | 18.3 |
| Machinery & electrical equipment | 5.8 |
| Aerospace | 4.0 |
| Agri-food | 3.9 |
| Chemicals | 3.7 |
| Energy | 2.1 |
| Miscellaneous manufacturing | 2.0 |
| Wood & paper | 1.3 |
| Automotive | 0.7 |
Canadian merchandise exports to the EU in 2016 were dominated by the metals and minerals category. Exports in this category accounted for $18.3 billion in 2016, 43.5% of total Canadian merchandise exports to the EU. Gold comprised a large part of these exports (60.6% in 2016) and was exported almost exclusively to the United Kingdom. Other significant export categories included machinery and electrical equipment, aerospace, agri-food, and chemicals. There were a few key developments in the composition of Canadian exports to the EU by industry between 2002 and 2016. The share of metals and minerals more than doubled, led by exceptional growth of gold exports from $0.2 billion to $11.1 billion. Meanwhile, wood and paper, and machinery and electrical equipment saw large declines in their relative importance.
The Methodology – Constant Market Share Analysis
The Constant Market Share Analysis (CMSA) method was used to decompose growth or decline in EU imports from Canada into three components: the growth effect (or market size effect), the product mix effect, and the competitiveness effect. The growth effect (GE) describes how Canadian exports to the EU would have changed if they had followed growth of the total EU import market. In other words, it describes the opportunity presented by the growth of the total EU market, a useful benchmark against which to evaluate Canadian exports. The product effect (PE) describes how Canadian exports aligned with rising and falling sectors in EU imports. For example, a positive PE indicates that imports in that sector were in high demand and thus boosted Canadian exports. Finally, the competitiveness effect (CE) shows how Canadian exports compared to their international competition given the growth opportunities described by growth and product effects. A positive CE is associated with an increase in market share for Canadian exports. All three effects can be measured for both sectoral and overall exports from Canada to the EU.
The analysis is performed on trade data at two different levels of detail. First, the main analysis compares exports broken down into nine large sectors such as “Metals and minerals”, “Aerospace” and “Agri-food”. Second, results are analyzed at the more detailed product level by HS-2 codes. Examples of HS-2 code categories within the “Agri-food” group are oilseeds, cereals, fish and crustaceans. The more detailed level analysis supplements the main analysis by providing information on key subcategories. Due to the large size of and fluctuations in the precious metals subcategory, a secondary analysis was conducted excluding precious metals.
Result by Period
The overall time period from 2002 to 2016 was separated into four time periods according to the dynamics of overall EU import growth. The first period is labelled “expansion”, as the EU experienced strong growth in total merchandise imports that lasted from 2002 to 2008. This was followed by a sharp decline in 2009, the “financial crisis” period. After the crisis, there was a period of solid import growth that lasted for two years (2009-2011) and is labelled “recovery”. More recently, there has been a period of import growth “moderation” over which EU imports have seen modest growth.
Figure 2
Total EU External Imports

Figure 2 Text Alternative
| Commodity | Millions of Canada Dollars | ||||||||||||||
|---|---|---|---|---|---|---|---|---|---|---|---|---|---|---|---|
| 2002 | 2003 | 2004 | 2005 | 2006 | 2007 | 2008 | 2009 | 2010 | 2011 | 2012 | 2013 | 2014 | 2015 | 2016 | |
| Total | 1,390,879 | 1,480,126 | 1,656,498 | 1,778,390 | 1,949,966 | 2,128,481 | 2,473,159 | 1,959,180 | 2,086,046 | 2,374,218 | 2,308,843 | 2,305,143 | 2,481,870 | 2,453,579 | 2,506,985 |
Figure 3
Constant Market Share Analysis of European Imports from Canada (Billion $)

Figure 3 Text Alternative
| Growth Effect | Product Effect | Competitiveness Effect | Total Effect | |
|---|---|---|---|---|
| 2009-2016 | 8.7 | 3.6 | -0.4 | 11.9 |
| 2008-2009 | -8.0 | -0.1 | -0.2 | -8.2 |
| 2002-2008 | 18.8 | -7.0 | 2.3 | 14.1 |
| Growth Effect | Product Effect | Competitiveness Effect | Total Effect | |
| 2011-2016 | 2.3 | 3.9 | -5.8 | 0.4 |
| 2009-2011 | 6.4 | -0.3 | 5.4 | 11.5 |
| 2008-2009 | -8.0 | -0.1 | -0.2 | -8.2 |
| 2002-2008 | 18.8 | -7.0 | 2.3 | 14.1 |
Looking at the expansion period in the early part of the millennium, Canada’s export growth was $14.1billion – less than the benchmark of $18.8 billion set by total EU import market growth (GE). Canadian exports were set to overtake that benchmark and outperform international competition thanks to a positive CE carried by the energy and metals and minerals sectors. However, export growth was restrained by a negative PE of $7.0 billion that reflected slower EU import growth in sectors where Canadian exports were concentrated, namely aerospace, machinery and electrical equipment, and wood and paper.
The decline in Canadian exports to the EU during the financial crisis was in line with EU imports from the rest of the world, with the decline of $8.2 billion almost exclusively explained by the negative GE, whereas PE and CE were insignificant. Thus, while Canadian exports suffered from a shrinking pie of EU imports, they did not experience a decline in the size of their slice relative to others, i.e. their market share.
The recovery period saw growth in Canadian exports nearly double the benchmark set by total EU imports. Canadian exports outperformed the rest of the world due to a large positive CE. Again, the CE was strongly supported by the metals and minerals and energy sectors, with aerospace and agri-food also outpacing international competition. The PE caused only a slight drag of $0.3 billion, driven by lower EU import demand for aerospace, machinery and electrical equipment, and agri-food products.
The growth moderation period is so named as total EU imports experienced slow growth, but Canadian exports underperformed even this benchmark. Canadian exports grew by only $0.4 billion (+1%) despite benefiting from a large positive PE (+$3.9 billion). This PE was supported by strong European demand for aerospace, machinery and electrical equipment, chemicals and agri-food imports. A large negative CE of $5.8 billion undid most of the potential gains, with precious metals and chemicals having the largest negative impact. Focusing on precious metals, Canada’s market share of the EU precious metals import market declined from 14.1% to 10.1% as Switzerland, Turkey and Hong Kong saw their shares increase. Energy was the only sector to record a positive CE, but suffered from a strong negative PE, as EU energy import demand declined by 42.9% from 2011 to 2016.
Full Period Results
Figure 4
Constant Market Share Analysis of European Imports from Canada 2002 to 2016 (Billion $)
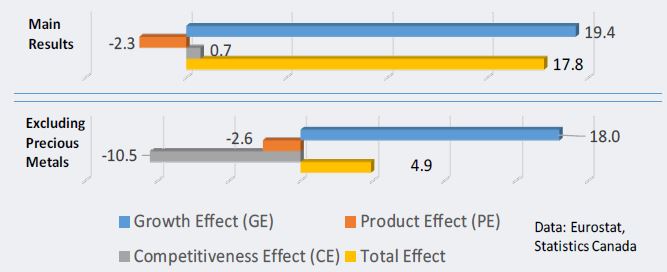
Figure 4 Text Alternative
| Main Results | |||
|---|---|---|---|
| Growth Effect (GE) | Product Effect (PE) | Competitiveness Effect (CE) | Total Effect |
| 19.4 | -2.3 | 0.7 | 17.8 |
| Excluding Precious Metals | |||
| Growth Effect (GE) | Product Effect (PE) | Competitiveness Effect (CE) | Total Effect |
| 18.0 | -2.6 | -10.5 | 4.9 |
When the full time period (2002-2016) is considered, some of the short-term period-to-period changes disappear and a few long-term trends stand out. Canadian exports slightly underperformed benchmark growth of $19.4 billion as Canada’s export mix negatively affected total growth to the tune of $2.3 billion (i.e. product effect). As explained in the methodology section, this means that Canadian export products did not align well with EU import demand. Results from the period-to-period analysis have shown that weaker European import demand for wood and paper and aerospace products contributed the most to this negative PE. At the same time, Canadian exports outperformed their international competition, achieving a positive CE of +$0.7 billion. This positive CE was largely due to the metals and minerals sector, which recorded a +$9.1 billion CE, strongly outpacing international competition. Canada’s energy sector also outperformed the rest of the world with a +$0.9 billion CE. In contrast to these positive results, Canadian wood and paper products struggled with a negative CE across all time periods. This was exacerbated by a negative PE, resulting in a decline of 58.9% in the value of exports in this sector between 2002 and 2016. China and Brazil were some major competitors in wood and paper that increased their market share. The machinery and electrical equipment and aerospace sectors also underperformed global competition. Finally, after posting competitiveness gains from 2002 to 2009, the Canadian chemicals sector experienced a decline in competitiveness from 2009 to 2016.
Once the precious metals subcategory is excluded from the analysis, the results paint a vastly different picture. While the impact of the product mix remains negative and close in size to the main analysis, struggling competitiveness represented by a negative CE of $10.5 billion causes Canadian exports to the EU to significantly underperform benchmark growth. Machinery and electrical equipment, wood and paper, and base metals were some of the main culprits contributing to this negative CE. As a consequence, exports excluding precious metals grew by only $4.9 billion instead of a potential $18.0 billion over the time period. The stark contrast between the two graphs highlights how the strong performance of Canadian precious metals exports hid competitive weaknesses in other sectors.
As noted in the beginning of this report, Canada’s share of EU external imports was stable while that of the United States fell sharply. If, however, precious metals are excluded, Canada’s share fell from 1.7% to 1.2%, in line with the relative decline of the United States’ share of the EU market.
Conclusions
This CMSA research helps explain the drivers behind the performance of Canadian exports to the EU over the 2002 to 2016 period. There are three key observations. First, though Canada’s market share stayed relatively stable at about 1.7%, and growth in EU imports from Canada only slightly trailed growth in total EU imports, the strong performance of the precious metals sector hid the overall weakness in competitiveness of most Canadian sectors in the EU import market. Canadian precious metals exports were largely driven by gold exports to the United Kingdom. Excluding precious metals, Canada’s market share would have dropped from 1.7% to 1.2%. Second, most Canadian sectors experienced a negative competitiveness effect in the EU market, highlighted by machinery and electrical equipment, wood and paper, and base metals. Only Canadian energy and precious metals exports were able to gain market share against international competition. In total, weaker competitiveness in sectors other than precious metals cost the Canadian economy a potential $10.5 billion in exports to the EU across the 2002 to 2016 period. Much of this can be explained by the rise of emerging markets such as China, which saw its market share of EU imports more than double from 9.7% in 2002 to 20.1% in 2016. Third, the product mix of Canadian exports had an overall negative effect on export growth to the EU of $2.3 billion. Weak demand for wood and paper, and aerospace sector products from the EU put a drag on potential exports, in contrast to metals and minerals and chemicals, which were helped by growing demand. Canadian exports to the EU face a dual challenge of over-reliance on sectors with weak import growth and struggling competitiveness relative to new entrants. The implementation of CETA offers Canadian exporters an opportunity to reverse some of these trends.
6. Canada’s Foreign Direct Investment Performance


Foreign Direct Investment Inflows and Outflows, 2017

Infographic 6.1 Text Alternative
| Foreign Direct Investment in Canada: Inflows (FDI) | Canadian Direct Investment Abroad: Outflows (CDIA) | |||
|---|---|---|---|---|
| 2017 ($M) | Growth (%) | 2017 ($M) | Growth (%) | |
| From the World | 31,462 | -36.4 | 99,910 | 2.5 |
| From the U.S | 23,172 | -14.4 | 81,893 | 12.0 |
| Trade and Transportation | 12,724 | 0.2 | 51,032 | 130.4 |
| Manufacturing | 9,825 | 94.5 | -833 | N/A |
| Other Industries | 7,336 | -6.2 | 14,684 | -36.8 |
| Finance and Insurace | 6,395 | -12.2 | 27,282 | 23.1 |
| Management of Companies and Enterprises | 4,196 | -27.5 | 10,390 | 516.3 |
| Mining and Oil and Gas Extraction | -9,014 | N/A | -2,647 | N/A |
Infographic 6.2 Text Alternative
| Foreign Direct Investment in Canada: Inflows (FDI) | Canadian Direct Investment Abroad: Outflows (CDIA) | |||
|---|---|---|---|---|
| Countries | 2017 ($M) | Growth (%) | 2017 ($M) | Growth (%) |
| United States | 404,473 | 4.2 | 504,771 | 4.9 |
| Netherlands | 91,883 | -5.4 | 32,606 | 11.0 |
| United Kingdom | 47,431 | 7.3 | 102,625 | 8.3 |
| Japan | 29,632 | -0.4 | 4,753 | -8.3 |
Infographic 6.3 Text Alternative
| FDI | CDIA | |||||
|---|---|---|---|---|---|---|
| Industry | Value 2017 ($M) | Share 2017 (%) | Change 2016-17 (%) | Value 2017 ($M) | Share 2017 (%) | Change 2016-17 (%) |
| Total, All Industries | 824,035 | 100 | 1.9 | 1,121,102 | 100 | 3.4 |
| Management of Companies and Enterprises | 170,885 | 20.7 | 2.1 | 140,858 | 12.6 | 5.1 |
| Manufacturing | 176,200 | 21.4 | -0.3 | 85,412 | 7.6 | -4.1 |
| Mining and Oil and Gas Extraction | 162,230 | 19.7 | -7.4 | 175,705 | 15.7 | -5.2 |
| Finance and Insurance | 136,974 | 16.6 | 8.0 | 395,783 | 35.3 | 3.0 |
| Wholesale Trade | 74,670 | 9.1 | 8.6 | 25,484 | 2.3 | -5.6 |
| Retail Trade | 35,790 | 4.3 | 4.3 | 13,192 | 1.2 | 38.3 |
| Professional, Scientific and Technical Services | 17,440 | 2.1 | -9.7 | 31,460 | 2.8 | 17.2 |
| Real estate and Rental Leasing | 13,447 | 1.6 | 21.4 | 63,179 | 5.6 | -0.2 |
| Transportation and Warehousing | 10,371 | 1.3 | 44.3 | 71,100 | 6.3 | 43.6 |
| Information and Cultural Industries | 8,853 | 1.1 | 26.1 | 48,975 | 4.4 | 7.3 |
| Accommodation and Food Services | 4,302 | 0.5 | 11.0 | 2,899 | 0.3 | -8.3 |
| Construction | 3,444 | 0.4 | -3.4 | 1,334 | 0.1 | 2.9 |
| Utilities | 2,784 | 0.3 | 26.5 | 32,148 | 2.9 | 2.5 |
| Agriculture, Forestry, Fishing and Hunting | 282 | 0.0 | 97.2 | 3,458 | 0.3 | -9.5 |
| Information and Communication Technologies | 15,828 | 1.9 | 10.1 | 25,971 | 2.3 | 16.7 |
Foreign direct investment (FDI) inflowsFootnote 6-1 into Canada declined by 36.4 percent in 2017, to $31.5 billion. This represented a combination of sharp overall declines in global FDI flows, especially in developed countries, and major divestitures by foreign-based companies in Canada’s oil sector, leading to a net negative investment (divestment) in mergers and acquisitions (M&A). While FDI inflows from the United States decreased somewhat, the decline was much sharper for inflows from the non-U.S. destinations.
By sector, the inflow of foreign investment in the mining and oil and gas extraction sector in 2016 changed to a comparable flow of divestment in 2017, as two large transactions saw ownership of oil sands assets change hands from foreign to Canadian owners. Foreign entities also decreased their inflows into management of companies and enterprises in 2017, as well as into other industries.Footnote 6-2 However, FDI inflows into the manufacturing sector almost doubled this year.
FDI inflows into the manufacturing sector almost doubled this year
Foreign investors marginally increased their cumulative holdings of direct investment (stock) in Canada in 2017, with the total reaching $824.0 billion. The United States held almost half (49.1 percent) of all FDI stock in Canada. By sector, manufacturing, and management of companies and enterprises were the two largest FDI targets overall, but different sectors drove the growth in 2017. FDI stock increased considerably in finance and insurance, wholesale trade, management of companies and enterprises, transportation and warehousing, and real estate industries.
Canadian direct investment abroad (CDIA), or FDI outflows, increased for the seventh consecutive year in 2017 and nearly reached $100 billion. For the second consecutive year, CDIA flows increased greatly in trade and transportation, which accounted for over half of total outflows in 2017. Flows also increased in management of companies and enterprises, and finance and insurance. A greater proportion of flows went to the United States in 2017 than usual (82.0 percent).
Canadian investors added to their direct investment holdings abroad (CDIA stock) in 2017, which reached over $1.1 trillion. The continuing slow growth in CDIA stock was due to the appreciation of the Canadian dollar against major currencies. North AmericaFootnote 6-3 was the recipient of 61.2 percent of CDIA stock, with four low-tax U.S. dollar jurisdictions (Bahamas, Barbados, Bermuda, and the Cayman Islands) together accounting for 14.0 percent of the overall CDIA stock. Finance and insurance, which remained the most important sector for CDIA, accounted for 35.3 percent of the overall stock in 2017, followed by mining and oil and gas extraction, at 15.7 percent.
Figure 6-1
Canada’s Net Direct Investment Position

Source: Statistics Canada, Table 376-0051
Figure 6-1 Text Alternative
| 2009 | 2010 | 2011 | 2012 | 2013 | 2014 | 2015 | 2016 | 2017 | |
|---|---|---|---|---|---|---|---|---|---|
| Outward FDI | 630.818 | 637.285 | 675.02 | 704.335 | 778.371 | 845.203 | 1,043.822 | 1,083.73 | 1,121.102 |
| Inward FDI | 573.901 | 592.406 | 603.455 | 633.778 | 688.873 | 744.671 | 782.912 | 808.738 | 824.035 |
| Net FDI position | 56.917 | 44.879 | 71.565 | 70.557 | 89.498 | 100.532 | 260.91 | 274.992 | 297.067 |
Canada’s net direct investment position – the difference between stocks of CDIA and inward FDI – expanded by $22.1 billion in 2017, to $297.1 billion (the highest on record). Canada continues to be a net exporter of direct investment vis-à-vis the world since 1997.
Foreign direct investment into Canada and Canadian foreign investment abroad continues to contribute significantly to national economic growth.Footnote 6-4 Foreign affiliates represented 11.8 percent of Canada’s total employment in 2015, conducted 52.8 percent of Canada’s total merchandise trade, and were responsible for almost half of total international transactions in services. Meanwhile, Canadian affiliates abroad allow Canadian companies to concentrate on headquarters activities in Canada while expanding their global reach.
Inward Investment
FDI Inflows
In 2017, total inflows of FDI into Canada declined by 36.4 percent to $31.5 billion. The decline was driven by two main factors: sharp overall declines in preliminary global FDI flows, especially in developed countries, and major divestitures by foreign-based companies in Canada’s oil sector. Net M&A inflows from abroad became negative, while other flows (mainly intra-company flows) from abroad decreased 38.9 percent, but reinvested earnings increased by 31.3 percent.
| 2016 C$M | 2017 C$M | Growth % | |
|---|---|---|---|
| Type of FDI Infows | |||
| From the world | |||
| Total net flows | 49,434 | 31,462 | -36.4 |
| Mergers and acquisitions | 10,159 | -4,636 | n/a |
| Reinvested earnings | 17,244 | 22,633 | 31.3 |
| Other flows | 22,031 | 13,464 | -38.9 |
| From the U.S. | |||
| Total net flows | 27,056 | 23,172 | -14.4 |
| Mergers and acquisitions | 4,870 | -3,190 | n/a |
| Reinvested earnings | 12,941 | 13,954 | 7.8 |
| Other flows | 9,247 | 12,410 | 34.2 |
| From the rest of the world | |||
| Total net flows | 22,377 | 8,289 | -63.0 |
| Mergers and acquisitions | 5,291 | -1,445 | n/a |
| Reinvested earnings | 4,303 | 8,679 | 101.7 |
| Other flows | 12,785 | 1,054 | -91.8 |
| Sectors of FDI inflows from the world | |||
| Mining and oil and gas extraction | 10,788 | -9,014 | n/a |
| Manufacturing | 5,051 | 9,825 | 94.5 |
| Trade and transportation | 12,702 | 12,724 | 0.2 |
| Finance and insurance | 7,285 | 6,395 | -12.2 |
| Management of companies and enterprises | 5,787 | 4,196 | -27.5 |
| Other industries | 7,822 | 7,336 | -6.2 |
Source: Statistics Canada, Tables 376-0121 and 376-0122
FDI inflows from the United States decreased by 14.4 percent, largely due to a reversal in net M&A activity from U.S. investors (negative inflows in 2017). Non-U.S. investors also decreased their total FDI inflows into Canada drastically (down 63.0 percent). M&A investment became divestment, reinvested earnings increased by 101.7 percent, but other flows decreased from $12.8 billion to $1.1 billion.
There have been many fluctuations from a sectoral standpoint, particularly in the energy sector with a sharp drop in FDI flows from a positive $10.8 billion in 2016 to a negative $9.0 billion in 2017. This decline results from divestments of oil assets, including two large-scale transactions by foreign investors to Canadian owners. Cenovus Energy agreed to acquire oil sands and conventional assets from ConocoPhillips for $17.7 billion.
Canadian Natural Resources Limited agreed to acquire oil sands assets from Royal Dutch Shell for $11.1 billion. Foreign investors also decreased their investments in management of companies and enterprises, in finance and insurance, and all other industries, while they increased their investments in manufacturing, and trade and transportation. In manufacturing, where foreign-owned firms have a substantial presence, FDI flows almost doubled in 2017 – from $5.1 billion to $9.8 billion.
Beyond year-to-year fluctuations, total annual FDI flows in the past five years (2013 to 2017) averaged $55.2 billion, a 36-percent increase from the previous five-year (2008 to 2012) average of $40.6 billion.
FDI Stock
The FDI stock in Canada rose by $15.3 billion (up 1.9 percent) to $824 billion in 2017. As the stock of FDI grew relatively more slowly than Canada’s nominal GDP (5.3 percent) in 2017, the ratio of FDI stock to GDP declined from 39.7 percent in 2016 to 38.4 percent in 2017.
Regionally, North America – comprising the United States, Mexico and the Caribbean region – and Asia and Oceania, were the only regions that posted an increase in FDI stock in 2017. The North America region’s FDI position rose by 4.6 percent ($18.9 billion) to $431.2 billion. Within the North America region, investors from the United States increased their holdings in Canada by $16.1 billion, to $404.5 billion. The U.S. share of Canada’s total FDI stock went up slightly, from 48.0 percent in 2016 to 49.1 percent in 2017. Although the United States continues to be by far the most important source of FDI in Canada, its relative share has fallen sharply over the last decade – from 56.3 percent in 2007 to 49.1 percent in 2017. The FDI landscape in Canada is far more diversified today than it was a decade ago.
The level of FDI stock from Asia and Oceania increased by 6.5 percent (up $5.0 billion) to reach $82.6 billion in 2017, accounting for 10 percent of Canada’s total FDI stock. The bulk of this expansion was led by a 228- fold increase from $17 million to $3.9 billion in FDI stock in Canada from the United Arab Emirates. China also reported a significant gain in its stock of FDI in Canada, rising by 7.5 percent (up $1.2 billion) to $16.4 billion.
The stock of FDI from Europe declined by 2.6 percent to reach $288.9 billion in 2017. This occurred as a result of significant decreases in FDI stock from the Netherlands (5.4 percent or $5.3 billion) to $91.9 billion, Switzerland (8.8 percent or $3.9 billion) to $40.2 billion and Spain (23.4 percent or $1.8 billion) to $5.8 billion. These losses offset notable gains from the United Kingdom (7.3 percent or $3.2 billion) to $47.4 billion and Norway (29.8 percent or $1.0 billion) to $4.4 billion. Europe, with more than a third (35.1 percent) of Canada’s overall FDI stock in 2017, remained the second-largest region holding FDI stock in Canada after North America.
| 2007 C$M | 2016 C$M | 2017 C$M | Share 2007 % | Share 2017 % | Change 2016-17 % | |
|---|---|---|---|---|---|---|
| All countries | 512,266 | 808,738 | 824,035 | 100.0% | 100.0% | 1.9% |
| North America | 293,655 | 412,297 | 431,215 | 57.3% | 52.3% | 4.6% |
| Bermuda | 2,099 | 13,662 | 13,942 | 0.4% | 1.7% | 2.0% |
| British Virgin Islands | 228 | 2,727 | 2,735 | 0.0% | 0.3% | 0.3% |
| Cayman Islands | n/a | 6,278 | 6,911 | n/a | 0.8% | 10.1% |
| United States | 288,257 | 388,336 | 404,473 | 56.3% | 49.1% | 4.2% |
| South & Central America | 14,524 | 19,865 | 19,196 | 2.8% | 2.3% | -3.4% |
| Brazil | 13,974 | 18,859 | 18,174 | 2.7% | 2.2% | -3.6% |
| Europe | 161,472 | 296,610 | 288,873 | 31.5% | 35.1% | -2.6% |
| France | 17,154 | 7,927 | 8,234 | 3.3% | 1.0% | 3.9% |
| Germany | 10,533 | 16,421 | 17,063 | 2.1% | 2.1% | 3.9% |
| Ireland | 828 | 6,215 | 6,341 | 0.2% | 0.8% | 2.0% |
| Luxembourg | 3,593 | 50,954 | 49,904 | 0.7% | 6.1% | -2.1% |
| Netherlands | 40,093 | 97,140 | 91,883 | 7.8% | 11.2% | -5.4% |
| Switzerland | 15,864 | 44,113 | 40,213 | 3.1% | 4.9% | -8.8% |
| United Kingdom | 56,838 | 44,211 | 47,431 | 11.1% | 5.8% | 7.3% |
| Africa | 2,352 | 2,415 | 2,168 | 0.5% | 0.3% | -10.2% |
| Asia/Oceania | 40,262 | 77,551 | 82,583 | 7.9% | 10.0% | 6.5% |
| Australia | 4,738 | 11,425 | 11,540 | 0.9% | 1.4% | 1.0% |
| China | 4,224 | 15,279 | 16,432 | 0.8% | 2.0% | 7.5% |
| Hong Kong | n/a | 12,315 | 12,431 | n/a | 1.5% | 0.9% |
| India | 1,988 | 3,245 | 3,057 | 0.4% | 0.4% | -5.8% |
| Japan | 13,572 | 29,759 | 29,632 | n/a | 3.6% | -0.4% |
| South Korea | 1,068 | 2,515 | 2,660 | 0.2% | 0.3% | 5.8% |
| United Arab Emirates | n/a | 17 | 3,874 | n/a | 0.5% | 2,2688.2% |
Source: Statistics Canada, Table 376-0051
The level of FDI stock in Canada from South and Central America decreased by 3.4 percent ($669 million) to $19.2 billion in 2017. Brazil, the major direct investor in Canada from the region, accounted for the bulk of this decline, with its FDI stock falling 3.6 percent ($685 million) to reach $18.2 billion.
In terms of overall standing, 2017 witnessed no changes in the ranks of the top 10 source countries of FDI in Canada from the previous year. As before, the Netherlands continued to rank as the second-largest direct investor in Canada (11.2-percent share of FDI stock), and Luxembourg, a major financial centre in the European Union, as the third-largest (6.1-percent share). The United Kingdom, with 5.8 percent of the FDI stock, was not as the fourth-largest direct investor, followed by Switzerland in fifth spot (4.9 percent), and Japan in sixth (3.6 percent). Brazil ranked seventh (2.2 percent) followed by Germany in eighth (2.1 percent), China in ninth (2.0 percent) and Bermuda in tenth (1.7 percent).
In recent years, a number of so-called low-tax jurisdictions have been playing an increasingly important role as sources of FDI in Canada and, conversely, as destinations for CDIA. In particular, Luxembourg in Europe and four offshore low-tax centres in the Caribbean – Barbados, Bermuda, British Virgin Islands, and the Cayman Islands – have steadily gained prominence. Collectively, the FDI holdings of the four Caribbean jurisdictions in Canada totalled $24.7 billion in 2017, or 3.0 percent of Canada’s total FDI stock, which is more than that of Brazil or Germany. The increase in the value of FDI stock from those low-tax jurisdictions may in fact be far more modest if FDI statistics were reported on the basis of the ultimate source of the investment as opposed to the immediate source of the investment, as is currently the case.Footnote 6-5 One potential implication of this phenomenon is that the level of FDI in Canada from key sources, such as the United States and other countries in Europe and Asia, may in fact be understated. U.S. and other direct investors may be channelling FDI in Canada through the low-tax jurisdictions in order to minimize their tax burden, but their investments are being attributed to those countries based on the current practice of linking FDI in Canada to the immediate source country. A study on sources of FDI in Canada by ultimate investing country in this chapter provides more information.
| 2007 C$M | 2016 C$M | 2017 C$M | Share 2007 % | Share 2017 % | Change 2016-17 % | |
|---|---|---|---|---|---|---|
| Total, all industries | 512,266 | 808,738 | 824,035 | 100.0% | 100.0% | 1.9% |
| Manufacturing | 162,031 | 176,696 | 176,200 | 31.6% | 21.4% | -0.3% |
| Management of companies and enterprises | 70,678 | 167,399 | 170,885 | 13.8% | 20.7% | 2.1% |
| Mining and oil and gas extraction | 97,785 | 175,134 | 162,230 | 19.1% | 19.7% | -7.4% |
| Finance and insurance | 69,905 | 126,833 | 136,974 | 13.6% | 16.6% | 8.0% |
| Wholesale trade | 46,867 | 68,741 | 74,670 | 9.1% | 9.1% | 8.6% |
| Retail trade | 14,510 | 34,301 | 35,790 | 2.8% | 4.3% | 4.3% |
| Professional, scientific and technical services | 9,510 | 19,324 | 17,440 | 1.9% | 2.1% | -9.7% |
| Real estate and rental and leasing | 5,190 | 11,081 | 13,447 | 1.0% | 1.6% | 21.4% |
| Transportation and warehousing | 3,817 | 7,188 | 10,371 | 0.7% | 1.3% | 44.3% |
| Information and cultural industries | 9,103 | 7,023 | 8,853 | 1.8% | 1.1% | 26.1% |
| Accommodation and food services | 4,648 | 3,876 | 4,302 | 0.9% | 0.5% | 11.0% |
| Construction | 2,988 | 3,565 | 3,444 | 0.6% | 0.4% | -3.4% |
| Utilities | 6,394 | 2,200 | 2,784 | 1.2% | 0.3% | 26.5% |
| Agriculture, forestry, fishing and hunting | 1,948 | 143 | 282 | 0.4% | 0.0% | 97.2% |
| All other industries | 6,893 | 5,235 | 6,364 | 1.3% | 0.8% | 21.6% |
| Information and communication technologies (ICT) | 13,794 | 14,381 | 15,828 | 2.7% | 1.9% | 10.1% |
Source: Statistics Canada, Table 376-0052
From a sectoral standpoint, two-thirds of the overall increase in Canada’s FDI stock in 2017 ($15.3 billion) was led by the finance and insurance sector, which rose 8.0 percent ($10.1 billion) to $137 billion in 2017. This was followed by wholesale trade with an increase of 8.6 percent ($5.9 billion) to $74.7 billion and management of companies and enterprises with a gain of 2.1 percent ($3.5 billion) to $170.9 billion. These gains offset losses in the mining and oil and gas extraction sector, which dropped 7.4 percent ($12.9 billion) to $162.2 billion in 2017, professional, scientific and technical services sector, which dropped 9.7 percent ($1.9 billion) to $17.4 billion, and manufacturing, which declined 0.3 percent ($496 million) to $176.2 billion.
In terms of the relative importance of sectors in total FDI, manufacturing maintained its top spot with a 21.4-percent share of FDI. Management of companies and enterprises with an FDI share of 20.7 percent replaced mining and oil and gas extraction for second place. Mining and oil and gas extraction itself assumed third place with a share of 19.7 percent, followed by finance and insurance (16.6 percent) and wholesale trade (9.1 percent). Together, these top five sectors accounted for 87.5 percent of total FDI stock.
Despite suffering from a long-term decline, the ICT sector saw a slight increase in its FDI stock
Among major industry trends over the past decade, the share of management of companies and enterprises in FDI experienced the biggest gains, rising from 13.8 percent in 2007 to 20.7 percent in 2017 while the share of manufacturing suffered the largest decline, shrinking by 10.2 percentage points over this period to 21.4 percent. Over the same 2007-2017 period, most other sectors saw marginal gains or losses in their respective shares of total FDI, ranging from a 0.9-percentage point loss in the share of utilities industries to a 3.0-percentage point gain for finance and insurance. Another notable development concerns the FDI performance of the information and communications technologies (ICT) sector – a special category representing a mix of goods and services producing industries that are R&D-intensive and an important driver of productivity growth. Despite a slight increase in this sector’s share of total FDI stock from 1.8 percent in 2016 to 1.9 percent in 2017, the share has been on the decline from a long-term perspective – from nearly 10 percent in 2000 to 2.7 percent in 2007, and sliding further to 1.9 percent in 2017.
At the Rainbow’s End: FDI by Ultimate Investing Country
In line with international standards, statistics on source countries of Foreign Direct Investment (FDI) have traditionally been compiled according to Immediate Investing Country (IIC), which is the last country through which the FDI transited before entering the domestic economy. While this measure is appropriate for evaluating the direct investment flows and corresponding funds exchanged between countries, it does not shed light on the real source of FDI when foreign investors channel their investment through companies in countries that are not the same as those of the Ultimate Investing Country (UIC) (see Figure 1).
Figure 1
Foreign Direct Investment Relationship

In the fourth edition of its Benchmark Definition of Foreign Direct Investment, the Organisation for Economic Co-operation and Development (OECD) recommended that countries compile statistics on the inward FDI stock on the basis of the UIC. This presentation allows countries to look through the complex ownership structure to see the country of the direct investor who ultimately controls the investment, or the ultimate beneficial owner of the investment. The presentation by UIC also sheds light on the issue of round-tripping, which occurs when funds that have been channelled abroad by resident investors are returned to the domestic economy in the form of direct investment.
Thirteen OECD countries reported 2016 data on the inward stock of FDI by UIC: Austria, Czech Republic, Estonia, Finland, France, Germany, Hungary, Iceland, Italy, Lithuania, Poland, Switzerland and the United States.
After undertaking a feasibility study to produce estimates of the stock of inward FDI by UIC for Canada in 2017, Statistics Canada released in April 2018 updated data on FDI stock by UIC and geographic source for the 2014-2016 period. From a regional perspective, the shares of North America and Asia and Oceania are up on a UIC basis (up 1.8 percentage points and 5.3 percentage points, respectively) while that of Europe is down by more than 12 percentage points, implying that the United States’ FDI and to a much larger extent Asian FDI is possibly being channeled through low-tax jurisdictions to Canada on an IIC basis.
Figure 2
Shares of FDI in Canada by IIC And UIC, 2016

Figure 2 Text Alternative
| UIC | IIC | |
|---|---|---|
| Africa | 0.2% | 0.3% |
| Other* | 3.5% | 0.0% |
| South and Central America | 4.2% | 2.5% |
| Asia/Oceania | 14.9% | 9.6% |
| Europe | 24.4% | 36.7% |
| North America | 52.8% | 51.0% |
The data show that the United States – which remains the dominant direct investor in Canada – actually increases its share of overall FDI in Canada by more than 4 percentage points on a UIC basis. Other countries with higher shares by UIC include the United Kingdom, Japan, Brazil, Germany and China. In contrast, as can be expected, substantial declines in stock of FDI to Canada from low-tax jurisdictions such as the Netherlands, Luxembourg, Switzerland and Bermuda also occur when investment is reallocated on a UIC basis. Round-tripping accounts for about 1 percent of FDI stock in Canada, suggesting that Canadian companies are rarely channeling funds through intermediate countries before investing back into Canada in the form of direct investment.
This new presentation is useful to better understand and assess investment strategies used by multinational organizations. It allows Canada to assess the country of the ultimate beneficial owner of the investment and to help better identify investment targets for FDI promotion.
Figure 3
FDI Stock in Canada by Immediate Investing Country (IIC), 2016, (%)

Figure 3 Text Alternative
| All countries | |
|---|---|
| US | 48.0% |
| Netherlands | 12.0% |
| Luxembourg | 6.3% |
| UK | 5.5% |
| Switzerland | 5.5% |
| Japan | 3.7% |
| Brazil | 2.3% |
| Germany | 2.0% |
| China | 1.9% |
| Bermuda | 1.7% |
| Other countries | 11.1% |
Figure 4
FDI Stock in Canada by Ultimate Investing Country (UIC), 2016, (%)

Figure 4 Text Alternative
| All countries | |
|---|---|
| US | 52.2% |
| UK | 6.0% |
| Japan | 5.0% |
| Brazil | 4.1% |
| Netherlands | 3.5% |
| Germany | 3.2% |
| Switzerland | 2.9% |
| China | 2.8% |
| Luxembourg | 2.3% |
| France | 1.7% |
| Canada (round-tripping) | 1.1% |
| Other countries | 15.1% |
Outward investment
Flows of Canadian Direct Investment Abroad (CDIA)
In 2017, Canadian investors increased their FDI outflows by 2.5 percent to $99.9 billion, more than three times the level of inflows invested in Canada during the year. In fact, 2017 marked the seventh consecutive year of growth in CDIA flows since they bottomed out in 2010 following the global financial crisis and the ensuing recession. In their recent recovery, CDIA flows have averaged $87.7 billion per year in the last four years (2014-2017), compared to $50.6 billion annually in the previous four years (2010-2013).
| 2016 C$M | 2017 C$M | Growth % | |
|---|---|---|---|
| By Region | |||
| To the world | |||
| Total net flows | 97,492 | 99,910 | 2.5 |
| Mergers and acquisitions | 57,702 | 64,586 | 11.9 |
| Reinvested earnings | 31,460 | 38,865 | 23.5 |
| Other flows | 8,328 | -3,541 | n/a |
| To the U.S. | |||
| Total net flows | 73,103 | 81,893 | 12.0 |
| Mergers and acquisitions | 44,097 | 58,398 | 32.4 |
| Reinvested earnings | 15,170 | 17,138 | 13.0 |
| Other flows | 13,835 | 6,357 | -54.1 |
| To the rest of the world | |||
| Total net flows | 24,388 | 18,016 | -26.1 |
| Mergers and acquisitions | 13,605 | 6,188 | -54.5 |
| Reinvested earnings | 16,290 | 21,724 | 33.4 |
| Other flows | -5,507 | -9,899 | 79.8 |
| Sector of CDIA outflows | |||
| Mining and oil and gas extraction | 19,825 | -2,647 | n/a |
| Manufacturing | 8,419 | -833 | n/a |
| Trade and transportation | 22,154 | 51,032 | 130.4 |
| Finance and insurance | 22,156 | 27,282 | 23.1 |
| Management of companies and enterprises | 1,686 | 10,390 | 516.3 |
| Other industries | 23,249 | 14,684 | -36.8 |
Source: Statistics Canada, Tables 376-0121 and 376-0122
By mode of investment, cross-border M&A were responsible for slightly under two thirds (64.6 percent) of CDIA flows in 2017 – a relatively higher share, on average, than that posted during the 2009-2017 period (54.7 percent). By destination, 61.8 percent of total CDIA flows from 2009 to 2017, on average, went to the United States, compared to 82.0 percent in 2017 alone.
By destination, Canadian investors increased their investment flows to the United States by 12.0 percent to $81.9 billion in 2017. M&A and reinvested earnings were on the rise, but other flows to U.S. affiliates were on the decline. M&A outflows decreased by 54.5 percent to the rest of the world, while reinvested earnings increased by 33.4 percent.
Canadian investors decreased their outflows of FDI into all sectors except in trade and transportation, finance and insurance, and management of companies and enterprises. Trade and transportation became the most important and dominant destination for Canadian outflows in 2017, with a 51.1-percent share.
Stock of CDIA
Canadian investors added $37.4 billion (3.4 percent) to their direct investment holdings abroad to reach $1,121.1 billion in 2017, following last year’s gain of 3.8 percent. The slowdown in the growth of the CDIA stock was due partly to the appreciation of the Canadian dollar against the U.S. dollar,Footnote 6-6 which had the effect of offsetting most of the strong investment activity in Europe and North America during the year.
All major regions, with the exception of South and Central America, posted increases in their CDIA stock positions in 2017. North America’s CDIA position rose by 1.9 percent ($13.1 billion) to $685.9 billion. Within North America, the United States – by far the most dominant destination for CDIA – accounted for 73.6 percent of the total CDIA stock in North America, and its direct investment position rose by 4.9 percent to $504.8 billion. As was the case in 2016, the growth of the CDIA stock in the United States was partly affected by the appreciation of the Canadian dollar against the U.S. dollar. The U.S. share of Canada’s total CDIA stock, however, held relatively steady, rising slightly from 44.4 percent in 2016 to 45.0 percent in 2017.
Canadian direct investment in Europe – the second most popular destination for CDIA – increased by 7.7 percent ($20.7 billion) to $288.4 billion. The expansion was the result of increases in several major countries, led primarily by the United Kingdom, which improved its CDIA position by 8.3 percent ($7.9 billion) to $102.6 billion, Switzerland, which increased sharply by $3.2 billion to $3.7 billion, the Netherlands, which rose 11.0 percent ($3.2 billion) to $32.6 billion, and Luxembourg, which increased its CDIA position by 3.2 percent ($2.4 billion) to $76.9 billion. These increases were largely the result of the depreciation of the Canadian dollar in 2017 against the euro (down 6 percent) and the British pound (down 2 percent).
Canada’s direct investment assets in Asia and Oceania increased by 4.9 percent ($3.9 billion); the increase was dominated by Hong Kong, Israel, and Singapore
Canada’s direct investment assets in Asia and Oceania – the third most important region for CDIA after North America and Europe – also gained ground, increasing by 4.9 percent ($3.9 billion) to $83.6 billion in 2017 (accounting for 7.5 percent of total CDIA stock). The increase was dominated by Hong Kong, which increased its CDIA position by 27.2 percent ($2.3 billion) to $10.6 billion, Israel, which rose 143.6 percent ($1.2 billion) to $2.0 billion, and Singapore, which improved its CDIA position by 9.3 percent ($483 million) to $5.7 billion.
| 2007 C$M | 2016 C$M | 2017 C$M | Share 2007 % | Share 2017 % | Change 2016-17 % | |
|---|---|---|---|---|---|---|
| All countries | 515,294 | 1,083,730 | 1,121,102 | 100.0% | 100.0% | 3.4% |
| North America | 310,632 | 672,794 | 685,898 | 60.3% | 61.2% | 1.9% |
| Bahamas | n/a | 24,736 | 24,479 | n/a | 2.2% | -1.0% |
| Barbados | 33,438 | 56,827 | 48,948 | 6.5% | 4.4% | -13.9% |
| Bermuda | 13,252 | 42,240 | 40,162 | 2.6% | 3.6% | -4.9% |
| Cayman Islands | 19,863 | 42,763 | 43,096 | 3.9% | 3.8% | 0.8% |
| Mexico | 5,100 | 14,878 | 15,090 | n/a | 1.3% | 1.4% |
| United States | 226,116 | 481,378 | 504,771 | 43.9% | 45.0% | 4.9% |
| South & Central America | 21,975 | 56,479 | 55,915 | 4.3% | 5.0% | -1.0% |
| Brazil | 7,687 | 12,477 | 11,555 | 1.5% | 1.0% | -7.4% |
| Chile | 7,067 | 16,238 | 17,103 | 1.4% | 1.5% | 5.3% |
| Colombia | 737 | 5,051 | 5,122 | 0.1% | 0.5% | 1.4% |
| Panama | n/a | 4,539 | 4,463 | n/a | 0.4% | -1.7% |
| Peru | 2,155 | 11,184 | 11,134 | 0.4% | 1.0% | -0.4% |
| Europe | 147,691 | 267,735 | 288,401 | 28.7% | 25.7% | 7.7% |
| Cyprus | 83 | 4,460 | 4,573 | 0.0% | 0.4% | 2.5% |
| France | 15,122 | 6,281 | 7,969 | 2.9% | 0.7% | 26.9% |
| Germany | 10,660 | 12,073 | 12,333 | 2.1% | 1.1% | 2.2% |
| Hungary | 9,336 | 5,111 | 5,297 | 1.8% | 0.5% | 3.6% |
| Ireland | 18,396 | 5,671 | 7,113 | 3.6% | 0.6% | 25.4% |
| Luxembourg | 3,311 | 74,513 | 76,932 | 0.6% | 6.9% | 3.2% |
| Netherlands | 7,027 | 29,386 | 32,606 | 1.4% | 2.9% | 11.0% |
| Spain | 3,414 | 5,507 | 6,414 | 0.7% | 0.6% | 16.5% |
| Sweden | 1,821 | 4,386 | 3,827 | 0.4% | 0.3% | -12.7% |
| United Kingdom | 60,919 | 94,745 | 102,625 | 11.8% | 9.2% | 8.3% |
| Africa | 5,126 | 6,994 | 7,250 | 1.0% | 0.6% | 3.7% |
| Asia/Oceania | 29,867 | 79,728 | 83,639 | 5.8% | 7.5% | 4.9% |
| Australia | 7,438 | 27,599 | 27,799 | 1.4% | 2.5% | 0.7% |
| China | 2,745 | 10,285 | 10,686 | 0.5% | 1.0% | 3.9% |
| Hong Kong | 4,304 | 8,369 | 10,647 | 0.8% | 0.9% | 27.2% |
| Mongolia | 248 | 6,651 | 6,653 | 0.0% | 0.6% | 0.0% |
| Singapore | 2,464 | 5,213 | 5,696 | 0.5% | 0.5% | 9.3% |
| Japan | 2,592 | 5,181 | 4,753 | 0.5% | 0.4% | -8.3% |
| Indonesia | 1,886 | 2,993 | 2,779 | 0.4% | 0.2% | -7.2% |
Source: Statistics Canada, Table 376-0051
In contrast to the other regions, the CDIA position of the South and Central American region declined by 1.0 percent (down $564 million) to $55.9 billion. The overall decrease was led by declines in the CDIA positions of Brazil, which dropped 7.4 percent ($922 million) to $11.6 billion, and Argentina, which declined by 19.6 percent ($636 million) to $2.6 billion. These decreases offset significant gains in Chile, which rose 5.3 percent ($865 million) to $17.1 billion, and Ecuador, which improved its CDIA position by 25.2 percent ($324 million) to $1.6 billion.
As with FDI in Canada, a notable feature of CDIA is the dominant role played by several so-called offshore low-tax jurisdictions that are especially concentrated in the Caribbean and continue to be popular destinations of CDIA, primarily because of their lax financial regulations and little or no taxation on income or capital that they impose on non-residents. Four such offshore tax-havens (Barbados, the Cayman Islands, Bahamas and Bermuda) continued to be among the top 10 destinations for CDIA in 2017; collectively, they accounted for 14.0 percent of Canada’s CDIA stock in 2017, up from 13.0 percent in 2007. A parallel development in the last decade has been the significant rise in the importance of Luxembourg for CDIA, primarily because of the huge tax incentives it offers multinationals from around the world. Luxembourg’s share of CDIA rose from a paltry 0.6 percent in 2007 to 6.9 percent in 2017. In 2017, Luxembourg and the four Caribbean low-tax jurisdictions together held $233.6 billion, or 20.8 percent, of Canada’s CDIA stock, up from about 13.6 percent in 2007.
| 2007 C$M | 2016 C$M | 2017 C$M | Share 2007 % | Share 2017 % | Change 2016-17 % | |
|---|---|---|---|---|---|---|
| Total, all industries | 515,294 | 1,083,730 | 1,121,102 | 1.0 | 1.0 | 0.0 |
| Finance and insurance | 168,926 | 384,155 | 395,783 | 0.3 | 0.4 | 0.0 |
| Mining and oil and gas extraction | 90,304 | 185,341 | 175,705 | 0.2 | 0.2 | -0.1 |
| Management of companies and enterprises | 76,020 | 134,002 | 140,858 | 0.1 | 0.1 | 0.1 |
| Manufacturing | 97,911 | 89,037 | 85,412 | 0.2 | 0.1 | 0.0 |
| Real estate and rental and leasing | 9,734 | 63,280 | 63,179 | 0.0 | 0.1 | 0.0 |
| Information and cultural industries | 13,357 | 45,636 | 48,975 | 0.0 | 0.0 | 0.1 |
| Transportation and warehousing | 14,896 | 49,529 | 71,100 | 0.0 | 0.1 | 0.4 |
| Utilities | 13,893 | 31,362 | 32,148 | 0.0 | 0.0 | 0.0 |
| Professional, scientific and technical services | 7,620 | 26,836 | 31,460 | 0.0 | 0.0 | 0.2 |
| All other industries | 3,049 | 29,745 | 30,115 | 0.0 | 0.0 | 0.0 |
| Wholesale trade | 6,166 | 26,989 | 25,484 | 0.0 | 0.0 | -0.1 |
| Retail trade | 5,485 | 9,541 | 13,192 | 0.0 | 0.0 | 0.4 |
| Agriculture, forestry, fishing and hunting | 3,608 | 3,819 | 3,458 | 0.0 | 0.0 | -0.1 |
| Accommodation and food services | 2,993 | 3,162 | 2,899 | 0.0 | 0.0 | -0.1 |
| Construction | 1,879 | 1,296 | 1,334 | 0.0 | 0.0 | 0.0 |
| All other industries | 3,049 | 29,745 | 30,115 | 0.0 | 0.0 | 0.0 |
| Information and communication technologies (ICT) | 15,081 | 22,250 | 25,971 | 0.0 | 0.0 | 0.2 |
Source: Statistics Canada, Table 376-0052
In 2017, several sectors posted improvements in their respective CDIA stock positions. Most notably, the transportation and warehousing sector posted the largest absolute increase in CDIA stock ($21.6 billion), followed by finance and insurance ($11.6 billion), management of companies and enterprises ($6.9 billion) and professional, scientific and technical services ($4.6 billion). Conversely, the largest absolute drop in CDIA stock occurred in mining and oil and gas extraction ($9.6 billion), with CDIA in all three of the sub-sectors contracting (oil and gas extraction, mining, and support activities).
As for sectoral distribution in 2017, CDIA stock continued to be largely concentrated in the finance and insurance sector (35.3 percent), followed at a distance by mining and oil and gas extraction (15.7 percent), management of companies and enterprises (12.6 percent), manufacturing (7.6 percent), and transportation and warehousing (6.3 percent). The traditionally dominant position of the finance and insurance sector in CDIA can be linked to the importance of offshore banking sectors in both the Caribbean and Luxembourg.
One of the significant long-term sectoral developments has been the marked reduction in the share of manufacturing in total CDIA, which declined from 19.0 percent in 2007 to 7.6 percent in 2016 – a drop of 11.4 percentage points. Offsetting shares accrued primarily to real estate, rental and leasing (up 3.7 percentage points) and transportation and warehousing (up 3.5 percentage points) over this period.
Activities of Majority-Owned Canadian Foreign Affiliates Abroad
Canadian firms often locate abroad to stay competitive, gain access to technology and other inputs and enhance their overall share of foreign markets. As illustrated in Figure 6-2, in 2015, sales of Canadian-controlled affiliates abroad were larger than traditional exports, totalling $634.1 billion or almost 100.8 percent of the value of goods and services exports. Sales of Canadian affiliates abroad grew 32.5 percent between 2011 and 2015, twice as fast as the growth of Canadian goods and services exports (16.3 percent).
Figure 6-2
Goods and Services Exports vs. Canadian Foreign Affiliates Sales (%), 2015

Source: Statistics Canada, Tables 376-0066 and 380-0070
Figure 2 Text Alternative
| Goods | Services | Total, B$ | |
|---|---|---|---|
| FA Sales | 46.7% | 53.3% | 634.10 |
| Exports | 83.5% | 16.5% | 628.96 |
By sector, manufacturing accounted for the largest share (27.9 percent) of affiliates’ sales in 2015, followed by firms in finance and insurance (17.2 percent), and mining and oil and gas extraction (16.1 percent).
By country, U.S.-located Canadian affiliates generated 57.3 percent of overall sales abroad in 2015, compared to 72.4 percent of exports of goods and services destined to the United States, underscoring the greater diversity in affiliates’ sales compared to traditional exports. Between 2011 and 2015, the United States also accounted for the bulk of growth in affiliates’ sales abroad (64.7 percent), followed by Sweden (4.4 percent), Hong Kong (3.5 percent), and Brazil (3.2 percent). An important point to note is that sales of Canadian affiliates in many distant markets, including Europe and Asia, were greater than the exports of goods and services to those markets.
Figure 6-3
Share of Total FDI Assets, by Industry, 2015 (%)

Source: Statistics Canada, Tables 376-0152 and 376-0066
Figure 3 Text Alternative
| Canadian Majority-Owned Affiliates Abroad | Foreign Majority-Owned Affiliates in Canada | ||
|---|---|---|---|
| Manufacturing | 4.1% | 19.4% | |
| Mining and oil and gas extraction | 10.0% | 14.4% | |
| Wholesale Trade | 0.8% | 8.6% | |
| Finance and Insurance | 70.8% | 28.7% | |
| Retail Trade | 0.5% | 3.1% | |
| Transportation and Warehousing | 2.3% | 1.1% | |
| Other | 11.5% | 24.8% |
Canadian firms have significantly more assets in the financial sector abroad (70.8 percent) relative to other industries and also demonstrate a strong tendency to invest in North America and the Caribbean (67.3 percent) compared to other geographical regions.
Activities of Foreign Affiliates in Canada
As Canada is an open economy receptive to foreign investment, foreign affiliates (FA) play a key role in Canada’s economic activity. They do so by contributing to international trade, employment, corporate assets, revenues and R&D. In 2015, FA conducted 52.8 percent of Canada’s total merchandise trade and almost half of total international transactions in commercial services. Total trade by FA grew 24.7 percent in merchandise trade and 52.5 percent in commercial services from 2010 to 2015.
Figure 6-4
Foreign Majority-Owned Affiliates in Canada as a Share of Manufacturing Employment , by Provinces, 2015 (%)
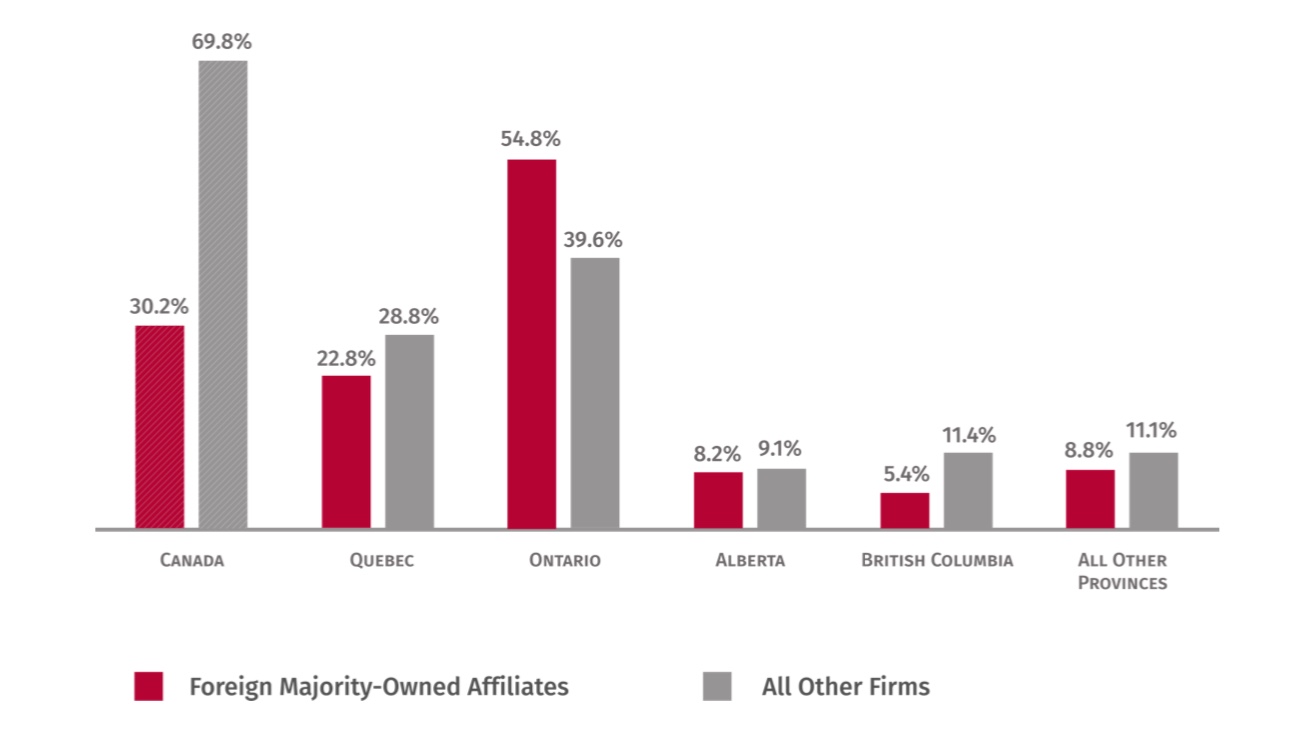
Source: Statistics Canada, Table 376-0153
Figure 4 Text Alternative
| Foreign Majority-Owned Affiliates | All Other Firms | |
|---|---|---|
| Canada | 30.2% | 69.8% |
| Quebec | 22.8% | 28.8% |
| Ontario | 54.8% | 39.6% |
| Alberta | 8.2% | 9.1% |
| British Columbia | 5.4% | 11.4% |
| All Other Provinces | 8.8% | 11.1% |
Table 6-7 illustrates the share of FA in the total merchandise exports in goods-producing industries (excluding construction). Notably, FA generate 51.5 percent of total manufacturing exports, with 85.4 percent of primary metal exports, 78.2 percent of transportation equipment exports, but only 26.1 percent of total mining, quarrying, and oil and gas extraction exports. Overall, FA were responsible for 42.8 percent of total merchandise exports, while Canadian firms held the majority with 57.2 percent. The role that FA play in international trade is explored further in the special study on foreign affiliate trade activity in this chapter.
In 2015, FA employed 1.9 million Canadians, of which Ontario accounted for the largest share (48.9 percent), followed by Quebec (16.3 percent), Alberta (14.7 percent) and British Columbia (10.3 percent). Between 2010 and 2015, the employment of Canadians by FA grew by 6.0 percent – more slowly than the 7.2-percent increase posted by Canadian-controlled firms – with FA in Alberta recording the fastest employment growth (19.6 percent), followed by Ontario (6.2 percent) and British Columbia (5.4 percent).
| FA Exports | Total Economy Exports | FA share of total exports | ||
|---|---|---|---|---|
| ($ Millions) | ($ Millions) | |||
| Utilities | 2,603 | 3,137 | 83.0% | |
| Manufacturing | 179,676 | 348,923 | 51.5% | |
| Textile Mills | 955 | 1,115 | 85.6% | |
| Primary Metal | 27,396 | 32,061 | 85.4% | |
| Transportation Equipment | 75,262 | 96,247 | 78.2% | |
| Beverage and Tobacco Product | 715 | 1,294 | 55.3% | |
| Plastics and Rubber Products | 7,605 | 13,906 | 54.7% | |
| Chemical | 20,046 | 38,083 | 52.6% | |
| Non-Metallic Mineral Product | 1,328 | 2,791 | 47.6% | |
| Printing and Related Support Activities | 554 | 1,233 | 44.9% | |
| Petroleum and Coal Product | 7,963 | 17,823 | 44.7% | |
| Food | 12,774 | 30,137 | 42.4% | |
| Paper | 7,685 | 18,358 | 41.9% | |
| Fabricated Metal Product | 2,483 | 10,064 | 24.7% | |
| Electrical Equipment, Appliance and Component | 1,590 | 7,183 | 22.1% | |
| Computer and Electronic Product | 3,807 | 17,300 | 22.0% | |
| Textile Product Mills | 125 | 643 | 19.5% | |
| Wood Product | 2,604 | 14,202 | 18.3% | |
| Machinery | 4,912 | 31,007 | 15.8% | |
| Miscellaneous | 1,139 | 7,587 | 15.0% | |
| Leather and Allied Product | 107 | 781 | 13.7% | |
| Furniture and Related Product | 594 | 5,348 | 11.1% | |
| Clothing | 32 | 1,760 | 1.8% | |
| Mining, Quarrying, and Oil and Gas Extraction | 29,215 | 111,882 | 26.1% | |
| Agriculture, forestry, fishing, and hunting | 533 | 31,701 | 1.7% | |
| Total | 212,027 | 495,642 | 42.8% |
Source: Statistics Canada, Tables 376-0152 and 180-0003
FA controlled 17.2 percent of Canada’s corporate assets in 2015, or $2.2 trillion, which was equivalent to roughly three times the value of the stock of FDI in Canada. Of all foreign-controlled assets, 52.1 percent were controlled by U.S. affiliates, 32.7 percent by European affiliates (dominated by U.K. affiliates), and 11.6 percent by Asia and Oceania. Given Canada’s deep integration with and proximity to the United States, it is therefore not surprising that U.S. affiliates play a significant role in the Canadian economy. By sector, FA in the finance and insurance sector accounted for 28.7 percent of total assets, followed by the manufacturing sector (19.4 percent) and mining and oil and gas extraction (14.4 percent).
In 2015, FA generated 27.1 percent of total operating revenues in Canada, with 55.3 percent of these under U.S. control. The manufacturing and the wholesale trade sectors contributed the most to the overall revenues of FA, accounting for 36.9 percent and 25.7 percent, respectively. Significant differences exist in the revenue-asset ratio between sectors. Retail trade and wholesale trade have the highest revenue-asset ratios (nearly 1.5), transportation and manufacturing are significantly above the average of 0.33 (including non-FAs), while the finance and the insurance sector is the lowest around 0.1.
By country, U.S.-controlled firms were the dominant source of jobs created by FA, employing 1.2 million Canadians, or 63.4 percent of total FA employment in 2015, followed by the United Kingdom (7.0 percent), France (4.8 percent), Japan (4.0 percent), and Switzerland (3.3 percent). By sector, in 2015, FA accounted for a significant share of Canada’s total employment in several key sectors, most notably in mining and oil and gas extraction and in manufacturing (about 30 percent each), followed by wholesale trade (28.2 percent) and retail trade (19.5 percent).
Most recent data show that foreign affiliates spent $6.4 billion on R&D, making up 34.5 percent of Canada’s total R&D expenditures
Foreign affiliates spent $6.4 billion on R&D, making up 34.5 percent of Canada’s total R&D expenditures in 2014,Footnote 6-7 with U.S. affiliates accounting for 62.3 percent of it, followed by the United Kingdom with 8.2 percent and France with 6.5 percent. There were 41,219 employees involved in foreign enterprises’ R&D activities in 2014. R&D intensity of foreign affiliates in 2014, as measured by R&D expenditures per R&D employee, amounted to more than $155,000 – nearly 40 percent higher than that of domestic firms.
Learning from Trading: What Motivates Foreign Affiliates in Canada
Foreign affiliates (FA) play a significant role in Canada’s international trade and are responsible for nearly half of all Canadian exports. The recent development of FA trade data by Statistics Canada provides some insights for exploring the major reasons why foreign-controlled firms establish a foothold in Canada. In general, economic literature points to several principal motivations as to why FA undertake foreign direct investment (FDI): access to resources; access to markets; or efficiency-seeking. The focus of this report is to examine the hypothesis that FA in Canada are primarily motivated by market access strategies. The research is made more difficult by the lack of sufficiently disaggregated data by country of control, but is made easier by the assumption that if FA seek market access via FDI in Canada, the market in question is likely the United States and the domestic market.
The study focuses on merchandise trade in goods-producing industries, where a large share of FA trade is conducted. The primary measure of analysis is the export-to-revenue ratio (EX/R ratio). The study finds that, in general, FA tend to be more export-oriented than Canadian firms across all industries, except in manufacturing, where FA are as likely to export as Canadian firms. FA controlled from Asia and Oceania participate substantially more in international trade than FA from all other regions. This observation can be explained by high export propensities among Japanese affiliates (and to a lesser extent affiliates from India), likely owing to highly export-oriented Japanese auto manufacturers that have located in Canada to serve the U.S. market. These findings are consistent with the market access hypothesis, but there are also signs of resource-seeking and efficiency-seeking motivations in the data.
Industry Comparison
Foreign affiliates tend to be more export-oriented than Canadian firms. While FA control 17.2 percent of all corporate assets in the Canadian economy, they generate 47.9 percent of all exports.Footnote m4-1 FA derive a greater share of revenue from exports (26.3 percent) than the Canadian economy does as whole (16.3 percent). Given this revealed preference among FA to sell abroad more than Canadian firms do, it is likely the case that foreign investors choose Canada as a place of operations owing to its proximity and access to the United States.Footnote m4-2
FA also exhibit a relatively higher propensity to export in goods-producing industries, however the gap between FA and all firms is smaller than in the total economy. Among FA, the EX/R ratio is 43.0 percent, compared to all goods producers at 36.0 percent.Footnote m4-3 In the non-manufacturing goods sector, the EX/R is 33.1 percent for FA and 23.8 percent for all firms. The propensity among Canadian firms to export in this sector is likely lowered by the Canadian-owned construction and utilities industries, which serve the Canadian market almost exclusively. Otherwise, this sector would report a higher propensity to export, owing to the export-oriented mining, oil and gas industry, where FA account for 36.8 percent of total assets. Investment in mining, oil and gas is primarily motivated by resource access.
A key finding is that in manufacturing, no appreciable difference exists between the EX/R ratios of FA (45.4 percent) and of all firms (46.0 percent).Footnote m4-4 This observation implies that FA exhibit virtually the same propensity to export to the U.S. market as do domestic firms in Canada’s manufacturing industry.
Figure 1
Exports as a Share of Revenue (EX/R), 2015

Figure 1 Text Alternative
| FA | Aggregate: All Firms | |
|---|---|---|
| Total economy | 26.3% | 16.3% |
| Goods-producing industries | 43.0% | 36.0% |
| Manufacturing goods-producing | 45.4% | 46.0% |
| Non-manufacturing goods-producing industries | 33.1% | 23.8% |
A closer examination of sub-industries within manufacturing reveals a high degree of variation in EX/R ratios. FA in primary metal and mineral manufacturing have the highest EX/R (75 percent) of all manufacturing industries and a significantly higher ratio than the aggregate in this industry (61 percent). In particular, this is driven by the primary metals industry whose FA EX/R of 97 percent is well above that of all firms at 80 percent.Footnote m4-5 This means that almost all primary metal produced by FA is sold abroad. Conversely, petroleum and coal products have the lowest FA EX/R (13 percent), which is slightly below the ratio for all firms operating in that industry (16 percent).Footnote m4-6 Petroleum and coal products is also the largest manufacturing industry, accounting for 20 percent of FA assets. Likewise, FA in agri-food also have a low propensity to export (23 percent). A similar analysis of import ratios among FA shows that both the agri-food and the petroleum and coal products industries also have a low propensity to import, which suggests that the majority of inputs are domestically sourced. This indicates that investment in these industries is motivated by both access to resources and access to the domestic markets.
Figure 2
Merchandise EX/R, by Manufacturing Subsector, 2015

Figure 2 Text Alternative
| FA | Total Economy | |
|---|---|---|
| Primary Metal & Mineral Mfg. | 75.0% | 60.9% |
| Transportation Equipment | 61.0% | 59.8% |
| Chemical Products | 56.5% | 67.1% |
| Wood & Paper Products | 52.4% | 48.0% |
| Misc Mfg. | 45.4% | 47.1% |
| Machinery & Equipment | 39.8% | 61.7% |
| Agri-Food Mfg. | 22.8% | 24.9% |
| Petroleum and coal products | 12.6% | 15.5% |
Transportation and Machinery and Equipment Industries
The available data is insufficient for definitive conclusions, but it does indicate that these two important industries should be of interest for further research. Transportation equipment is the most significant manufacturing industry in terms of both the share of FA exports (42 percent) and revenue (31 percent).On the surface, there appears to be little difference between EX/R ratios for FA (61 percent) and all firms (60 percent) in this industry. But in terms of industry composition, the two are very dissimilar. FA here comprise predominantly large car assembly plants, led by the “Big 5” (the Detroit Three, Honda and Toyota). These firms export finished vehicles to their retail locations in the United States. In contrast, Canadian-owned firms tend to be parts manufacturers (with the significant exception of Bombardier) that supply the assembly plants, many of which are located in the United States. The preliminary conclusion, therefore, is that the similar EX/R ratio relates to the presumably efficient allocation of industry and underlying specialization in production, almost indifferent to borders, under historically unfettered trade in autos between Canada and the United States.
On the other hand, the low EX/R for FA (40 percent) versus all firms (62 percent) in machinery and equipment is puzzling at first glance. Among possible explanations are data aggregation problems and local specialization. However, if that difference is not a measurement artefact, then it would mean that machinery and equipment FA established in Canada have a greater propensity to serve the Canadian market than the local firms. This points to a market access motive for the initial investment.
Overall, the evidence suggests that FA investment may be motivated by direct market access (i.e. to local market) and indirect market access (i.e. to foreign markets, in this case the United States). Evidence for direct market access can be seen in the agri-food, petroleum and coal products and machinery and equipment industries, where most of FA revenues are derived from sales in Canada. Evidence from other industries, e.g. primary metal and transportation equipment industries, suggests that FA also invest in Canada for indirect market access to the United States. Lastly, the fact that these latter FA invest indirectly also points to Canada’s advantages for foreign investment (otherwise investment would have been made directly into the United States) – indeed, Canada is known for having the lowest cost of doing business of the G7 countries.Footnote m4-7 This points to the efficiency-seeking motivation and is enabled by good trading relations, free trade agreements such as NAFTA, and the perception that investing in Canada is simultaneously investing in access to the large North American market.
Geographic Insights
The export propensity of FA from Asia and Oceania (77.6 percent) greatly exceeds the average for all FA (43.0 percent). This relatively high number is driven primarily by Japan (90.3 percent) and to a lesser extent by India (72.7 percent).Footnote m4-8 Japanese FA are significantly more likely to locate operations in manufacturing, which contains 77.8 percent of Japan’s FA assets in goods-producing industries, compared to 53.6 percent for FA from all countries. Manufacturing is also by far the most export-oriented industry. Finally, Japanese FA are major players in the Canadian automotive industry, which is highly export oriented. All these factors drive up the propensity among Japan’s FA to export.Footnote m4-9 Canadian auto manufacturing is highly export-oriented toward the U.S. market, and thus FA ownership in the auto industry is characteristic of the U.S. market access narrative. This also explains the high propensity among Japan’s FA to import, as auto manufacturers are known to import parts from the U.S. parts manufacturers located near the border.
Figure 3
Merchandise EX/R, Goods-producing Industries, 2015
Figure 3 Text Alternative
| Aggregate: All firms | 36.0% |
|---|---|
| All countries | 43.0% |
| Americas | 40.4% |
| Europe | 34.8% |
| Asia and Oceania | 77.6% |
The propensity to export for European FA is similar to that of all firms in the Canadian economy, but FA from the Netherlands and Ireland stand out as having exceptionally low EX/R ratios at 18.7 percent and 15.6 percent, respectively. This implies that initial investment into FA from these countries is likely motivated by direct market access. Interestingly, both countries are known to be low-tax jurisdictions. The United Kingdom has a notably high EX/R ratio of 48.8 percent.Footnote m4-10 This is due to a high degree of concentration in the export-oriented manufacturing sector, and a higher propensity to export in manufacturing.
Conclusions
This study of FA foreign trade finds some evidence that FA (and the initial investment in them) are motivated to set up in Canada for market access. In some cases, FA are motivated by direct market access opportunities (i.e. selling to Canadians), while in others the motivation is indirect access (i.e. selling abroad). But market access is likely not the only reason for investment in Canada. The choice to invest in Canada seems motivated by the interaction between market access, resource access, and efficiency seeking. Canada’s advantages in resources, labour costs, production efficiency etc. complement the market access motive differently in different sectors.
Significant differences in motive by country and by industry are observed. In particular, FA from Japan and India are likely motivated by indirect market access, while FA from the Netherlands and Ireland are more motivated by direct market access. The choice to invest in Canada for indirect market access is likely motivated by proximity to the U.S. market and free trade between Canada and the United States (e.g. auto industry). This reinforces the importance of free trade agreements in facilitating investment.
Canada’s Services Trade Performance
The Services Sector in Canada
Services have come to dominate the economies of all advanced countries. As of 2017, services accounted for 70.5 percent of Canadian GDP, up from 57.3 percent in 1961. Most of the increase in the services share of the economy took place in the 1960s and 1980s. Since then, the increase has been much more modest; the share in 2017 is only slightly above the 1992 level. When measured by employment, the rise of services is even more pronounced, increasing from 65.4 percent in 1976 to 79.0 percent by 2017. The fact that services account for a larger share of the economy when measured by employment rather than by GDP reflects lower labour productivity in the services sector compared to goods-producing sectors.
Figure 1
Services Share of Canadian GDP and Employment, 1961-2017
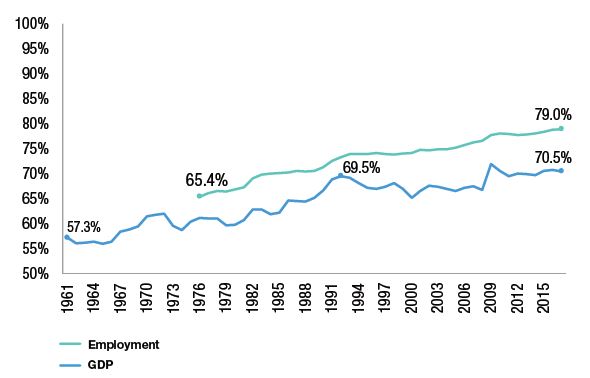
Source: Statistics Canada
Figure 1 Text Alternative
Services Share of Canadian GDP and Employment, 1961-2017
| 1961 | 1962 | 1963 | 1964 | 1965 | 1966 | 1967 | 1968 | 1969 | 1970 | 1971 | 1972 | 1973 | 1974 | 1975 | 1976 | 1977 | 1978 | 1979 | 1980 | 1981 | 1982 | 1983 | 1984 | 1985 | 1986 | 1987 | 1988 | 1989 | 1990 | 1991 | 1992 | 1993 | 1994 | 1995 | 1996 | 1997 | 1998 | 1999 | 2000 | 2001 | 2002 | 2003 | 2004 | 2005 | 2006 | 2007 | 2008 | 2009 | 2010 | 2011 | 2012 | 2013 | 2014 | 2015 | 2016 | 2017 | |
|---|---|---|---|---|---|---|---|---|---|---|---|---|---|---|---|---|---|---|---|---|---|---|---|---|---|---|---|---|---|---|---|---|---|---|---|---|---|---|---|---|---|---|---|---|---|---|---|---|---|---|---|---|---|---|---|---|---|
| Service Share GDP | 57.25% | 56.13% | 56.17% | 56.47% | 55.99% | 56.44% | 58.47% | 58.89% | 59.46% | 61.49% | 61.76% | 62.05% | 59.64% | 58.70% | 60.44% | 61.13% | 61.10% | 61.05% | 59.72% | 59.85% | 60.76% | 62.88% | 62.83% | 61.92% | 62.25% | 64.63% | 64.57% | 64.48% | 65.24% | 66.72% | 68.90% | 69.53% | 69.20% | 68.12% | 67.21% | 66.95% | 67.39% | 68.14% | 67.00% | 65.15% | 66.55% | 67.61% | 67.38% | 66.98% | 66.54% | 67.19% | 67.49% | 66.77% | 71.90% | 70.62% | 69.53% | 70.01% | 69.98% | 69.74% | 70.61% | 70.80% | 70.53% |
| Employment | 65.42% | 66.14% | 66.54% | 66.45% | 66.86% | 67.26% | 69.12% | 69.83% | 70.02% | 70.18% | 70.26% | 70.54% | 70.52% | 70.60% | 71.35% | 72.63% | 73.37% | 74.01% | 73.98% | 73.92% | 74.14% | 73.94% | 73.89% | 74.07% | 74.19% | 74.78% | 74.65% | 74.92% | 74.93% | 75.19% | 75.78% | 76.33% | 76.60% | 77.76% | 78.04% | 77.93% | 77.78% | 77.90% | 78.11% | 78.43% | 78.80% | 78.95% |
The share of services in the Canadian economy is smaller than in most other advanced countries. Economies with lower incomes per capita tend to have a lower share of services, although that does not explain Canada’s lower share. Rather, Canada has a remarkably diverse economy with both an above-average share of manufacturing, like Germany and Japan, and a high share of resources like Norway.
Real estate is the largest of the service sectors in Canada, when measured by contribution to GDP, and a sector for which there is minimal trade across borders. Public administration and other sectors that have large public components, namely education and health care, also account for a large share of service-sector GDP. These sectors will have traded components, most notably education, which will be covered later in this report, but as a share of their total value-added trade they represent a relatively small fraction. Service sectors that can largely be thought of as tradeable, such as finance and insurance, professional, and information and culture services, account for a relatively small share of services. The wholesale, retail, and transportation sectors might be thought of more as facilitating trade rather than tradeable in and of themselves.
Figure 1
Service Share of GDP – G7 and OECD, 2014

Source: OECD STAN Database, 2014
Figure 2 Text Alternative
Service Share of GDP – G7 and OECD, 2014
| 2014 | |
|---|---|
| Luxembourg | 86.84% |
| Greece | 80.35% |
| United Kingdom | 79.30% |
| France | 78.62% |
| United States | 77.88% |
| Netherlands | 77.65% |
| Belgium | 77.26% |
| Israel | 76.84% |
| Portugal | 76.03% |
| Denmark | 75.92% |
| Italy | 74.46% |
| Spain | 74.25% |
| Switzerland | 73.58% |
| Latvia | 73.30% |
| Sweden | 72.91% |
| Australia | 72.22% |
| New Zealand | 71.37% |
| Ireland | 71.05% |
| Japan | 71.03% |
| Iceland | 70.89% |
| Finland | 70.43% |
| Austria | 70.23% |
| Canada | 69.07% |
| Germany | 68.79% |
| Estonia | 67.79% |
| Slovenia | 64.85% |
| Hungary | 64.71% |
| Poland | 63.85% |
| Mexico | 63.48% |
| Chile | 62.88% |
| Slovak Republic | 61.13% |
| Turkey | 60.67% |
| Norway | 60.32% |
| Korea | 59.61% |
| Czech Republic | 59.37% |
The services sector is large and diverse and accounts for nearly four out of every five jobs in Canada. But, there can be, at times, a perception that service-sector jobs are inferior to those in other sectors; there is no doubt that some service-sector jobs are relatively low-paid. For example, jobs in accommodation and food, and retail (within wholesale and retail) are indeed relatively low-paid. Professional, finance and insurance, and information and cultural services, in contrast, are among the highest-paid sectors of the economy. In fact, these potentially tradeable services sectors all have average weekly wages above those in manufacturing and account for 50 percent more of the economy than does manufacturing: 15.6 percent of GDP vs. 10.5 percent of GDP for manufacturing. In tradeable services, wages are as much as 37 percent higher than in manufacturing.Footnote m5-1
Figure 3
Average Weekly Wages, 2017
Source: OECD STAN Database, 2014
Figure 3 Text Alternative
Average Weekly Wages, 2017
| Forestry | 1,123 |
| Resource Extraction | 2,018 |
| Utilities | 1,861 |
| Construction | 1,218 |
| Manufacturing | 1,097 |
| Wholesale & Retail | 745 |
| Transportation | 1,041 |
| Information & Culture | 1,280 |
| Finance & Insurance | 1,306 |
| Real Estate | 984 |
| Professional | 1,343 |
| Management | 1,639 |
| Business Services | 789 |
| Education | 1,041 |
| Health Care | 890 |
| Entertainment | 592 |
| Accommodation & Food | 383 |
| Other | 805 |
| Public Administration | 1,256 |
Value-added Trade and Servicification
As described in the body of this report, services account for 17.0 percent of Canada’s total exports. This is based on a simple measure of the value of goods and services as they cross the border, or what is known as gross exports. An alternative method of measuring the value of exports is to use value added. A car that crosses the border, for example, will contain many imported parts. On a value added basis, the value of imported inputs would be removed leaving only the value that was added in the domestic economy. Removing the value of imported inputs, because it impacts goods-producing sectors most, raises the share of services in exports to 28.7 percent. Similarly, a large share of the cost of producing that car comes not only from the automotive sector, but also from a number of additional supporting sectors, many of which are services – everything from the company hired to clean the offices and dispose of the garbage to financing and R&D. When measured on a value-added basis, the value of the product crossing the border is attributed to each of the sectors that contributed to its production. The net effect of making all of these changes to the way in which exports are measured greatly increases the share of services. On a value-added basis, services account for 45.2 percent of exports.Footnote m5-2
Figure 4
Services Share of Exports, 2017
Source: Statistics Canada, 2017
Figure 4 Text Alternative
Services Share of Exports, 2017
| Services in Gross Exports* | Services in Value-Added Exports** | Services embodied in Value-Added Exports** | |
|---|---|---|---|
| Services | 17.00% | 28.70% | 45.20% |
In most advanced countries, including Canada, manufacturing has become a declining sector of the economy. Some of that decline can be attributed to the manufacturing sector outsourcing activities to other sectors, most notably services.Footnote m5-3 For example, if a manufacturing firm employs accountants, the salaries of those workers contribute to the manufacturing sector. If, however, that same manufacturing firm hires an accounting company to do the same job, it now becomes part of the service sector. This outsourcing of services is more than just a statistical issue. As firms specialize, they have increased incentives to become more productive and to innovate. Even if not traded directly, these supporting services can make an important contribution to the competitiveness of the goods and services that are traded.Footnote m5-4 Having access to high quality and innovative services as both direct inputs as well as for facilitating trade, such as through efficient transportation systems, telecommunications systems, and finance, can have a significant effect on competitiveness.Footnote m5-5
In addition to goods-producing sectors outsourcing services, many are increasingly incorporating services into their products. The National Board of Trade in Sweden coined the term “servicification” to describe the growing share of services embodied in goods.Footnote m5-6 An often cited example is jet engines, which may be sold at, or even below, cost, with profits derived largely from the maintenance contracts. In some instances, the makers of the engines may not even charge for the engines themselves, but rather charge the aircraft manufacturer or airline for the use of the engine, such as per hour or distance travelled, blurring the line between manufacturing and services.Footnote m5-7 Higher profit margins and a more stable income flow are given as the reasons for the change in business model,Footnote m5-8 but it is the use of data that has facilitated the change. The ability to embed sensors in products allows for a constant stream of information about the status of the product and how it is being used. An additional benefit is that servicification changes the relationship between producer and consumer. Rather than a one-off sale, producers enter into a long-term relationship with the consumer allowing them to know more about how their product is used, which in turn creates a positive feedback loop to future innovation.
It is not possible to know how far such trends will go or what industries will follow the servicification model, but it is clear that as manufacturers increasingly buy, produce, sell and export services,Footnote m5-9 the line between goods and services will continue to blur.
The Services Sector in Canada
The share of services in Canada’s total trade has been rising, but the increase has not been steady – especially for imports. As of 2017, services accounted for 17.0 percent of Canada’s exports of goods and services and 19.4 percent of imports.Footnote m5-10 For exports, this is up sharply from 12.7 percent in 1990. For imports, however, it is up only marginally from 19.2 percent reached in 1991. For both exports and imports, the share of services dipped in the first half of the 1990s. These declines were likely the result of a rapid acceleration in goods trade linked to a rebound in the U.S. economy following the recession of 1989, and further boosted following the implementation of NAFTA in 1994. Since those dips, the shares of services in both exports and imports increased fairly steadily and were punctuated by spikes immediately following the global financial crisis; these spikes were due to a sharp drop in exports and imports of goods.Footnote m5-11
Figure 5
Services Share of Total Trade, 1981-2017

Source: Statistics Canada
Figure 5 Text Alternative
Services Share of Total Trade, 1981-2017
| 1981 | 1982 | 1983 | 1984 | 1985 | 1986 | 1987 | 1988 | 1989 | 1990 | 1991 | 1992 | 1993 | 1994 | 1995 | 1996 | 1997 | 1998 | 1999 | 2000 | 2001 | 2002 | 2003 | 2004 | 2005 | 2006 | 2007 | 2008 | 2009 | 2010 | 2011 | 2012 | 2013 | 2014 | 2015 | 2016 | 2017 | |
|---|---|---|---|---|---|---|---|---|---|---|---|---|---|---|---|---|---|---|---|---|---|---|---|---|---|---|---|---|---|---|---|---|---|---|---|---|---|
| Exports | 11.27% | 11.31% | 11.43% | 10.33% | 10.76% | 11.84% | 11.88% | 12.02% | 12.51% | 12.66% | 13.45% | 13.03% | 12.58% | 12.05% | 11.55% | 12.18% | 12.25% | 13.07% | 12.55% | 12.23% | 12.58% | 13.45% | 13.72% | 13.93% | 14.00% | 14.27% | 14.15% | 14.11% | 17.61% | 16.40% | 15.59% | 16.20% | 16.27% | 15.66% | 16.53% | 17.27% | 17.03% |
| Imports | 15.52% | 17.71% | 17.30% | 15.43% | 15.39% | 15.77% | 16.07% | 15.96% | 16.85% | 18.39% | 19.24% | 18.86% | 18.51% | 16.85% | 16.04% | 16.54% | 15.30% | 15.16% | 15.12% | 14.99% | 15.72% | 16.09% | 17.07% | 17.12% | 16.93% | 16.98% | 17.53% | 17.68% | 20.23% | 19.69% | 18.88% | 19.07% | 19.26% | 18.94% | 19.10% | 19.45% | 19.38% |
Figure 6
Growth in Services Exports by Major Region (Compound Average Annual Growth Rate)

Source: Statistics Canada
Figure 6 Text Alternative
Growth in Services Exports by Major Region (Compound Average Annual Growth Rate)
| 90s | 00s | 10s | |
|---|---|---|---|
| U.S. | 11.80% | 1.60% | 5.20% |
| UK | 9.80% | 2.30% | 4.50% |
| Other EU | 10.70% | 4.90% | 2.80% |
| Other OECD | 9.40% | 2.70% | 7.20% |
| Emerging | 7% | 6.10% | 5.80% |
Even for exports, the growth in services has not been even – there are significant differences in service export performance across regions and time periods. The period from 1990 to 1999 saw particularly rapid growth, with Canada’s service exports growing at an average annual rate of 10.5 percent for the decade with growth driven by advanced countries and spread relatively evenly among regions. Growth slowed considerably between 2000 and 2009 to a rate of just 2.9 percent. The overall rate was dragged down by two notable events in this decade – the first event occurred at the beginning of the decade with the bursting of the “dot-com bubble”; the second event was the global financial crisis at the end of the decade. The effects, however, were not evenly distributed among trading partner regions. Growth in services exports to emerging markets slowed only modestly from the previous decade whereas growth to advanced countries slowed sharply. Since 2010, Canadian service export growth picked up to 5.2 percent. Exports to emerging markets continued to slow, although modestly, from 7.0 percent in the 1990-1999 period, to 6.1 percent during the 2000-2009 period and to 5.8 percent in the most recent decade, but exports to these markets are still strong by most measures. With the exception of “other EU” countries (i.e. EU countries excluding the United Kingdom), which had a particularly slow recovery from the global crisis, growth picked up in all advanced regions compared to the 2000-2009 period.
Figure 7
Services Exports by Type, 1990-2017

Source: Statistics Canada
Figure 7 Text Alternative
Services Exports by Type, 1990-2017
| 1990 | 1991 | 1992 | 1993 | 1994 | 1995 | 1996 | 1997 | 1998 | 1999 | 2000 | 2001 | 2002 | 2003 | 2004 | 2005 | 2006 | 2007 | 2008 | 2009 | 2010 | 2011 | 2012 | 2013 | 2014 | 2015 | 2016 | 2017 | |
|---|---|---|---|---|---|---|---|---|---|---|---|---|---|---|---|---|---|---|---|---|---|---|---|---|---|---|---|---|
| Travel | 7,398 | 7,691 | 7,898 | 8,480 | 9,558 | 10,819 | 11,749 | 12,221 | 14,019 | 15,141 | 15,997 | 16,437 | 16,741 | 14,776 | 16,980 | 16,533 | 16,459 | 16,618 | 16,544 | 15,547 | 16,320 | 16,624 | 17,388 | 18,201 | 19,623 | 21,157 | 23,886 | 26,352 |
| Transport | 4,920 | 4,883 | 5,232 | 5,790 | 6,678 | 7,207 | 7,905 | 8,407 | 9,143 | 9,691 | 11,196 | 10,625 | 11,060 | 9,942 | 12,074 | 12,872 | 12,999 | 12,814 | 13,246 | 11,624 | 12,757 | 13,588 | 14,031 | 14,453 | 15,171 | 15,556 | 16,067 | 17,013 |
| Commercial | 8,510 | 9,203 | 10,193 | 11,978 | 13,721 | 15,357 | 17,970 | 20,445 | 24,750 | 26,664 | 31,095 | 31,849 | 34,877 | 36,970 | 38,525 | 41,917 | 44,144 | 44,991 | 48,606 | 49,502 | 48,490 | 52,577 | 56,274 | 59,014 | 61,989 | 65,705 | 67,366 | 67,849 |
| Government | 1,165 | 1,114 | 1,102 | 1,048 | 1,233 | 1,188 | 1,109 | 1,161 | 1,134 | 1,273 | 1,376 | 1,410 | 1,385 | 1,506 | 1,548 | 1,656 | 1,616 | 1,604 | 1,679 | 1,807 | 1,679 | 1,567 | 1,530 | 1,468 | 1,523 | 1,565 | 1,566 | 1,571 |
Within services trade there are four broad categories: commercial, travel, transportation, and government. Among Canadian services exports, commercial services are by far the largest component and have been the fastest growing. In 1990, commercial services accounted for only 38.7 percent of Canada’s total services; by 2017, that share had increased to 60.2 percent. Since 2010, however, the export share of commercial services has fallen slightly as growth slowed to an average annual rate of 4.9 percent. That rate still outpaced transportation, which grew at an average rate of 4.2 percent, but was handily outpaced by travel, which grew at a rate of 7.1 percent.
TRANSPORTATION SERVICES covers payments related to the international transportation of people or goods.Footnote m5-12 Passenger transportation includes fares and related expenditures for international transport of non-residents by resident carriers (exports) and residents by non-resident carriers (imports). For freight, by international convention, transportation costs up to the customs frontier are attributed to the exporting country, and costs beyond the customs frontier are attributed to the importing country.
Figure 8
Trade in Transportation Services, 1990-2016, $ Billions
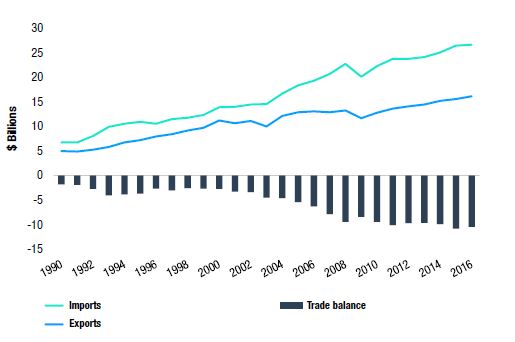
Source: Statistics Canada
Figure 8 Text Alternative
Trade in Transportation Services, 1990-2016, $ Billions
| 1990 | 1991 | 1992 | 1993 | 1994 | 1995 | 1996 | 1997 | 1998 | 1999 | 2000 | 2001 | 2002 | 2003 | 2004 | 2005 | 2006 | 2007 | 2008 | 2009 | 2010 | 2011 | 2012 | 2013 | 2014 | 2015 | 2016 | |
|---|---|---|---|---|---|---|---|---|---|---|---|---|---|---|---|---|---|---|---|---|---|---|---|---|---|---|---|
| Exports | 4,920 | 4,883 | 5,232 | 5,790 | 6,678 | 7,207 | 7,905 | 8,407 | 9,143 | 9,691 | 11,196 | 10,625 | 11,060 | 9,942 | 12,074 | 12,872 | 12,999 | 12,814 | 13,246 | 11,624 | 12,757 | 13,588 | 14,031 | 14,453 | 15,171 | 15,556 | 16,067 |
| Imports | 6,746 | 6,760 | 7,989 | 9,883 | 10,528 | 10,911 | 10,567 | 11,417 | 11,759 | 12,307 | 13,916 | 13,970 | 14,438 | 14,508 | 16,682 | 18,333 | 19,280 | 20,643 | 22,682 | 20,076 | 22,209 | 23,674 | 23,735 | 24,070 | 25,048 | 26,367 | 26,561 |
| Balance | -1,826 | -1,877 | -2,757 | -4,093 | -3,849 | -3,703 | -2,662 | -3,010 | -2,616 | -2,617 | -2,719 | -3,345 | -3,378 | -4,566 | -4,609 | -5,461 | -6,281 | -7,828 | -9,436 | -8,452 | -9,452 | -10,086 | -9,703 | -9,617 | -9,877 | -10,811 | -10,494 |
Canadian exports of transportation services grew rapidly in the 1990s, but then shifted to a lower growth path after 2000, largely moving in lockstep with slowing Canadian merchandise export growth. Imports, on the other hand, were growing at a comparable rate to exports in the 1990s but then accelerated between 2000 and 2007. Growth in imports of transportation services related to goods continued at the rapid pace of the previous decade, just as export growth was slowing, and on its own would have contributed to a widening trade deficit. But growth related to the movement of people accelerated in the middle of the decade, likely related to a change in the policy environment related to air travel that started to have an impact in the middle of the decade, and by accelerating the access of Canadians to foreign carriers, further widened the gap with exports.Footnote m5-13 Although potentially contributing to a widening of the transportation deficit, such policies, by reducing the cost of air travel thus facilitating the movement of goods and especially business people by air, have been shown to have a positive impact on both goods and services trade and likely foreign direct investment.Footnote m5-14 Since 2009, the deficit has once again levelled off.
Figure 9
Trade in Transportation Services, 1990-2016, $ Billions

Source: Statistics Canada
Figure 9 Text Alternative
Trade in Transportation Services, 1990-2016, $ Billions
| 1990 | 1991 | 1992 | 1993 | 1994 | 1995 | 1996 | 1997 | 1998 | 1999 | 2000 | 2001 | 2002 | 2003 | 2004 | 2005 | 2006 | 2007 | 2008 | 2009 | 2010 | 2011 | 2012 | 2013 | 2014 | 2015 | 2016 | |
|---|---|---|---|---|---|---|---|---|---|---|---|---|---|---|---|---|---|---|---|---|---|---|---|---|---|---|---|
| Exports | Passenger | 1,200 | 1,058 | 1,156 | 1,211 | 1,494 | 1,719 | 2,002 | 2,176 | 2,435 | 2,702 | 3,349 | 3,183 | 3,221 | 2,275 | 2,750 | 2,709 | 2,587 | 2,531 | 2,692 | 2,097 | 2,688 | 3,122 | 3,287 | 3,383 | 3,355 | 3,523 |
| Not | 3,720 | 3,825 | 4,076 | 4,579 | 5,184 | 5,488 | 5,903 | 6,231 | 6,708 | 6,989 | 7,847 | 7,442 | 7,839 | 7,667 | 9,324 | 10,163 | 10,412 | 10,283 | 10,554 | 9,527 | 10,069 | 10,466 | 10,744 | 11,070 | 11,816 | 12,033 | |
| Imports | Passenger | -2,371 | -2,341 | -2,575 | -2,972 | -2,968 | -3,293 | -3,491 | -3,695 | -3,748 | -3,716 | -3,986 | -4,130 | -3,977 | -4,157 | -4,875 | -5,717 | -6,185 | -6,936 | -7,062 | -6,889 | -7,466 | -7,764 | -7,966 | -8,159 | -8,087 | -8,355 |
| Not | -4,375 | -4,419 | -5,414 | -6,911 | -7,560 | -7,618 | -7,076 | -7,722 | -8,011 | -8,591 | -9,930 | -9,840 | -10,461 | -10,351 | -11,807 | -12,616 | -13,095 | -13,707 | -15,620 | -13,187 | -14,743 | -15,910 | -15,769 | -15,911 | -16,961 | -18,012 |
In addition to moving with the broad trend in goods trade, the composition of trading partners also has a significant effect on the transportation services deficit; more distant trading partners involve greater transport costs. By far the greatest contributor to the increase in Canada’s transportation services trade deficit is a sharp increase in the deficit for water transport with non-U.S. trade partners. As of 2016, Canada’s trade deficit in water transport with non-U.S. partners stood at $8.7 billion, or 82 percent of Canada’s overall trade deficit in transportation services. The next largest deficit is in air transport with the United States, at $2.8 billion, and is largely offset by a $1.7-billion surplus in land transport with the United States.
Transportation services are not only about the movement of goods, but also about the movement of people. Broadly speaking, growth in trade in transportation services related to the movement of people has not grown as quickly as that for goods, and exports have not grown as quickly as imports. Exports of passenger services have increased at an average annual rate of 4.6 percent since 1990 vs. 5.0 percent for imports. It is also notable that the fastest growth occurred in the 1990s for exports, but for imports accelerated in the period between 2000 and the start of the global financial crisis. Not surprisingly, air transportation accounts for the vast majority of international service imports related to the movement of people. As a percentage of bilateral trade, the deficit related to the movement of people is significantly greater than that for goods, but somewhat smaller in absolute terms.
Figure 10
Trade in Transportation Services, 1990-2016, $ Billions
Source: Statistics Canada
Figure 10 Text Alternative
Trade in Transportation Services, 1990-2016, $ Billions
| 1990 | 1991 | 1992 | 1993 | 1994 | 1995 | 1996 | 1997 | 1998 | 1999 | 2000 | 2001 | 2002 | 2003 | 2004 | 2005 | 2006 | 2007 | 2008 | 2009 | 2010 | 2011 | 2012 | 2013 | 2014 | 2015 | 2016 | |
|---|---|---|---|---|---|---|---|---|---|---|---|---|---|---|---|---|---|---|---|---|---|---|---|---|---|---|---|
| Exports | 7,398 | 7,691 | 7,898 | 8,480 | 9,558 | 10,819 | 11,749 | 12,221 | 14,019 | 15,141 | 15,997 | 16,437 | 16,741 | 14,776 | 16,980 | 16,533 | 16,459 | 16,618 | 16,544 | 15,547 | 16,320 | 16,624 | 17,388 | 18,201 | 19,623 | 21,157 | 23,886 |
| Imports | 12,757 | 13,753 | 14,255 | 14,359 | 13,678 | 14,093 | 15,353 | 15,873 | 16,029 | 16,975 | 18,337 | 18,344 | 18,223 | 18,526 | 19,876 | 21,870 | 23,396 | 26,422 | 28,645 | 27,680 | 30,895 | 32,974 | 35,030 | 36,161 | 38,005 | 38,525 | 38,096 |
| Balance | 5,359 | 6,062 | 6,357 | 5,879 | 4,120 | 3,274 | 3,604 | 3,652 | 2,010 | 1,834 | 2,340 | 1,907 | 1,481 | 3,750 | 2,896 | 5,338 | 6,937 | 9,804 | 12,101 | 12,133 | 14,574 | 16,351 | 17,643 | 17,960 | 18,382 | 17,368 | 14,210 |
TRAVEL SERVICES are in reality a mix of goods and services consisting of all purchases by individuals for own use or as gifts during visits to another country. This includes all spending, such as for lodging and food, but not the actual passenger fares, which are included under transportation services. Simply put, travel imports comprise spending by Canadians while traveling abroad while travel exports comprise the value of spending by foreigners while in Canada. In both cases, spending excludes the cost of transport to and from Canada.
The travel services deficit expanded significantly in the first decade of the new millennium after shrinking somewhat in the 1990s. The expansion of the deficit can be traced to three economic factors.Footnote m5-15 The first is the value of the Canadian dollar. A strong dollar makes it relatively less expensive for Canadians to travel abroad and more expensive for foreigners to travel to Canada while a weak dollar would have the opposite effect. In the opening years of the millennium, the Canadian dollar appreciated significantly from US$0.64 in 2002 to achieving parity with it in 2011. The Canadian dollar has weakened somewhat in the last few years, and a small uptick can be seen in exports and a levelling off of imports. The second factor was a tightening of the Canada- U.S. border in the years following the tragic events of 9/11 and the consequent sharp fall in travel receipts from the United States. General economic conditions can be considered the third factor that had an impact on trade in travel services. Canadians tend to spend more on travel when economic conditions in Canada are solid while foreigners will spend more when economic conditions in their own countries are strong. Historically, it was the economic situation in the United States that was most important for Canadian travel exports, with the bursting of the dot-com bubble around 2000 and the global financial crisis contributing to the decline in Canadian travel exports to the U.S. market in those years. More recently, strong growth in emerging markets, China in particular, is a likely contributor to the rapid increase in travel imports from non-U.S. sources. Although growth in Canadian travel spending (i.e. imports) in non-U.S. destinations has grown faster, Canadians still spend more on trips in the United States. Travel spending by non-U.S. foreigners in Canada (exports), on the other hand, now exceeds spending by Americans after years of steady growth and a dip in spending by Americans between 2002 and 2009. Over the past four years, growth by both groups (U.S. and non-U.S.) is now growing at similar rates. Canada does have large deficits for both U.S. and non-U.S. travel.
Figure 11
Travel Exports by Type, 1990-2016, $ Billions
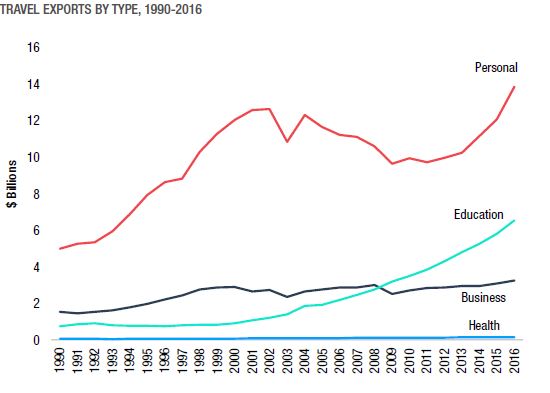
Source: Statistics Canada
Figure 11 Text Alternative
Travel Exports by Type, 1990-2016, $ Billions
| 1990 | 1991 | 1992 | 1993 | 1994 | 1995 | 1996 | 1997 | 1998 | 1999 | 2000 | 2001 | 2002 | 2003 | 2004 | 2005 | 2006 | 2007 | 2008 | 2009 | 2010 | 2011 | 2012 | 2013 | 2014 | 2015 | 2016 | |
|---|---|---|---|---|---|---|---|---|---|---|---|---|---|---|---|---|---|---|---|---|---|---|---|---|---|---|---|
| Business | 1,549 | 1,482 | 1,547 | 1,642 | 1,809 | 1,988 | 2,226 | 2,461 | 2,772 | 2,897 | 2,920 | 2,658 | 2,737 | 2,381 | 2,659 | 2,789 | 2,890 | 2,891 | 3,020 | 2,530 | 2,710 | 2,864 | 2,899 | 2,974 | 2,975 | 3,091 | 3,259 |
| Healtd | 68 | 68 | 68 | 66 | 70 | 86 | 87 | 88 | 90 | 92 | 94 | 98 | 100 | 103 | 106 | 117 | 121 | 126 | 130 | 135 | 141 | 145 | 148 | 150 | 158 | 162 | 163 |
| Education | 769 | 865 | 915 | 810 | 778 | 783 | 765 | 824 | 849 | 844 | 914 | 1,084 | 1,234 | 1,422 | 1,868 | 1,939 | 2,212 | 2,465 | 2,772 | 3,215 | 3,510 | 3,857 | 4,342 | 4,815 | 5,295 | 5,827 | 6,565 |
| Other Personal | 5,012 | 5,276 | 5,368 | 5,962 | 6,901 | 7,962 | 8,671 | 8,848 | 10,307 | 11,309 | 12,069 | 12,597 | 12,671 | 10,871 | 12,347 | 11,688 | 11,235 | 11,136 | 10,623 | 9,668 | 9,959 | 9,758 | 9,998 | 10,261 | 11,196 | 12,077 | 13,899 |
Travel spending by individuals is mostly for personal reasons, such as vacations. This type dominates spending by Canadians, accounting for 80.2 percent of the value of imports, but vacation spending is a somewhat less important source of foreign spending in Canada, accounting for 58.2 percent of travel exports in 2016. Probably because it is largely discretionary, this type of spending tends to be more volatile than other types with the shares varying considerably over time. Personal travel spending is even more dominant in its contribution to the trade deficit. Spending by Canadians abroad was more than two times as great as that spent by foreigners in Canada, a situation that is not likely to change until Canada improves its weather and builds the equivalent of the Louvre. After travel for personal reasons, business travelFootnote m5-16 is the next most important, though declining, share of travel exports. In 1990, business accounted for 20.9 percent of Canadian travel exports and 16.1 percent of imports; by 2016, these shares had fallen to 13.6 percent and 12.4 percent, respectively. Canada’s trade deficit in business travel has been a fairly stable share element of bilateral trade throughout the period. Travel for the purposes of education, while accounting for a small share of imports, is a fast-growing share of exports. From 2000 onward, travel exports related to education have grown at an average annual rate of 13.1 percent, far outpacing growth of travel service exports overall, which grew at an annual rate of 2.5 percent over the same period. As a result, Canada now has a large trade surplus in education, reaching $4.4 billion in 2016.Footnote m5-17 As recently as 2000, Canada had a trade deficit in this category, demonstrating just how quickly the trade situation can change. Travel spending for health reasons still accounts for a negligible share of both exports and imports.
Figure 12
Trade in Travel Services by Partner, 1990-2016, $ Billions
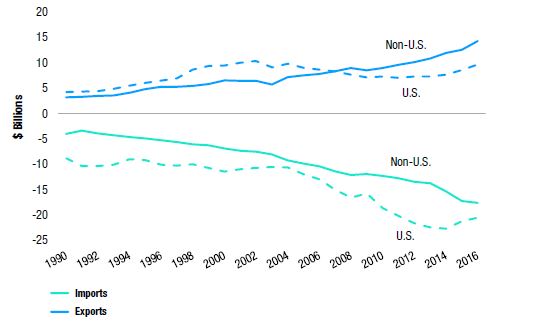
Source: Statistics Canada
Figure 12 Text Alternative
Trade in Travel Services by Partner, 1990-2016, $ Billions
| 1990 | 1991 | 1992 | 1993 | 1994 | 1995 | 1996 | 1997 | 1998 | 1999 | 2000 | 2001 | 2002 | 2003 | 2004 | 2005 | 2006 | 2007 | 2008 | 2009 | 2010 | 2011 | 2012 | 2013 | 2014 | 2015 | 2016 | |
|---|---|---|---|---|---|---|---|---|---|---|---|---|---|---|---|---|---|---|---|---|---|---|---|---|---|---|---|
| Exports | U.S. | 4,229 | 4,367 | 4,414 | 4,878 | 5,469 | 6,027 | 6,489 | 6,921 | 8,606 | 9,365 | 9,449 | 9,972 | 10,328 | 9,080 | 9,858 | 8,968 | 8,671 | 8,271 | 7,625 | 7,077 | 7,318 | 7,071 | 7,296 | 7,340 | 7,702 | 8,571 |
| Other | 3,169 | 3,324 | 3,483 | 3,601 | 4,089 | 4,792 | 5,260 | 5,300 | 5,412 | 5,776 | 6,548 | 6,465 | 6,413 | 5,696 | 7,122 | 7,565 | 7,788 | 8,347 | 8,919 | 8,469 | 9,002 | 9,553 | 10,092 | 10,861 | 11,921 | 12,586 | |
| Imports | U.S. | -8,786 | -10,347 | -10,338 | -10,068 | -9,044 | -9,144 | -10,062 | -10,280 | -9,951 | -10,685 | -11,410 | -11,027 | -10,693 | -10,512 | -10,654 | -12,019 | -12,998 | -15,023 | -16,537 | -15,756 | -18,607 | -20,202 | -21,614 | -22,429 | -22,661 | -21,241 |
| Other | -3,970 | -3,405 | -3,916 | -4,291 | -4,634 | -4,948 | -5,290 | -5,593 | -6,078 | -6,291 | -6,927 | -7,317 | -7,529 | -8,014 | -9,222 | -9,851 | -10,397 | -11,398 | -12,108 | -11,924 | -12,288 | -12,772 | -13,417 | -13,732 | -15,344 | -17,284 |
GOVERNMENT SERVICES cover any payments made by or to governments and international organizations including everything from payments for visas, to purchases by embassies and embassy staff. Government services will not be covered in any detail in this report. Trade in government services is relatively small, representing a shrinking share of Canada’s international trade in services.
COMMERCIAL SERVICES include a wide range of services with their common factor largely being that they are not included in other categories of trade. Commercial services are the fastest growing type of services exports by a wide margin - though not this year. The remainder of this feature will focus on trade in commercial services.
Figure 13
Trade in Commercial Services, 1990-2016, $ Billions

Source: Statistics Canada
Figure 13 Text Alternative
Trade in Commercial Services, 1990-2016, $ Billions
| 1990 | 1991 | 1992 | 1993 | 1994 | 1995 | 1996 | 1997 | 1998 | 1999 | 2000 | 2001 | 2002 | 2003 | 2004 | 2005 | 2006 | 2007 | 2008 | 2009 | 2010 | 2011 | 2012 | 2013 | 2014 | 2015 | 2016 | 2017 | |
|---|---|---|---|---|---|---|---|---|---|---|---|---|---|---|---|---|---|---|---|---|---|---|---|---|---|---|---|---|
| Exports | 8,510 | 9,203 | 10,193 | 11,979 | 13,721 | 15,357 | 17,970 | 20,445 | 24,750 | 26,664 | 31,095 | 31,849 | 34,876 | 36,970 | 38,525 | 41,917 | 44,144 | 44,991 | 48,606 | 49,502 | 48,490 | 52,577 | 56,274 | 59,014 | 61,989 | 65,705 | 67,366 | 67,849 |
| Imports | 11,385 | 12,035 | 12,769 | 15,258 | 17,387 | 18,333 | 20,599 | 22,307 | 25,789 | 28,323 | 30,948 | 32,141 | 34,907 | 36,681 | 37,636 | 37,934 | 39,208 | 40,349 | 42,912 | 46,006 | 47,067 | 48,202 | 51,766 | 54,872 | 58,395 | 63,395 | 66,346 | 66,925 |
| Balance | -2,875 | -2,832 | -2,576 | -3,279 | -3,666 | -2,976 | -2,629 | -1,862 | -1,039 | -1,659 | 147 | -292 | -31 | 289 | 889 | 3,983 | 4,936 | 4,642 | 5,694 | 3,496 | 1,423 | 4,375 | 4,508 | 4,142 | 3,594 | 2,310 | 1,020 | 924 |
Canadian exports of commercial services grew at an average annual rate of 8.0 percent since 1990, outpacing import growth, which expanded at an average rate of 6.8 percent. Canada’s trade in commercial services is also balanced; Canada ran a small trade deficit in commercial services in every year of the 1990s but then switched to a small surplus in the early 2000s, which it still keeps.
Figure 14
Canadian Commercial Service Exports by Region, 2016

Source: Statistics Canada, 2016
Figure 14 Text Alternative
Canadian Commercial Service Exports by Region, 2016
| Region | Share of total Exports, 2016 | Growth, 2000-2016 |
|---|---|---|
| United states | 61.90% | 99.50% |
| Europe | 19.50% | 173.30% |
| Antilles | 6.40% | 464.50% |
| Africa & MENA | 6.40% | 18.40% |
| Asia | 4.80% | 44.50% |
| South & Central America | 3.00% | 123.60% |
| Oceania | 1.30% | 194.30% |
Commercial service exports are less dependent on the United States than are goods exports, with 62.2 percent of commercial service exports bound for the United States in 2017 compared to 74.8 percent of goods exports.Footnote m5-18 In other ways, however, commercial services exports are less diversified than goods: in the same year, 39.9 percent of commercial service exports to non-U.S. destinations were bound for emerging markets compared to a slightly higher 42.4 percent for goods.Footnote m5-19 Canadian commercial service exports are more likely to go to other advanced countries. In addition to the high share for the United States, the EU receives an outsized portion of Canadian commercial service exports compared to that region’s share for goods. Even more importantly, growth in Canadian commercial service exports to the EU has been among the highest of any region resulting in its share increasing at a steady pace. Asia, on the other hand, received only 4.8 percent of Canadian commercial service exports in 2016, and the rate of growth since 2000 has been among the weakest. South and Central America has an even smaller share at 3.0 percent in 2016, and while growth is significantly higher than that for Asia, it is only on par with growth in commercial services overall and therefore that region’s share has not improved to any great extent. Africa’s share is even smaller and has seen the slowest growth of any region. A notable exception to the trend of most Canadian commercial service exports going to advanced economies is the Antilles,Footnote m5-20 which had the third-highest share of any region and by far the fastest growth. There is no doubt that this region’s role as a destination for foreign direct investment (FDI), including FDI from Canada, is the reason for this outsized performance.
Figure 15
Top Destinations for Canadian Commercial Service Exports (excluding the U.S.), 2016

Source: Statistics Canada, 2016
Figure 15 Text Alternative
Top Destinations for Canadian Commercial Service Exports (excluding the U.S.), 2016
| 2016 | Growth* 2010-16 | |
|---|---|---|
| United Kingdom | 4,397 | 7.0% |
| Bermuda | 2,025 | 14.6% |
| Switzerland | 1,838 | 13.1% |
| France | 1,367 | 4.9% |
| Germany | 1,106 | 5.0% |
| Ireland | 810 | 2.9% |
| Japan | 784 | 2.3% |
| Belgium/Lux | 766 | 14.2% |
| Netherlands | 746 | 9.1% |
| Australia | 687 | 6.7% |
| Mexico | 664 | 7.8% |
| Sweden | 658 | 4.0% |
| China | 562 | 3.6% |
| Hong Kong | 437 | 3.7% |
| Barbados | 402 | 2.5% |
An examination of the top destinations, excluding the United States, for Canadian commercial service exports reinforces the link between exports and advanced countries and financial centres. Of the top 15 destinations, the only economies that would not fall into one of these two groups is Mexico, ranked in 11th position, and China, at 13th. The remainder are all financial centres, such as Bermuda, Hong Kong, and Barbados, or rich economies, such as France, Germany, Japan, Australia, and Sweden. Alternatively, they could be considered a combination of the two, such as the United Kingdom, Switzerland, Ireland, Belgium and Luxembourg, and the Netherlands. As previously noted, Canadian commercial service exports are remarkably concentrated: the United States plus the next 15 most important destinations account for 87.5 percent of exports. The addition of a further 15 destinations adds only another 4.3 percentage points to the total.
Management services is the single most important type of Canadian commercial service exports and includes professional and management consulting services as well as payments between affiliates and parent companies. The most important sub-category of this group is legal services, which accounts for about one-tenth of Canadian exports in this category. Financial services, which follows management in importance, includes various fees, margins and commissions relating to the cross-border provision of financial services. In 2016, roughly 40 percent of the value of this category was accounted for by financial intermediation. Computer and information services includes hardware- and software-related services such as licences for using software, web-hosting, and payments for maintaining and repairing computer systems. Information services means access to databases, data storage and dissemination and news agency services. Computer services account for the vast majority of the value in this category. Technical services includes the cross-border delivery of architectural and engineering services, which account for just under half of Canadian exports in this category and a broad category of other technical services, including environmental services, which account for a little more than half of the value. Charges for the use of intellectual property (IP) is the single largest import category and fifth most important category of Canadian commercial service exports. This category is one of only five areas where Canada has a trade deficit and is by a wide margin the largest area of deficit. Charges for the use of IP includes a number of sub-categories. Canada has a deficit in all sub-categories, but by far the largest is related to patents and industrial design followed by software and other royalties, and franchises. Trademarks and copyrights are relatively small in terms of both deficits and in terms of importance for Canadian exports. Although Canada has a large deficit in IP, Canada has a sizable surplus in R&D that is related to the outright purchase or sale of ownership related to the outcome of R&D. Insurance is the fifth most important service import and yet another sub-sector in which Canada has a deficit. Most of that deficit is the result of a deficit within the re-insurance sub-category for which Canada has relatively few exports but sizeable imports, as opposed to primary life and non-life insurance, which account for a large share of exports.
Figure 16
Commercial Service Exports and Imports by Service Type, 2016, $ Billions

Source: Statistics Canada, 2016
Figure 16 Text Alternative
Commercial Service Exports and Imports by Service Type, 2016, $ Billions
| Exports | Imports | |
|---|---|---|
| Management Services | 13,065 | 12,519 |
| Financial | 10,813 | 10,945 |
| Computer & Information | 7,398 | 4,477 |
| Technical | 6,974 | 6,008 |
| IP | 5,574 | 14,057 |
| R&D | 5,532 | 1,569 |
| Services to Business | 4,005 | 3,000 |
| Telecom | 2,390 | 2,009 |
| Audio-visual | 2,334 | 2,593 |
| Non-financial commissions | 2,189 | 1,037 |
| Maintenance & Repair | 2,098 | 1,122 |
| Insurance | 1,739 | 4,637 |
| Advertising | 1,511 | 850 |
| Construction | 698 | 466 |
| Equipment Rentals | 683 | 840 |
| Cultural & Rec. | 365 | 216 |
Trade balances may provide an indication of comparative advantage. Overall, Canada has a small surplus in commercial services comprising surpluses in 11 sub-sectors (indicated in blue). The largest surpluses are in R&D, computer and information services, non-financial commissions and services to business. Five subsectors had deficits in 2016 (indicated in red) with the largest in IP and insurance. The two sectors accounting for most trade - management and finance - are in surplus and in deficit respectively, but as a share of total trade are rather small and as such could largely be considered as being in balance.
One feature that makes commercial services trade different from other types of trade in services is that a significant portion is intra-firm, that is, it takes place between parts of the same organization. The headquarters of a Canadian company, for example, may provide accounting services for an affiliate of that same company in a foreign country. This type of trade is considered affiliated trade, and is in contrast to non-affiliated trade that would occur if that same Canadian company provided accounting services to a company to which it was not related in a foreign country. Affiliated trade has been growing faster than non-affiliated trade for some time, and while for imports affiliated trade long since surpassed the non-affiliated kind, in 2005, affiliated exports surpassed non-affiliated exports for the first time. As of 2015, the year of the latest data available, affiliated exports of commercial services were 40 percent greater than non-affiliated exports.
Figure 17
Travel Exports by Business Type, 1990-2014, $ Billions

Source: Statistics Canada, 2016
Figure 17 Text Alternative
Travel Exports by Business Type, 1990-2014, $ Billions
| 1990 | 1991 | 1992 | 1993 | 1994 | 1995 | 1996 | 1997 | 1998 | 1999 | 2000 | 2001 | 2002 | 2003 | 2004 | 2005 | 2006 | 2007 | 2008 | 2009 | 2010 | 2011 | 2012 | 2013 | 2014 | 2015 | |
|---|---|---|---|---|---|---|---|---|---|---|---|---|---|---|---|---|---|---|---|---|---|---|---|---|---|---|
| Exports | Affiliated | 2,689 | 2,756 | 2,811 | 3,114 | 3,759 | 4,116 | 5,070 | 5,652 | 7,456 | 8,726 | 11,295 | 11,223 | 11,654 | 12,912 | 13,932 | 16,993 | 17,887 | 18,777 | 22,449 | 20,723 | 21,132 | 21,772 | 22,213 | 25,344 | 29,022 |
| Not | 3,864 | 4,163 | 4,784 | 5,683 | 6,576 | 7,318 | 7,830 | 9,253 | 10,804 | 12,098 | 13,811 | 14,203 | 15,150 | 15,151 | 15,415 | 16,536 | 16,107 | 15,263 | 16,078 | 17,285 | 15,974 | 18,843 | 21,345 | 20,999 | 19,753 | |
| Imports | Affiliated | -5,778 | -5,671 | -6,037 | -7,497 | -8,292 | -9,212 | -9,951 | -10,547 | -12,480 | -14,249 | -15,946 | -15,819 | -16,107 | -18,566 | -18,597 | -18,793 | -19,327 | -19,154 | -21,267 | -22,428 | -23,046 | -23,750 | -23,315 | -26,919 | -30,973 |
| Not | -4,100 | -4,652 | -4,983 | -5,552 | -6,555 | -6,611 | -7,807 | -8,295 | -9,374 | -10,068 | -10,923 | -11,567 | -12,680 | -12,172 | -13,130 | -12,527 | -13,192 | -14,387 | -15,008 | -16,153 | -15,039 | -15,908 | -19,088 | -18,160 | -16,777 |
In addition to services trade taking place within the organizational structure of the firm as affiliated trade, the third mode of cross-border services trade involves a foreign company establishing a local subsidiary or branch in order to deliver the service. On the surface, these “sales by affiliates” look to be more important than service exports. In the case of North America, which is dominated by the United States but also includes financial centres in the Caribbean that host a large amount of Canadian direct investment abroad, especially in the financial sector, sales by service affiliates are 3.7 times as large as exports. For other regions, sales by service affiliates are almost as dominant at 2.8 times as large as exports for Europe and 2.3 times as large for Asia. Only in Africa are exports greater than sales by service affiliates.
Figure 18
Service Exports vs. Sales by Affiliates Abroad, 2015, $ Billions

Source: Statistics Canada, 2015
Figure 18 Text Alternative
Service Exports vs. Sales by Affiliates Abroad, 2015, $ Billions
| Affiliate Sales | Exports | |
|---|---|---|
| North America and Caribbean | 234,699 | 63,712 |
| Europe | 56,675 | 20,337 |
| Asia/Oceania | 30,944 | 13,175 |
| South & Central America | 14,923 | 2,198 |
| Africa & ME | 470 | 4,237 |
The figures on sales by affiliates must be interpreted with caution as they measure the value of sales by the industry of the affiliate, which in this case is in services, but it does not imply that they are comparable to service exports as have been described in this feature. Retail trade, for example, is the second most important sector while wholesale trade ranks fourth, with the two together accounting for 27.1 percent of sales. These sectors have no comparable category within commercial service exports and are most likely in fact involved in selling goods. For all sales by affiliates, there is additionally the potential to double-count when comparing them to exports. As noted, more than half of service exports are to affiliated companies, the value of which may be counted within sales figures. Sales by Canadian affiliates may also return to Canada in the form of imports.
Figure 19
Service Sales by Affiliates Abroad, 2015

Source: Statistics Canada, 2015
Figure 19 Text Alternative
Service Sales by Affiliates Abroad, 2015
| Finance and insurance [52] | 109,170 | 32.33% |
|---|---|---|
| Retail trade [44-45] | 49,685 | 14.71% |
| Professional, scientific and technical services [54] | 47,771 | 14.15% |
| Wholesale trade [41] | 41,722 | 12.35% |
| Transportation and warehousing [48-49] | 37,919 | 11.23% |
| Information and cultural industries [51] | 22,620 | 6.70% |
| Other services (3) | 28,823 | 8.53% |
As a case in point, in addition to Canadian companies establishing affiliates abroad to reach foreign markets, foreign companies also establish affiliates within Canada, not only to reach the Canadian market but also to export. In fact, in 2015, 43.3 percent of Canadian commercial service exports were conducted by foreign companies in Canada; 25.8 percent of exports were by U.S. companies followed by 12.9 percent by European companies, and companies from other countries accounting for the remaining 4.5 percent.
Figure 20
Service Exports by Source, 2015

Source: Statistics Canada, 2015
Figure 20 Text Alternative
Service Exports by Source, 2015
| Service Exports by Source | ||
|---|---|---|
| Canadian | 37,286 | 56.7% |
| U.S. | 16,981 | 25.8% |
| Europe | 8,499 | 12.9% |
| Asia | 2,556 | 3.9% |
| ROW | 383 | 0.6% |
Measurement of Services Trade
It is sometimes claimed that services trade is not well measured. This perception likely comes from a comparison to trade in goods for which there is much more detail in terms of partners and products. Information about the goods trade is also timelier with statistics updated on a monthly basis. It may also be that people can imagine measuring a car crossing the border but have a more difficult time understanding how something non-tangible, such as exports of architectural services, could be well measured. Although there is room for improvement, there is no evidence of a systematic under-estimation of cross-border trade in services.
Information on trade in goods starts with customs documents: import and export declarations that contain detailed information on the good that is crossing the border. Statistics on the imports of goods are the gold standard given the incentive of customs officials to undertake inspections for security, duty collection, and other reasons. Statistics on services trade, on the other hand, are collected by survey.Footnote m5-21 Due to concerns about the burden put on survey responders and that surveys that are too long or complex will result in non-responses or incorrect information, it is only possible to undertake infrequent and relatively simple surveys. Increasingly, administrative data are used to supplement information sourced from surveys, allowing for surveys to become shorter and thus easier for respondents to complete while also improving data quality. While comparisons may be made between goods and services trade, goods trade is an exception; the methods used for measuring trade in services are comparable to those used to measure most other business and economic statistics including such core statistics as the calculation of GDP.
Measuring trade in services does have its own challenges. Unlike for goods, it is commonly understood that for services, exports may be measured more accurately than imports. This is the case because it is often easier to identify, and thus survey, the producer of the service than the consumer who may be more difficult to identify. Most architectural services, for example, will be delivered by architectural firms, while nearly any business or individual could potentially consume architectural services. One priority for the improvement of cross-border services trade statistics relates to digital trade and in particular the consumption of services by individuals through platforms such as Airbnb, Uber and Netflix, but also cloud computing services and software as a service.
Gathering more information by partner and by product is also a priority for improving services trade data, with a number of improvements made in recent years and reflected elsewhere in this feature. Increased use of administrative data, and other innovations, is allowing data to be presented for more trading partners, with increased detail on the type of services being traded, and in a more timely fashion, with further improvements expected going forward.
One of the most significant innovations in international trade analysis in recent years has been work based on the characteristics of exporters. This analysis has shown, for example, that relatively few exporters account for the vast majority of export value and that relatively few companies engage in exporting. The heterogeneous, or “new new”, theory of trade evolved from this work. Such data in most countries, including Canada, have been based only on goods trade. Comparable data on the characteristics of firms participating in trade in services would expand such analysis beyond the goods sector, which is a shrinking component of most economies. Negotiators of trade agreements face a unique challenge when it comes to services in that there are potentially four modes of supply that are addressed in trade agreements. Currently very limited data are available on mode of supply for services.
While service exports are no more poorly measured than most business or economic statistics, there is still room to improve. Statistical agencies recognize many of the concerns that are frequently raised with respect to services trade statistics and are actively working to improve the statistics on a number of fronts.
International Performance
In 2017, Canada ranked as the 18th most important exporter of commercial services globally. At 1.6 percentFootnote m5-22 of global service exports, this ranks well below benchmarks such as Canada’s share of global output (2.0 percent)Footnote m5-23 and of merchandise trade (2.4 percent).Footnote m5-24 In 2017, the United States was the single largest exporter of services, followed by the United Kingdom – both well known for their services exporting prowess. The Netherlands, India, and Ireland all “punch above their weight” in services in terms of their share of service exports relative to their share of GDP. The Netherlands and Ireland are both top destinations for foreign direct investment (FDI); the former is also a top source for FDI. India is well known as a destination for the offshoring of business services. By contrast, Germany’s and Japan’s rankings for services are both well below their rankings for goods. China’s share of global services exports also ranks well below its share for goods, but does not rank poorly given its current level of development. Chapter 2 of the State of Trade gives more details on global services exports.
Figure 21
Canada’s Share of Global Commercial Service Exports
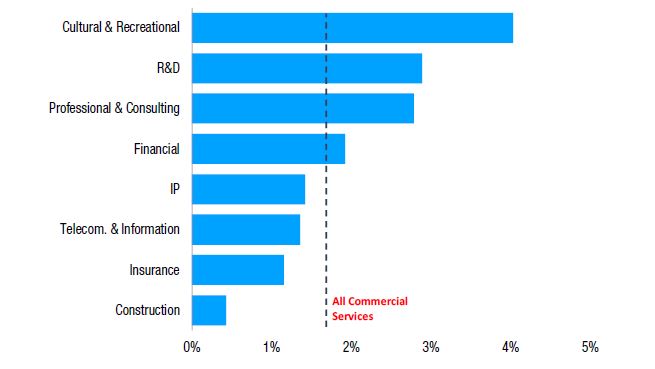
Source: WTO
Figure 21 Text Alternative
Canada’s Share of Global Commercial Service Exports
| Share | |
|---|---|
| Construction | 0.43% |
| Insurance | 1.16% |
| Telecom. & Information | 1.36% |
| IP | 1.42% |
| Financial | 1.92% |
| Professional & Consulting | 2.79% |
| R&D | 2.89% |
| Cultural & Recreational | 4.03% |
Canada has an above-average export share in cultural and recreational services, R&D, professional and consulting, and financial services. More detailed descriptions of these service categories are provided in the Commercial Services section of this report. International comparisons can be difficult: many countries do not report timely data for trade in commercial services or in some cases do not report services trade data at all. Furthermore, when data are reported, there can be important differences in how sub-sectors are defined. For these reasons, Canada’s competitiveness in commercial services is examined in two specific markets – the United States and the EU – which allows for the use of a single source of data for each market. The United States and the EU are the world’s two largest markets for commercial services and by far the most important destinations for Canadian commercial services.
Canada in the U.S. Service Market
Canada’s share of U.S. service imports stood at 6.1 percent in 2017, well below Canada’s share of U.S. goods imports, which was 13.0 percent that year. Canada’s share of U.S. service imports is down from 8.4 percent in 2000, a decline of about one-quarter, but it is a smaller decline than was the case for goods, which fell by one-third. Canada is the fourth most important source of U.S. service imports, behind the United Kingdom, Germany and Japan, whereas for goods, Canada is second, behind China. U.S. service imports generally are much more diversified than for goods. In services, the top five countries account for 34.1 percent of imports, whereas for goods, the top five account for 58.8 percent of total imports. The United States is, by a wide measure, the most important destination for Canadian service exports.
Figure 22
Canada’s Share of U.S. Imports, 1999-2017

Source: Statistics Canada
Figure 22 Text Alternative
Canada’s Share of U.S. Imports, 1999-2017
| Goods | Services | |
|---|---|---|
| 1999 | 19.43% | 8.60% |
| 2000 | 18.96% | 8.44% |
| 2001 | 18.95% | 8.32% |
| 2002 | 18.05% | 8.18% |
| 2003 | 17.65% | 8.25% |
| 2004 | 17.45% | 7.49% |
| 2005 | 17.35% | 7.42% |
| 2006 | 16.30% | 7.01% |
| 2007 | 16.11% | 6.90% |
| 2008 | 15.98% | 6.35% |
| 2009 | 14.43% | 6.12% |
| 2010 | 14.53% | 6.68% |
| 2011 | 14.34% | 7.00% |
| 2012 | 14.32% | 6.89% |
| 2013 | 14.75% | 6.68% |
| 2014 | 14.92% | 6.27% |
| 2015 | 13.32% | 5.93% |
| 2016 | 12.84% | 5.93% |
| 2017 | 12.96% | 6.09% |
A commonly used technique for identifying in what sectors a country has comparative advantage is to use a measure of revealed comparative advantage. Using revealed comparative advantage measures is a challenge in services trade as the data are not always available, and categories of trade are not perfectly comparable across countries at a meaningful level of detail. As such, two simpler measures are used to identify where Canada may have a comparative advantage in services, and the analysis will focus on two specific partners: the United States and the European Union.
Simple trade balances are one potential indicator of comparative advantage. Where there is a surplus, by definition, there are more exports than imports (see “Balance” method reported in table). This method might be interpreted as measuring if Canada has an advantage vis-à-vis the United States (as opposed to having an advantage over other countries trading within the U.S. market). Overall, Canada has a sizeable trade deficit with the United States in services trade reflecting U.S. strength in services. By this measure, expressed in the table as a percentage of bilateral trade, Canada has surpluses in only four sectors: R&D services, “other” technical services, accounting, and computer services. Canada’s overall deficit in services, expressed as a share of bilateral trade, is 28.6 percent. If this is used as a baseline, there are another five sectors where Canada’s deficit is below 28.6 percent and thus may be thought of as having a weak comparative advantage.
Figure 23
U.S. Top Sources of Service Imports, $ Billions

Source: Statistics Canada
Figure 23 Text Alternative
U.S. Top Sources of Service Imports, $ Billions
| 2016 | |
|---|---|
| Hong Kong | 8,748 |
| Netherlands | 9,794 |
| Korea | 10,974 |
| Italy | 11,339 |
| China | 16,139 |
| France | 16,451 |
| Ireland | 16,917 |
| Switzerland | 23,763 |
| Mexico | 24,569 |
| Bermuda | 24,629 |
| India | 25,808 |
| Canada | 29,950 |
| Japan | 31,004 |
| Germany | 33,395 |
| UK | 51,698 |
A second measure of comparative advantage is similar to traditional measures of revealed comparative advantage and uses Canada’s overall share in services in U.S. imports as a baseline. Those sectors in which the share exceeds this baseline might be said to have a comparative advantage (see “Import Share” method in table). This method may be best thought of as assessing if Canada has an advantage compared to other (i.e. third) countries in the U.S. market. By this measure, Canada has an advantage in 12 sectors - including all but one of the sectors identified using the “balance” method.
| Balance | Import Share | |
|---|---|---|
| Advertising | -85.3 | 0.6 |
| Education | -73.1 | -3.7 |
| Intellectual Property | -70.5 | -2.8 |
| Leasing | -70.1 | -2.0 |
| Legal | -65.6 | 1.1 |
| Insurance | -59.2 | -4.9 |
| Financial Services | -52.3 | 1.9 |
| Information | -51.2 | 1.4 |
| Industrial Engineering | -42.0 | -2.3 |
| Construction | -28.1 | 1.5 |
| Architectural | -27.8 | 1.3 |
| Telecom | -26.4 | 0.0 |
| Maintenance & Repair | -17.2 | 10.7 |
| Business & Consulting | -6.9 | 1.0 |
| Computer | 21.5 | 5.3 |
| Accounting | 34.1 | 6.3 |
| Other Technical | 44.2 | 8.7 |
| Research and Development | 67.6 | 0.0 |
Balance: Canada’s surplus (deficit) with U.S. as % of total trade
Import Share: Percentage points by which import share is greater (less) than import share of total services
Source: U.S. Bureau of Economic Analysis
Canada in the EU Service Market
Unlike in the United States, where Canada’s share of goods imports is significantly larger than that for services, Canada’s share of both EU service and goods imports amounted to 1.7 percent in 2016. Also unlike in the United States, where Canada’s share of both goods and services has been on the decline, Canada’s share of EU services imports has been gradually decreasing, from 2.2 percent in 2010, while the share of goods imports has remained steady over the same time period.Footnote m5-25 In 2016, Canada was the tenth most important source of EU service imports (excluding intra-EU trade). The United States stands out as by far the largest source of external EU imports of services. As a rough benchmark, the Canadian economy is about one-tenth the size of the U.S. economy; however, EU imports from the United States are more than 18 times as great as those from Canada indicating the relatively strong performance of the United States in services. Switzerland also stands out for its large share of EU service imports, but given it unique location surrounded by EU countries and long history of strength in financial services, it is not as useful to make comparisons with Canada. In terms of diversification of sources, EU service imports are slightly less diverse than goods imports; the top five countries account for 53.8 percent of total service imports, whereas the top five account for 52.7 percent for total goods imports.
Figure 24
EU Top Sources of Service Imports, 2016, € Billions
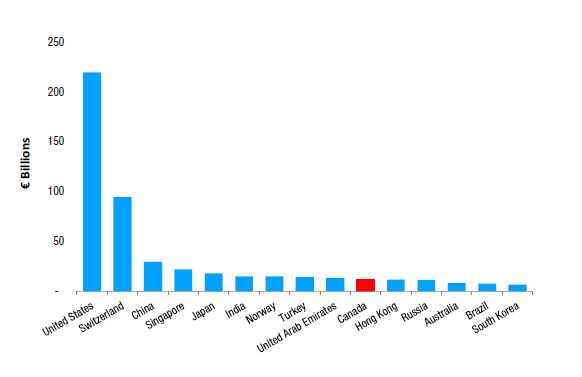
Source: Eurostat, 2016
Figure 24 Text Alternative
EU Top Sources of Service Imports, 2016, € Billions
| United States | 219.3 |
|---|---|
| Switzerland | 94.1 |
| China | 29.6 |
| Singapore | 22.0 |
| Japan | 18.0 |
| India | 15.3 |
| Norway | 15.2 |
| Turkey | 13.9 |
| United Arab Emirates | 13.2 |
| Canada | 11.8 |
| Hong Kong | 11.4 |
| Russia | 11.3 |
| Australia | 8.3 |
| Brazil | 7.9 |
| South Korea | 6.6 |
As noted, Canada’s share of EU service imports has fallen considerably over the past six years for which comparable data are available. Business services is by far the largest sub-sector for EU imports overall as well as for EU imports from Canada and as such was also responsible for most of the fall in Canada’s share of EU imports. EU imports from Canada in this sector actually increased modestly between 2010 and 2016 (up 16.7 percent), but could not keep pace with the growth in overall EU imports (up 95.8 percent).
Employing similar techniques as were used to examine Canada’s comparative advantages in the U.S. services import market produces rather striking results for the EU.Footnote m5-26 As was the case with the United States, the trade balance approach indicates far fewer sectors of possible comparative advantage (at only six sectors) than does the import share approach. Overall, Canada had a services trade deficit of €6.7 billion with the EU in 2016, €3.5 billion of which is in commercial services representing 23.9 percent of two-way trade. Using 23.9 percent as a new benchmark for comparative advantage, rather than being limited to those sectors with a surplus, adds an additional four sectors and greatly increases the overlap with the results for the United States. Most notable in the EU case, however, is the close correlation between the trade balance and import share approaches. There is a strong correlation between trade balance and import share when ranked. These measures of comparative advantage point in a broadly similar direction as the results for the United States in that: 1) R&D stands out as a sector in which Canada performs well; 2) Canada broadly shows the signs of having advantages in professional and technical services; and, 3) some sectors show Canada’s market-specific strengths, with education being an example in the EU while Canada’s performance in education in the U.S. market ranked poorly.
| Balance | Import Share | |
|---|---|---|
| Construction | -78.4 | -0.3 |
| Architecture | -78.4 | -0.7 |
| Health Services | -77.8 | -1.0 |
| Operating Leasing Services | -72.7 | -0.6 |
| Waste Treatment | -72.0 | -0.9 |
| Financial Services | -66.7 | -0.5 |
| Heritage and Recreation | -65.5 | -0.9 |
| Intellectual Property | -63.0 | -0.9 |
| Information | -54.1 | 0.4 |
| Engineering | -50.2 | 0.6 |
| Insurance | -47.4 | 0.0 |
| Legal | -44.3 | 0.4 |
| Telecom | -40.8 | 0.1 |
| Computer | -33.2 | 1.4 |
| Other Business Services | -21.4 | 0.1 |
| Accounting | -21.2 | 0.6 |
| Scientific and other Technical | -15.7 | -0.3 |
| Education | -13.2 | 1.3 |
| Other Personal Services | 9.9 | 0.0 |
| Business and Management | 11.8 | 0.7 |
| Research and Development | 34.9 | 0.1 |
| Advertising | 37.2 | 0.4 |
| Trade-related Services | 55.2 | 0.2 |
| Audiovisual | 62.4 | 9.1 |
SME Exporters of Services
Data on the characteristics of the firms that export and import merchandise come from customs documents. These data inform us that while most exporters are small and medium-sized enterprises (SMEs),Footnote m5-27 most of the value of exports comes from large firms. Even among SMEs, a relatively small share of exporters contributes most of the value. Only much more limited data from surveys are available for exporters of services.
As of 2014, an estimated 11.8 percent of SMEs exported. According to the Survey of SME financing and growth, in 2011, the year of the most recent data available,Footnote m5-28 48.9 percent of exporting SMEs exported goods only, 39.1 percent exported services only, and 12.0 percent exported both goods and services. As a share of the number of firms, however, the share that exports in the services sector is well below that in goods. This finding is not unique to Canada: even in the United States, which is often thought to have a comparative advantage in services, service firms’ export participation lags manufacturing firms by a considerable margin.Footnote m5-29
Figure 25
SME Exporters – Goods vs. Services, 2011

Source: Survey of SME Financing and Growth, 2011
Figure 25 Text Alternative
SME Exporters – Goods vs. Services, 2011
| share, % | |
|---|---|
| Goods Only | 48.9 |
| Services Only | 39.1 |
| Goods & Services | 12.0 |
The smallest of SMEs, those with between one and four employees, are the most likely to be services exporters. Some 51.9 percent of these “micro-SMEs” export only services and another 8.1 percent export both goods and services. By comparison, the largest SMEs, those with between 100 to 499 employees (the “mediumsized enterprises” in SME), are less likely to export services overall, and when they do only 21.6 percent export services only but a larger percentage, 22.5 percent, export both goods and services. There are a number of reasons for the different propensity of firms to export services according to their size. The most likely reason is that there may be less scope for economies of scale in the production of services. Large manufacturing plants achieve economies of scale through specialization of tasks such as on an assembly line. It is not clear that the same scope for specialization of tasks and standardization of outputs is possible in services. Tasks in manufacturing also benefit from proximity, for example, minimizing the distance between tasks as a good travels down an assembly line yields savings. With the advent of just-in-time delivery of inputs, suppliers are, in many cases, located in close proximity to the customer. For many service industries the benefits of such proximity are not as clear. Finally, goods-producing industries are often capital intensive and greater scale allows for better access to financing enabling businesses to make expensive capital outlays. By the same token, where size confers less benefit, such as in services, this lowering of barriers to entry may permit new, smaller, companies to enter the market. But it is not always the case that service firms are smaller. Six of the ten most valuable Fortune 500 companies are in the services sector. Financial services have always ranked highly on such company lists and have recently been joined by technology companies.
Figure 26
SME Exporters by Size of Firm, 2011

Source: Statistics Canada, Survey of SME Financing and Growth, 2011
Figure 26 Text Alternative
SME Exporters by Size of Firm, 2011
| Goods, % | Services, % | Both, % | |
|---|---|---|---|
| 1 to 4 employees | 0.4 | 0.5 | 0.1 |
| 5 to 19 employees | 0.5 | 0.4 | 0.1 |
| 20 to 99 employees | 0.6 | 0.2 | 0.2 |
| 100 to 499 employees | 0.6 | 0.2 | 0.2 |
Among industries, goods-producing industries are, not surprisingly, focused on exporting goods; 82.0 percent of SMEs in manufacturing export only goods, while 85.4 percent of SMEs in the agriculture and resources sectors export only goods. There are notable differences though; 12.5 percent of SMEs in the agriculture and resources sectors export only services while only 2.1 percent export both goods and services, indicating a clear distinction between those that produce and export the goods and those that provide services in the sector. By comparison, only 2.1 percent of manufacturing SMEs export only services, but 15.9 percent report exporting both goods and services. This likely reflects the linkage between manufacturing a product and providing follow-up services (see section on servicification in this report). In the professional, scientific and technical service sector, 73.9 percent of SMEs report exporting only services compared to 14.2 percent for only goods and 11.9 percent for both goods and services.
Figure 27
SME Exporters by Select Industry, 2011

Source: Survey of SME Financing and Growth, 2011
Figure 27 Text Alternative
SME Exporters by Select Industry, 2011
| Goods | Services | Both | |
|---|---|---|---|
| Professional, Scientific & Technical Services | 0.1 | 0.7 | 0.1 |
| Wholesale | 0.8 | 0.1 | 0.2 |
| Manufacturing | 0.8 | 0.0 | 0.2 |
| Agriculture & Resources | 0.9 | 0.1 | 0.0 |
Although service firms tend not to have the same economies of scale as producers of goods, they do appear to benefit from a different type of economy of proximity – clustering. Goods-producing industries are more likely to be located outside of major metropolitan areas. That may be driven by the location of natural resources as is the case with mining, forestry and agriculture, or of inexpensive land for large manufacturing plants. The idea of the “company town” where one large company was the dominant employer in town is largely associated with goods-producing companies. Services-producers, on the other hand, and knowledge-based services in particular, are largely urban affairs and appear to benefit from proximity to firms in a similar line of business. Some 39.0 percent of rural SMEs export services compared to 53.5 percent of urban SMEs.
Figure 28
Majority Female-Owned SMEs Exporters by Industry, 2014

Source: Statistics Canada, Survey of SME Financing and Growth, 2014
Figure 28 Text Alternative
Majority Female-Owned SMEs Exporters by Industry, 2014
| share, % | |
|---|---|
| Other Services | 4.5 |
| Transportation & Warehousing | 7.8 |
| Wholesale Trade | 7.8 |
| Accommodation & Food Services | 11.2 |
| Retail Trade | 12.8 |
| Manufacturing | 16.0 |
| Health, Information, & Arts | 16.4 |
| Professional & Technical Services | 20.4 |
An additional notable characteristic of SMEs that export services is that they are more likely to be female-owned than SMEs that export goods: 8.7 percent of SMEs that export services are majority female-owned compared to 7.5 percent of goods exporters. But, far fewer export goods and services: only 2.7 percent of SMEs that export both goods and services are majority female-owned. This is likely related to size as female-owned SMEs tend to be smaller while those SMEs that export both goods and services tend to be larger. The importance of services for female-owned SMEs is also apparent when looking at sub-sector composition. While majority male-owned SMEs are dominated by manufacturing, among female-owned SMEs professional services is the most important sub-sector followed by health, social and culture, with manufacturing ranking only third.
SME exporters in the service sector face challenges that are common to the goods-exporting sector as well as unique challenges. Distance to customers ranks as the most important obstacle for both small and mediumsized exporters and is also ranked as a more important obstacle for service-exporters than for goods exporters. This may reflect the fact that, face-to-face meetings are still important in the service sector and may require travel, despite technology that allows for easier and less costly communications. It is notable that border security is the third-ranked obstacle and is also rated as more important for service exporting SMEs than for goods exporting SMEs. For goods exporters, security may mean scans of containers crossing the border while for service exporters it means longer line-ups and more intrusive scans for people crossing the border. Of note, financing issues are not ranked highly for either goods or service exporters. Similarly, intellectual property rights protection is not rated as a major concern for SMEs exporting either goods or services. The aggregate figures, however, can hide a significant degree of detail due to the size and diversity of the service sector: some survey respondents in certain sub-sectors may rate an obstacle highly even if the majority do not. The characteristics of the sector as well as the predominant mode of delivery for exports in each sector are often important factors in predicting if an obstacle will be rated as significant.
Relative to other service industries, small firms involved in transportation (especially air and ground transportation) find legal and administrative obstacles to be of high importance as a barriers to export.Footnote m5-30 Similarly, border security is identified by small firms as a high concern in transportation (truck and air transport as well as warehousing). In both cases, this is likely due to the frequency of cross-border dealings for this industry. On the other hand, service firms of medium size involved in scientific technical services and laboratory testing rated concerns about border security highly; this is likely due to the sensitivity of work that is being done. Distance to customers was reported of high importance, mainly by small architectural, engineering and related services firms. This makes sense as these firms may require the movement of people to perform their work. The industries that most identified linguistic and cultural issues as obstacles to exporting their services were those that provide services with a strong language or cultural awareness component: advertising, software publishing, online publishing, and information and cultural industries.
| Small Enterprises (%) | Medium Enterprises (%) | |||
|---|---|---|---|---|
| Manufacturing Exporter | Service Exporter | Manufacturing Exporter | Service Exporter | |
| Distance to customers | 25.0 | 38.3 | 21.2 | 36.6 |
| Meeting customers cost requirements | 37.6 | 31.1 | 39.7 | 11.3 |
| Border security issues | 16.6 | 27.2 | 10.2 | 27.7 |
| Meeting customers quality requirements | 21.1 | 25.1 | 23.8 | 3.4 |
| Canadian export taxes or trade obstacles | 18.1 | 15.6 | 16.3 | 14.6 |
| Canadian legal/administrative obstacles | 15.6 | 15.3 | 10.6 | 25.9 |
| Access to financing | 19.3 | 15.0 | 14.6 | 18.0 |
| Foreign tariffs or trade barriers | 21.3 | 14.4 | 21.6 | 16.9 |
| Uncertainty of international standards | 18.7 | 14.1 | 16.5 | 14.5 |
| Linguistic or cultural obstacles | 8.7 | 10.7 | 10.1 | 2.8 |
| Intellectual Property (IP) right violation concern | 9.5 | 6.5 | 11.9 | 15.7 |
| Customer requirements to use specific technologies | 13.8 | 6.4 | 7.8 | 0.0 |
Conclusions
Services are becoming an increasingly important component of Canadian exports, both directly as well as indirectly in the form of embodied content or as facilitators of goods trade. Due to Canada’s relatively large manufacturing and resource sectors, Canada’s services exports are somewhat less developed than those of many of its peers. And yet, Canada shows strength in some key knowledge-intensive service sectors.Footnote m5-31 Many SMEs also export services, either on their own or alongside of goods. Services look like a promising avenue for Canadian export expansion. However, since much of Canada’s services trade by value takes place as intra-firm trade and is closely linked to foreign direct investment, traditional trade policy tools might not be as effective. More analysis should be done to ensure that, at a minimum, no barriers exist to expanding services trade and that trade promotion can offer the appropriate services to these companies to foster growth in exports of services.