
Archived information
Information identified as archived is provided for reference, research or recordkeeping purposes. It is not subject to the Government of Canada Web Standards and has not been altered or updated since it was archived. Please contact us to request a format other than those available.
The evolution of Global Value Chains (2011)
Introduction
The world economy has undergone significant transformation over the past two decades. During the 1990s, productivity growth, stagnant since the 1970s, appeared to reassert itself, especially in the United States, driven by advances in computing and information technologies. In the early part of the decade, many developing economies experienced a period of rapid economic growth, only to be cut short with the Asian financial crisis in 1997 followed by similar crisis in Russia, parts of Latin America and the OPEC countries. The 2000s, which began with a high-tech bust and the terrorist attacks of 9/11, subsequently entered a period of great economic stability that became known as the “great moderation” during which a number of developing economies became known emerging economies,1 and a few of the largest and fastest growing were singled out as the BRICs.2 The “great moderation” ended, however, and the final years of the decade were arguably even more eventful than the early years with a global financial crisis and resulting sharp decline in global trade. Post crisis, the gap in economic performance between rich and emerging economies has widened, the weakness in the fiscal situation among many of the former has become more pronounced, and the global imbalances that had been growing for a number of years have moved to the forefront of many policy debates.
Over these two decades another, but much more gradual, change was also taking place as firms reorganized their business operations into global value chains (GVCs). Although not as apparent as some of the other changes taking place, as this special feature will show, GVCs have exerted a huge impact on world trade and have likely played an important role in many of the developments noted above. For example, GVCs have likely contributed to the rapid growth of the emerging economies, sharpened the decline in world trade during the recent financial crisis but may have also moderated its impact, and will influence the response to global imbalances. And most importantly, GVCs impact on productivity growth, competitiveness, and therefore the standards of living within economies – the fundamental goal of economic progress and policy.
The concept of global value chains (GVCs) was introduced in the special feature contained in Canada’s State of Trade 2007.3 Since then, a significant amount of research and analysis has been devoted to understanding GVCs and how they work. This year’s special feature provides an overview of some of that recent work, draws on the latest statistics and attempts to provide a link between GVCs and economic theory.
Putting GVCs in Their Place
A global value chain describes the full range of activities undertaken to bring a product or service from its conception to its end use and how these activities are distributed over geographic space and across international borders.4
This definition offers a structural view of GVCs, presenting themas a series of activities, performed by any number of firms with each activity located in the jurisdiction where it is most efficiently undertaken. This definition describes how GVCs are organized and why. Another view of GVCs, however, might focus on the transactions they generate; for example, the cross-border flow of intermediate goods and services that are combined in a final product that is sold globally. Both definitions can be reconciled with recent developments in economic theory.
Since the economist David Ricardo expressed his views in 1817, international trade theory has been governed by the notion of “comparative advantage,” according to which each participant in trade will specialize in producing the good in which it has comparative advantage. According to Ricardo’s model, the meaning of comparative advantage is expressed as a cost advantage, the source of which is not made explicit, although it is generally interpreted and modeled as an advantage based on differences in technology or geography. The result is the well known example of the exchange of British cloth for Portuguese wine. Heckscher and Ohlin built on this foundation, arguing that differences in what they referred to as “factor endowments” determine differences in relative costs. According to the Heckscher-Ohlin (H-O) model, this relationship produces, for example, the result that labour intensive countries should specialize in producing labour-intensive products and capital-intensive countries should focus on capital intensive products.
Both of these classical models recognize that firms and individuals trade, and that differences in technology (Ricardo’s model) or endowments (H-Omodel) are specific to particular locations, i.e. countries. However, under the so-called “new trade theory” developed by Paul Krugman in the 1980s, such differences are no longer the only consideration. According to this theory, even countries that are similar will engage in and benefit from trade providing each specializes and thereby becomes more efficient in production as a result of economies of scale. Again, it is firms or individuals that trade, but the potential gains from specialization are a characteristic of the industry.
Along with economies of scale, geographical proximity is another key element of the new trade theory. Here firms will locate near their customers and their suppliers to reduce transportation costs and gain an advantage over their competitors. Large population centres thus becomemagnets for production, which is self-perpetuating as firms engaged in upstreamand downstream activities follow suit and industrial clusters emerge. But, once again, the differences in transportation costs and the relative importance of being close to suppliers and to customers, i.e. agglomeration effects, are characteristics associated with the industry.
If classical theory focuses on differences in characteristics between locations, and new trade theory focuses on the characteristics of individual industries, then the more recent heterogeneous firmtheory (often called new new trade theory) focuses on the differences between individual firms. New new trade theory recognizes that within a given industry and in a given location, significant variation can exist between firms. Althoughmany firms do not engage in international trade, those that do so tend to bemore productive. Firms that both trade and invest abroad tend to be the most productive.
According to new new trade theory, engaging in international trade enables the best firms to expand and replace weaker firms, resulting in increased productivity, higher wages and improved standards of living. Under both classical and new trade theory, most of the gains from trade occur as a result of themovement of resources between industries,5 whereas new new trade theory suggests thatmost benefits arise fromdifferences within industries, i.e. between firms. According to new new trade theory, trade takes place because of the differences between individual firms which can possess a technology or intellectual property (IP) that makes them better able to compete internationally. This produces a second source of benefit from trade because when individual firms expand, they can spread their fixed costs of innovation across a larger customer base, thereby increasing the incentive to innovate. Such a dynamic benefit that accumulates over time,much like compound interest, can potentially be an important gain from trade.
The idea of global value chains builds on this evolution of the understanding of why and how trade occurs and the resulting impacts. As recognized by new new trade theory, even within a country or industry, firms can operate very differently. One of those differencesmay be how firms integrate into global value chains; if firms produce their own intermediate inputs or if they source them from outside the firm, if their human resource or accounting departments are next door to their production facilities or are located half way around the world. GVCs may therefore explain some of the observed productivity differences between firms as identified under the new new trade theory. But, potentially more importantly, GVCs can be treated like a technology employed by the firm to become more competitive. GVCs help to look into the black box that is the firm and understand how they operate and why.
Several models of GVCs have been developed, each aimed at providing a theoretical framework to predict the behaviour of firms engaged in global trade.6 Feenstra and Hanson (1996, 1997) begin with a Heckscher-Ohlin framework but divide the production process for any particular final good or service into activities. These activities are then allocated to the location where they are most efficiently performed. Grossman and Rossi-Hansberg (2008) provide a similar model for trade but focus on tasks instead of activities. The difference between activities and tasks is primarily an issue of aggregation. For example, an activity such as legal services may be separated into distinct tasks, such as the provision of highvalue legal advice or the execution of lower-value administrative duties.7 The implication here is that more routine tasks can be moved abroad while higher-value tasks will be performed domestically. An additional difference between the Feenstra and Hanson and the Grossman and Rossi- Hansberg models centres on the role of the firmitself. In the former, trade is assumed to be conducted at arm’s length (i.e. outsourcing) while in the latter it can be interpreted as a transaction within the firm (i.e. offshoring). Antras (2003, 2005) provides an important link between the two by enhancing our understanding of how firms decide where to locate various activities and whether or not to exert direct control (i.e. the decision to perform the activity within the firm or to source it from outside the firm).While thesemodels relymostly on the H-O framework, Baldwin (2011) incorporates trade in tasks into the economic geography framework of new trade theory developed by Krugman and how this relates to Canada’s place within North America.
Thus, while some may argue that with the rise of global value chains, comparative advantage no longer applies, it is clear that, as with prior innovations, each new theory builds on the previous rather than replaces it. The modern structure of trade supports this assertion. As would be expected under the classical models, Canada exports resource and resource-based products because Canada has been “endowed” with significant natural resources such as oil, natural gas,minerals and forests, as well as land and water for producing agricultural products. By contrast, countries with an abundance of cheap labour tend to export labour-intensive products. The gradual shift in production location of labour-intensive products (e.g. textiles, clothing and toys) from advanced economies like the United States to economies like Hong Kong and subsequently to developing economies like China and then increasingly to emerging economies in South-East Asia, seems to support the outcome predicted by classical trade theory. The agglomeration of industries predicted by new trade theory can also be observed, for example, in the auto sector in Southern Ontario, the aerospace sector near Montreal and similar industrial clusters across Canada and around the world. This in turn is augmented by new new trade theory which can explain the observable differences in success between firms within industries and why some firms thrive in certain industries despite apparent odds and can even evolve into global champions. As Globerman (2011) points out, adding the concept of GVCs to theories of trade does not render comparative advantage irrelevant. On the contrary, trade occurring at an increasingly finer level raises the potential for gain. Similarly, if there are gains from economies of scale, then being able to aggregate specialized activities (think for example of the rise of firms specializing in HR activities, operating call centers or providing IT support)may allow for increased gains from scale. In this way, GVCs actually magnify rather than diminish comparative advantage and its associated trade gains.
The Drivers
Declining cost of transportation and communications technologies are widely believed to have driven the rise of GVCs. While this may be the case, little work has actually been undertaken to test this or to understand the drivers of GVCsmore generally. This is an important gap for a number of reasons, but possiblymost critically, if it is not known what drove the rise of GVCs, it will not be possible to know if the trend will continue, stagnate or even reverse and what role, if any, policy can play in shaping the evolution of GVCs.
One component of the GVC and transport cost story is the price of oil. As international transport is a heavy user of oil, there is potentially a link between oil prices and the costs of international trade. After peaking in the late 1970s and early 1980s, the price of oil fell steadily to a low of about US$15 per barrel in 1998. In nominal dollars, this fall was modest but in real terms it was significant. It has been argued that an important driver of the growth of GVCs was this fall in oil prices. This trend was of course followed by a sharp rise over the 2000s to peak at nearly US$ 150 prior to the global financial crisis.
Figure: 1
Oil Prices and Global Trade
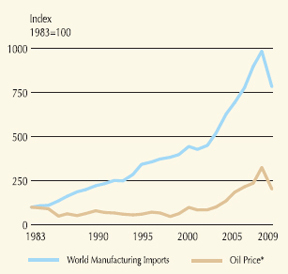
* U.S. dollars per barrel, near month Cushing future on NYMEX.
Data: WTO and U.S. Department of Energy.
Figure 1 Text Alternative
Figure 1 depicts the price index of oil (1983=100) with the piece index of traded manufactured goods (1983=100) from 1983 to 2009.
From its base of 100.0 in 1983 the oil price index declined to a low of 47.0 in 1998, then rose to 98.7 in 2000, 185.0 in 2005, 236.2 in 2007 and 325.3 in 2008 before falling back to 202.5 in 2009. From its base of 100.0 in 1983 the traded manufactured goods price index gradually rose to 221.7 in 1990, 343.3 in 19995, 444.7 in 2000, 693.4 in 2005 and 985.2 in 2008 before falling back to 783.8 in 2009.
There is, however, little empirical evidence that links the decline in oil prices during the 1980s and 1990s to increased trade and the rise of GVCs. One of the few studies that is consistent with this view is that of Bridgman (2008) which finds that high oil prices can explain a large part of the slowdown in trade growth from 1974 to 1985. Indeed, there ismuchmore evidence which fails to find that oil prices play an important role in the growth of trade or of GVCs. Furthermore, as oil prices increased by nearly ten-fold fromtrough to peak over the 2000s, there was no decline in international trade or slowing of the growth of GVCs. Although Hillberry (2011) points out that there was a switch from air to ocean transport for some goods during this period, he also notes that the shift was much less pronounced for intermediate inputs, suggesting that GVCs are less subject to oil price movements than are finished goods. In fact from 2000 onwards trade and oil prices moved in the same direction: world manufacturing imports, which excludes oil and natural resources (both of which saw their price increase over this period), grew quickly while oil prices were rising sharply.
A simple explanation exists for the lack of evidence supporting the link between higher oil prices and lower trade values. Calculations based on Statistic Canada’s inputoutput tables reveal that for the air transportation and the truck transportation sectors, 22 percent and 25 percent, respectively, of purchased inputs (excluding wages, taxes and subsidies) were spent on fuel.8 While these are fairly sizable sums, the share of transportation among other industries’ inputs is surprisingly small. For example, in Canada’s vehiclemanufacturing industry, 0.3 percent of purchased inputs (excluding wages, taxes and subsidies) was spent on transportation. Of that, rail transport accounted for just over half and truck transport for about a third. For electronic products manufacturing, just under 0.9 percent of costs were spent on transportation, with more than 70 percent on air transport. Multiplying these small shares of total costs spent on transportation by the 2007 share of the relevant transportation sector’s use of fuels, we see that oil prices account for an extremely small share of the total cost of inputs for most goods.
Figure: 2
International Seaborne Trade

Data: UNCTAD, Review of Maritime Transport, 2010.
Figure 2 Text Alternative
Figure 2 depicts the volume (millions of tons loaded) of international seaborne trade in 1980, 1990, 2000 and 2008 for a variety of types of traded goods.
The volume of oil shipped by sea was 1,871 in 1980, 1755 in 1990, 2,163 in 2000 and 2,732 in 2008; the volume of main bulk goods shipped by sea was 796 in 1980, 968 in 1990, 1,288 in 2000 and 2079 in 2008; the volume of goods shipped by sea in containers was 104 in 1980, 214 in 1990, 739 in 2000 and 1,339 in 2008; the volume of other dry goods shipped by sea was 933 in 1980, 1,071 in 1990, 1,794 in 2000 and 2,060 in 2008.
These estimates derive from statistics for Canada’s domestic and international trade combined. The share of transport in total costs can be much larger for international trade as one would expect given that the distance travelled would be much larger on average and may involve more modes of transportation which adds to the cost. For the United States, transportation costs as a percentage of total input costs for international trade were found to be about 4 percent in 2004 (Hummels, 2007). If fuel costs account for between one fifth to one quarter of total transportation costs, fuel costs will account for only about one percent of the cost of the final good.9 This should not be interpreted, however, tomean that oil prices do not have an impact on international trade or on GVCs. Higher oil prices could indeed have a large impact on certain sectors and markets. Those items with the highest shipping cost-to-value ratio, and the most distant markets, would likely be the most impacted. As noted earlier, rising oil prices have likely already had an impact on choice of transportation modes. Significantly higher oil pricesmay not stop the growth of GVCs, but it could affect their configuration and operation.
Declining costs of transportation, and of sea transport as a result of containerization specifically, has been suggested as a potential driver for the rise of GVCs. The growing volume of goods shipped by container internationally appears to coincide with the rise of the GVC, which is why the two are often associated. From 1990 to 2008, the volume of goods shipped by container increased fromjust over 200million tons to 1.3 billion tons, a more than six-fold increase. The volume shipped by other means also increased but not by nearly asmuch. The volume share of goods shipped by container increased from 5 percent in 1990 (and from almost nothing in 1970) to 16 percent in 2008.
Figure: 3
Share of Canadian Exports by Air to Non-U.S. Destinations,* 2008

* By Value.
Data: Statistics Canada and Transport Canada.
Figure 3 Text Alternative
Figure 3 depicts the percentage share of the value of Canadian exports to non-U.S. location shipped by air in 2008.
The share of total exports to non-U.S. destinations shipped by air was 26.2 percent; the share of exports of scientific equipment to non-U.S. destinations shipped by air was 83.6 percent; the share of exports of electronics to non-U.S. destinations shipped by air was 79.0 percent; the share of exports of aerospace products to non-U.S. destinations shipped by air was 76.7 percent; the share of exports of machinery to non-U.S. destinations shipped by air was 47.3 percent.
But, the fact that containerized shipping emerged at the same time as GVCs, does not, in and of itself imply causation. An important element of the argument linking containerization to the rise of GVCs is a decline in sea freight costs. Detailed work by Hummels (2007) finds only a modest decline in sea freight transport costs due to containerization after the mid 1980s, after having risen sharply from the late 1970s. Thismodest decline in costs does not appear to be sufficient to explain the rapid rise of trade and of GVCs. However, Hummels does find that the largest impact of the innovation in containerized shippingmay not have been reduced costs in the traditional sense, but rather a reduction in international shipping times. Regardless of whether or not cost savings are expressed in conventional terms,the net economic effect is that faster shipping times yield lower transportation costs— because “time is money.” Hummels (2001, 2007) also shows that while containerization use increased, the use of air transportation to ship goods was also rising dramatically as its price declined. The share (by value) of Canadian trade that occurs by air has increased substantially. In 2008, more than one quarter of Canadian exports (by value) to non-U.S. destinations occurred by air. And, this is somewhat understated due the high proportion of resources in Canadian exports, which are generally shipped by sea. The share is substantially higher for more manufactured products, with those sectors that posted the fastest growth in trade in intermediate goods also showing a particularly high use of air transport. The evidence therefore suggests that speed of transport has played an important role in the global fragmentation of production, at least with respect to intermediate goods. Evidence has yet to be established for such a link with respect to services, although services involving themovement of people primarily by air would certainly witness a similar effect.
The case for the role of information and communications technologies (ICTs) is equally complex. The special feature included in the 2007 State of Trade report also provided information on telecommunications which illustrated a dramatic fall in telecommunications costs with a particularly sharp decline in recent years. Hillberry (2011) investigates the relationship between telecommunications and information technologies and GVCs. His model is based on that of Jones and Kierzkowski (1990) in which these services are treated as complements to imported intermediate inputs. By linking those sectors that make use of ICT services through input-output tables he is able to compare the usage of ICT services with resulting fragmentation of production. Hillberry, however, is not able to find convincing empirical evidence that ICTs drove fragmentation of production.
Interestingly, Hillberry does find that the entrance of new countries into the global economy, and of formerly communist countries in particular, seems to be an important factor driving the fragmentation of production. He hypothesizes that what may have been most important was the unique characteristics of these countries, namely their relatively low wages but high levels of education, especially in technical fields. But he also notes that this effect had largely run its course by 1996.
Although their transition from closed to open economies was less demarcated, the opening of such economies as India or Brazil would have likely played a similar role in the rise of GVCs. In these cases, as well as for the formerly communist countries, the removal of tariff and non-tariff barriers are an important component of “opening”. Baier and Bergstand (1999), for example, find that reductions in tariff rates were three to four times as important for the growth of global trade as were declining transport costs. Tariff rates are particularly important for GVCs as tariffs can potentially be magnified as they are applied to both inputs as well as the final output. Other barriers to trade (i.e. non-tariff measures and regulatory requirements) are likely to be just as important and would also extend to services.
To summarize, very little systematic empirical work has been performed to assess the drivers of the growth of global value chains and more work is definitely needed on this important topic. The work to date suggests that containerized shipping may have played a role, but developments in air transport were most important for the fragmentation of goods production and would likely play an important role for services as well. Given that air transport is the most expensive way to ship goods and that trade did not appear to be overly impacted by the rise in oil prices over the 2000s, rising oil prices will likely not be the critical factor in determining the continued growth of GVCs. Although ICTs and the declining costs of telecommunications are often cited as a driver for the growth of GVCs, there is currently little hard evidence to support this belief. There is some evidence that formerly communist countries entering the global economy during the past decades was an important factor behind the rise of GVCs, but that effect hasmostly dissipated. Declining tariff rates and more general market opening likely played an important role as well. This last, being directly under the control of policymakers, may prove to be the most important.
Canada and GVCs
No reliable method exists to measure global value chains (GVCs) or to determine how a country such as Canada fits in. Indirect methods must be relied upon instead, such as using existing measures of international commercial engagement, from data presented in the United Nations BEC, and from input-output tables.
Figure: 4
Global Average Applied Tariff Rates on All Products
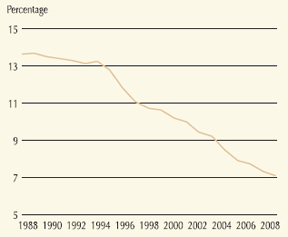
Data: World Bank.
Figure 4 Text Alternative
Figure 4 depicts the global average applied tariff rate on all products over the period from 1988 to 2008.
The global average applied tariff rate on all products was 13.6 percent in 1988, 12.8 percent in 1995, 10.2 percent in 2000, 7.9 percent in 2005 and 7.1 percent in 2008.
Making use of existing sources of data, for Canada, it can be seen that trade (exports plus imports) increased about 50 percent faster than nominal GDP over the 1990 to 2008 period.10 This result indicates the increased importance of international markets to Canada’s economy. Trade in commercial services increased even faster, which likewise illustrates their growing importance. Inward and outward FDI stocks also increased faster than goods trade which supports the idea that international commerce is replacing the increasingly-dated concept that international transactions are mostly about trade. The growing importance of “intellectual” trade is reflected in the burgeoning international flow of royalties, licence fees and R&D innovation. In this regard, Canada is preeminent, an important harbinger for its continued economic success.
Figure: 5
Growth In Global Value Chains in Canada Growth Relative to Canadian GDP, 1990-2008

* For FA Sales and FC sales, period is 1999-2008.
Data: Statistics Canada.
Figure 5 Text Alternative
Figure 5 depicts the difference in average annual growth rates over the period 1990 to 2008 between nominal GDP and various global value chain indicators.
Goods exports expanded 0.64 times faster than GDP; exports of commercial services expanded 1.7 times faster than GDP; exports of royalties and licencing fees expanded 14.5 times faster than GDP; exports of research and development related services expanded 2.2 times faster than GDP; outward Foreign Direct Investment (FDI) expanded 1.3 times faster than GDP; Canadian foreign affiliate sales abroad expanded at a rate equal to GDP growth; goods imports expanded 0.59 times faster than GDP; imports of commercial services expanded 0.8 times faster than GDP; imports of royalties and licencing fees expanded 1.7 times faster than GDP; imports of research and development related services expanded 0.4 times faster than GDP; inward FDI expanded 3.1 times faster than GDP; foreign owned companies’ sales in Canada expanded at a rate 0.12 faster than GDP growth.
The United Nations Broad Economic Classification (BEC) system11 can be used to evaluate broad trends in global value chains. The data are readily available for a wide range of countries but provide only a simple breakdown of capital and goods (intermediate and final). Because it is limited to goods, using the BEC data will miss the more dynamic changes occurring in services trade. That said, goods still account for the bulk of Canada’s international trade.
A simple measure of comparative advantage is to compare the level of exports and imports in a given year with a net surplus representing a sign of comparative advantage. Based on the BEC classification system, by thismeasure Canada is a large net exporter of intermediate goods and net importer of both capital goods and consumer goods, the latter being the stronger. Furthermore, Canadian exports of intermediaries are growing faster than imports while the reverse is true for both consumption and capital goods, implying that the demonstrated comparative advantage in intermediaries is getting stronger. Comparing Canada to the world supports the view that Canada specializes in intermediates. By contrast, the United States, with its large overall deficit in merchandise trade shows a deficit in all three goods categories (services trade, for which the United States posts a surplus, is not included). But, the smallest deficit is in capital equipment. Capital equipment also accounts for a larger share of U.S. exports than the world average, potentially suggesting an advantage in that category.
Figure: 6
Exports by Type

Data: UN Comtrade.
Figure 6 Text Alternative
Figure 6 depicts the growth in exports by type 2000-2008 for the World, Canada and the U.S., as well as the share of overall exports accounted for by each type of exports in 2008.
World exports of capital goods expanded by 114% 2000-2008, by 3.4% in Canada and by 48.6% in the U.S. World exports of intermediate goods expanded by 65.3% 2000-2008, by 95.6% in Canada and by 60.1% in the U.S. World exports of consumer goods expanded by 126.4% 2000-2008, by 65.4% in Canada and by 72.8% in the U.S. In 2008, capital goods accounted for 16.4% of World exports, 10.8% of Canadian exports and 22.4% of U.S. exports; intermediate goods accounted for 65.3% of World exports, 79.1% of Canadian exports and 63.7% of U.S. exports; consumer goods accounted for 18.2% of World exports, 10.1% of Canadian exports and 13.9% of U.S. exports.
Broad statements like this, however, are of limited value. It is not surprising, for example, to find that Canada has an apparent advantage in intermediates, which includes resources. It is also not a surprise that this advantage seems to be strengthening given the rise in resource prices over the past number of years. A more informative measure of Canada’s participation in global value chains involves the use of data presented in input-output tables, which provide estimates of the proportion of intermediate goods used as inputs in production. Such tables also break down intermediate inputs into imported and domestically produced goods. One disadvantage of these tables is the implicit assumption that a given imported input and its domestically produced equivalent are used in equal proportion in production (i.e. as an input in a manufacturing process) and in consumption (i.e. as a consumer good).
Figure: 7
Share of Imports that are Intermediate Inputs

Data: Statistics Canada.
Figure 7 Text Alternative
Figure 7 depicts the share of imports that are intermediate inputs for the economy as a whole and the manufacturing sec tor, respectively, over the period 1961-2006.
In 1961, intermediate goods accounted for 64.6% of all imports, reached a high of 66.1% in 2000 before falling back to 65.5% in 2006. In 1961, intermediate goods accounted for 72.0% of imports in the manufacturing sector, 68.4% in 1980, reached a high of 74.1% in 1994, fell back to 69.2% in 2000 before advancing to 73.0% in 2006.
In terms of the share of imports that are intermediate inputs, a strong trend towards GVCs is not observed. There is a modest increase for the economy as a whole over the 1990s, but this amounts to an increase of only two percentage points, and then falls back somewhat since. For manufactured imports, the share at the end of the series is onlymodestly higher than at the beginning. Thus, according to this measure, imports of final products are growing at about the same rates as intermediate inputs. This corresponds to trends observed in the BEC data which shows intermediates growing about as fast as capital and finished goods.
Another method to measure Canada’s participation in GVCs involves determining the share of intermediate inputs that are imported (as opposed to the composition of imports as in the previous discussion). Here we see exceptionally strong growth. For the total economy the share of imported intermediate inputs in total intermediate inputs nearly doubles from 6.5 percent in 1961 to 11.6 percent in 2006. This is a fairly substantial increase considering the huge value of intermediate inputs in the economy and the many thatwould be considered non-tradable. For manufactured intermediate inputs the increase is even more pronounced, growing from 24.1 percent in 1963 to a peak of 73.2 percent in 1998 before falling back to 64.8 percent in 2006.
Figure: 8
Share of Inputs that are Imported

Data: Statistics Canada.
Figure 8 Text Alternative
Figure 8 depicts the share of inputs that are imported goods for the economy as a whole and the manufacturing sec tor, respectively, over the period 1961-2006.
In 1961, imported goods accounted for 6.5% of inputs, reached 9.2% in 1990, 12.0% in 1995, 13.5% in 2000 before falling back to 11.6% in 2006. In 1961, imported goods accounted for 26.3% of inputs in the manufacturing sector, 37.7% in 1980, 48.4% in 1990, reached a high of 73.2% in 1998, fell back to 61.1% in 2004 before advancing to 64.8% in 2006.
Input-output tables can also be used to examine Canada’s economic performance with respect to imports of intermediate services inputs. In professional services we see one of the strongest gains with less than 7 percent of intermediate inputs being supplied from abroad in the early 1960s12 to a peak of 21.3 percent in 1998—a three-fold increase—followed by a sharp decline in the 2000s. The share of professional services in total inputs increased even more dramatically, from 1.2 percent in the early 1960s to 5.7 percent in 2006—a nearly five-fold increase. This creates a somewhat more nuanced interpretation of GVCs. Firms used to perform these activities within the firm. As they begin to purchase them from outside, these activities are no longer captured under manufacturing but under services; this also helps to explain the growing share of the service economy in most western economies. It wasn’t only the growth of services, but the shift of some activities from being performed within the firm to outside the firm. But once an activity can be purchased from outside the firm it can also be purchased internationally through either offshoring or outsourcing.
Offshoring and Outsourcing in Canada13
Figure: 9
Professional Service* Inputs

* Engineering, scientific, accounting, legal, advertising software development and misc. services to business.
Data: Statistics Canada.
Figure 9 Text Alternative
Figure 9 depicts the share of total inputs consisting of professional services and the share of professional services that is imported over the period from 1961 to 2006.
In 1961, the share of total inputs consisting of professional services was 14.1 percent, fell off to 10.1 percent in 1970, rebounded to 16.0 percent in 1980, 15.2 percent in 1990, 19.8 percent in 2000, but fell back to 14.1 percent in 2006. In 1961, the share of professional services that consisted of imports was 1.2 percent, 1.7 percent in 1970, 2.2 percent in 1980, 3.3 percent in 1990, 5.3 percent in 2000 and 5.7 percent in 2006.
The concepts of offshoring and outsourcing are intimately related to GVCs. In other words, global value chain is the “noun” that represents a globally interconnected network of activities, while offshoring and outsourcing are the “verbs” that describe the movement of activities as the GVCs are formed and the trade flows these activities generate.
Offshoring is essentially themovement abroad of an activity that continues to be performed within the ownership structure of the firm. For example, amanufacturer closing an assembly plant in Canada and opening another plant in a foreign country is engaged in offshoring. By contrast, inshoring occurs when an activity that was once performed abroad is moved into Canada. Outsourcing occurs when the activity is purchased from a supplier outside the ownership structure of the firm. For example, a call centre is closed in Canada and a contract awarded to a firmthat supplies call centre services from a foreign location. Like offshoring, outsourcing has its opposite—insourcing—which occurs when a firmreplaces a foreign supplierwith a domestic supplier.
Figure: 10
Global Circulation of Business Activities
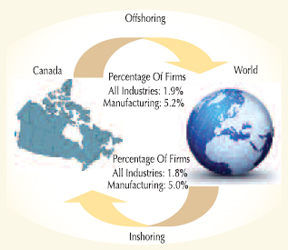
Data: Statistics Canada – SIBS Survey.
Figure 10 Text Alternative
Figure 10 depicts the percentage of firms located in Canada (Canadian as well as foreign owned) undertaking off-shoring (moving activities from Canada to abroad) and in-shoring (moving activities from abroad to Canada).
Over the period from 2007 to 2009, 1.9 percent of all firms and 5.2 percent of manufacturing firms undertook off-sourcing, while 1.8 percent of all firms and 5.0 percent of manufacturing firms undertook in-sourcing.
Although there has been a great deal of attention given to offshoring and outsourcing in the media and in policy circles, it turns out that both of these trends are relatively subdued. Possibly even more importantly, the trends appear to be much more circular than is commonly thought; a roughly similar number of activities appear to be moving into Canada as out.
Between 2007 and 2009, only 1.9 percent of companies located in Canada (including foreign companies) offshored a business activity. In the manufacturing sector, the rate was 5.2 percent— more than twice as great, but still small. More striking, however, is that the movement is circular: nearly the same proportion (1.8 percent) of firms located in Canada and 5.0 percent of manufacturersmoved activities into Canada (i.e. inshored).14
Within individual industries, there is a high degree of correlation between offshoring and inshoring. This suggests that some industries are simply more footloose than others and as a result aremore likely to move activities both out of Canada as well as into Canada.
Figure: 11
Offshoring and Inshoring in Canadian Manufacturing (percent of firms by industry)

Data: Statistics Canada – SIBS Survey.
Figure 11 Text Alternative
Figure 11 depicts a plot diagram between off-shoring and in-shoring by numerous sub-sectors of the Canadian manufacturing sector 2007-2009.
The plot indicates a correlation between the levels of out-sourcing and in-sourcing for the majority of the subsectors.
Within themanufacturing sector, these industries include those producing electronics and related products, such as household appliances, telephone apparatus and radio and television broadcasting equipment, as well as transportation equipment, and some specialized machinery.
The number of industries for which there is net offshoring (percent of firms indicating that they offshore is greater than the number that inshore) only slightly outweighs the number of industries for which there is net inshoring. Within manufacturing the number of firms moving activities into Canada is greater than those moving activities out of Canada in motor vehicle, broadcasting equipment, communications equipment, pharmaceuticals as well as a number of resource processing sectors. The reverse is true (net offshoring) mainly in electronics producing industries.
Figure: 12
Inshoring and Offshoring of Business Activities in Manufacturing

Data: Statistics Canada – SIBS Survey.
Figure 12 Text Alternative
Figure 12 depicts the share of out-sourcing and in-sourcing of 14 activities in the Canadian manufacturing sector 2007-2009.
Among firms active in the production of goods 4.2 percent undertook off-shoring and 4.3 percent in-shoring; for the provision of services 1.0 percent off-shored and 1.4 percent in-shored; for distribution and logistics 1.2 percent off-shored and 1.7 percent in-shored; for call centers 0.4 percent off-shored and 0.6 percent in-shored; for marketing and sales 1.1 percent off-shored and 1.1 percent in-shored; for software development 0.4 percent off-shored and 0.2 percent in-shored; for data processing 0.6 percent off-shored and 0.3 percent in-shored; for information and communication technologies (ICT) 0.6 percent off-shored and 0.4 percent in-shored; for legal services 0.3 percent off-shored and 0.1 percent in-shored; for accounting 0.9 percent off-shored and 0.7 percent in-shored; for human resource (HR) management 0.6 percent off-shored and 0.5 percent in-shored; for financial management 0.8 percent off-shored and 0.6 percent in-shored; for financial management 0.8 percent off-shored and 0.6 percent in-shored; for engineering 0.8 percent off-shored and 0.8 percent in-shored; and for research and development (R&D) 0.7 percent off-shored and 0.8 percent in-shored.
Larger firms15, are far more likely to move activities…both in and out of Canada. From2007 to 2009, 17.6 percent of largemanufacturing firms relocated activities out of Canada while 12.1 percent moved activities into Canada, compared to only 3.5 percent and 3.1 percent, respectively, for small firms. While large firms were much more likely to offshore activities compared to inshoring activities (17.6 percent compared to 12.1 percent), small firms were more likely to do the reverse (3.1 percent for offshoring compared to 3.5 percent for inshoring). In terms of numbers, small firms carry significant weight, but much less so when values are considered.
A key aspect in the conceptual framework of global value chains is the idea of activities. While firms are usually organized by industries (such as the electronics industry) there can be a great deal of variation with respect to how firms organize themselves within an industry. For example, one firm may choose to be an integrated producerwith most activities taking place within the firm and within the home country while a competitor may focus on a few key activities and offshore or outsource much else. The Survey of Innovation and Business Strategy (SIBS) identifies 14 business activities (see chart) that are integral to the operation of most firms.16 Understanding the “footloose” nature of these fourteen activities (i.e. whether or not they are likely to be inshored or outshored) is crucial to understanding how GVCs work, and Canada’s global business operations within them.
Figure: 13
Outsourcing of Business Activities in Manufacturing

Data: Statistics Canada – SIBS Survey.
Figure 13 Text Alternative
Figure 13 depicts the percent share of Canadian manufacturing firms engaged in outsourcing in the 2007-2009 period.
Among firms active in the production of goods 8.1 percent undertook outsourcing; for the provision of services 2.2 percent outsourced; for distribution and logistics 1.9 percent outsourced; for call centers 0.4 percent outsourced; for marketing and sales 1.6 percent outsourced; for software development 0.7 percent outsourced; for data processing 0.4 percent outsourced; for information and communication technologies (ICT) 0.4 percent outsourced; for legal services 0.7 percent outsourced; for accounting 0.4 percent outsourced; for human resource (HR) management 0.2 percent outsourced; for financial management 0.2 percent outsourced; for financial management 0.2 percent outsourced; for engineering 1.1 percent outsourced; and for research and development (R&D) 0.7 percent outsourced.
Of these fourteen activities, the most footloose activity (the activity most likely to be offshored or inshored) is the production of goods. In terms of offshoring, the production of goods was nearly four times as likely to be offshored as the nextmost footloose activity, distribution and logistics. For inshoring, production of goods was about three times as likely to be inshored as the next most common activity.Overall, firms aremore likely to inshore than offshore provision of services as well as distribution and logistics, call centers and R&D, which may suggest that Canada has a comparative advantage in these activities. On the other hand, net offshoring is observed in data processing, ICT, legal and accounting services, among others. Calculations of net inshoring or offshoring must be interpreted with caution as we only have figures of the number of firms having offshored or inshored and not the scale of the activities being moved.
| Motivation | Respondents |
|---|---|
| * Those indicating medium or high motivation. | |
| Non-Labour Costs | 69.7% |
| Labour Costs | 63.7% |
| Delivery Times | 34.5% |
| Access to Knowledge | 34.0% |
| Logistics | 29.6% |
| Focus on Core Business | 28.8% |
| New goods or services | 28.6% |
| Following comp or clients | 28.4% |
| Tax or Financial | 20.3% |
| Lack of Labour | 18.0% |
| Other | 2.9% |
Data: Statistics Canada – SIBS Survey.
Outsourcing involves buying a good or service from abroad that may have at one point been produced internally or contracted out to a Canadian company.17 Not surprisingly, this is far more common than offshoring as it does not involve equity ownership of operations abroad. Overall, 4.1 percent of firms outsourced between 2007 and 2009, but the share was much higher for manufacturers, of which 10.1 percent outsourced over that period. By comparison, only 1.9 percent of firms and 5.2 percent ofmanufacturers offshored over the same period.
For manufacturers, the most common activity to be outsourced is the production of goods, followed by provision of services, distribution & logistics and marketing and sales. These results also reveal information about the types of activities that companies tend to like to do themselves abroad and those that they are willing to buy at arms length. Formanufacturers, legal services are far more likely to be purchased at arms length as indicated by the relatively high share in outsourcing (0.7 percent) compared to offshoring ( 0.3 percent). This is a reassuring result given the known preference for frequently hiring outside legal counsel, particularly in foreign markets. There is also a strong preference for contracting the provision of services, production of goods, and software development. By contrast, companies aremore likely to retain financialmanagement, HR and accounting services in-house.
Firms participating in the SIBS survey that either outsourced or offshored activities indicated that by far themost important reason for doing so was cost. Reduction of nonlabour cost was indicated as the most important factor while reduction of labour costswas ranked second. Thiswas the case for manufacturers and non-manufacturers alike. Although substantially less important than costs, access to new markets was cited by manufacturers as the third most important factorwhile non-manufacturers ranked access to specialized knowledge and technologies third. Both groups indicated that lack of available labour, and taxes or other financial incentives were not particularly important factors. These results show that, and as one might expect, themost important factor driving firms to outsource is indeed costs. This also supports the view that it is predominantly pull factors that drive offshoring and outsourcing: the emergence of large supplies of low-cost labour, as well as large and growing markets are driving offshoring and outsourcing, rather than push factors that make Canada an unappealing location fromwhich to do business. Again, this would be consistentwith the earlier findings that thesemovements are part of a circular flow and not a one-way exodus.
| Obstacles | Firms |
|---|---|
| * Those indicating medium or high motivation. | |
| Distance to producers | 55.5% |
| Identifying providers | 54.9% |
| Language or cultural | 45.1% |
| Tariffs | 43.9% |
| Foreign legal or admin | 41.3% |
| Lack of mgmt expertise | 37.4% |
| Cnd Legal or Admin. | 33.4% |
| Distance to customers | 32.7% |
| Concerns of employees | 32.0% |
| Lack of financing | 30.5% |
| Tax | 25.0% |
| International standards | 24.5% |
| Social Values | 20.4% |
| IP | 8.3% |
Data: Statistics Canada – SIBS Survey.
Roughly one fifth of firms surveyed indicated that they encountered obstacles when conducting offshoring or outsourcing. Interestingly, the proportion was about the same for small firms compared to the average. For respondents overall, foreign legal or administrative obstacles were identified as beingmost significant, followed by language or cultural barriers and distance to producers. Formanufacturers (shown) the prioritieswere somewhat different. Distance to producers was identified as the most important barrier followed by difficulties in identifying potential or suitable suppliers and language or cultural barriers.18 For both manufacturers and non-manufacturers alike, identifying suppliers and dealing with language and cultural issues and foreign legal or administrative issues were identified as being significant, which supports the role of the Canadian trade commissioner service (TCS) in overcoming these obstacles. Tariffs also rank among the top obstacles for manufacturing firms, suggesting the need for continued tariff reductions. Interestingly, concerns about offshoring and outsourcing conflicting with social values, concerns of employees and IP concerns were all identified as least important for both groups, which may point to the ability of firms to address those issues themselves.
Conclusions
Global production is increasingly being governed by global value chains (GVCs). The rise of GVCs has been driven by both technological as well as policy developments. While improvements in ICT and falling costs of transportation and telecommunications have likely played an important role, solid empirical support is still lacking. Only the important role of air transportation has been well established and even here a greater understanding is required, particularly for services trade. Among the policy drivers, the integration of new participants into the global economy has been found to be an important driver as has the related declining tariff rates and other barriers to trade.
There is good reason to believe that all participants, including Canada, are benefiting from the emergence of global value chains. Trade at amore fragmented level and in servicesmagnifies the potential gains from trade. Indeed, Canadian companies and workers can benefit as some low-skilled activities are offshored, which increases the productivity and competitiveness of Canadian companies and translates intomore and better paying jobs for Canadians. This is supported by the data, which show that as some activities are offshored, others are inshored.
The extent to which Canada can prosper within this rapidly changing global economic landscape will depend on Canada’s ability to create an economic environment that attracts and retains high-valued activities that will ensure a high and improving standard of living for all Canadians.
References
Alajääskö, Pekka, (2009) “ Features of International Sourcing in Europe in 2001-2006” Eurostat, Statistics in focus 73/2009.
Antras, Pol (2005), “Property Rights and the International Organization of Production”, American Economic Review, Papers and Proceedings, 95 (2), pp. 25-32.
Baier, Scott L. and Jeffrey H Bergstrand (1999), “The growth of world trade: tariffs, transport costs, and income similarity” Journal of International Economics 53 (2001) 1-27.
Baldwin, Richard (2011), “Integration of the North American Economy and New-paradigm Globalization”, in Aaron Sydor (ed) Global Value Chains: Impacts and Implications, Forthcoming.
Baldwin, Richard (2009), “Integration of the North American Economy and New-paradigm Globalization” Policy Research InitiativeWP049.
Bridgman, Benjamin (2008), “Energy prices and the expansion of world trade,” Review of Economic Dynamics 11(4), October: 904-916.
Caves, Richard E. (1971), “International Corporations: The Industrial Economics of Foreign Investment,” Economica. 38: 1-27.
De Backer, Koen and Norihiko Yamano (2011), “International Comparative Evidence on Global Value Chains”, in Global Value Chains: Impacts and Implications, Forthcoming.
Dunning, John H. (1997), “Trade, Location of Economic Activity and the MNE: A Search for an Eclectic Approach,” in Bertil Ohlin, Per Ove Hesselborn and Per Magnus Wijkman (eds.), The International Allocation of Economic Activity, London: Macmillan, 1977.
Feenstra, Robert (1998), “Integration of Trade and Disintegration of Production in the Global Economy”, Journal of Economic Perspectives, Fall, pp.31-50.
Globerman, Steven (2011) “Global Value Chains: Economic and Policy Issues”, in Global Value Chains: Impacts and Implications, Forthcoming.
Grossman, Gene and Esteban Rossi-Hansberg (2008), “ Trading Tasks: A Simple Theory Of Offshoring”, American Economic Review, 98 (5), pp. 1978-1997.
Helpman, Elhanan, Marc J. Melitz and Stephen R. Yeaple (2004), “Export Versus FDI with Heterogeneous Firms,” American Economic Review 94(1), March: 300-316.
Helpman, Elhanan (1984), “A simple theory of international trade with multinational corporations,” Journal of Political Economy 92(3): 451–471.
Hillberry, Russel H (2011), “Causes of International Production Fragmentation: Some Evidence”, in Global Value Chains: Impacts and Implications, Forthcoming.
Hummels, David (2007), “Transportation Costs and International Trade in the Second Era of Globalization,” Journal of Economic Perspectives 21(3), Summer: 131–154.
Hummels, David (2001), “Time as a Trade Barrier” Unpublished paper, Purdue University.
Jones, R.W. and H. Kierzkowski (1990), “The Role of Services in Production and International Trade: A Theoretical Framework” in R.W. Jones & A.O. Krueger (Eds), The Political Economy of International Trade: Essays in Honour of R.E. Baldwin, Oxford.
Krugman, Paul (1981), “Intra-industry Specialization and the Gains from Trade”, Journal of Political Economy, 89(5), October: 959-973.
Krugman, Paul (1980), “Scale Economies, Product Differentiation and the Pattern of Trade”, American Economic Review, 70(5), December: 950-959.
Krugman, Paul (1979), “Increasing Returns, Monopolistic Competition, and International Trade”, Journal of International Economics, 9, November: 469-480.
Porter,Michael E. (1998), “The Competitive Advantage of Nations”, Free Press.
Sydor, Aaron (2007), “The Rise of Global Value Chains”, Canada’s State of Trade: Trade and Investment Update – 2007, Ottawa: Minister of PublicWorks and Government Services Canada: 47-70.
Treffler, Daniel (2008), “Policy Responses to the New Offshoring: Think Globally, Invest Locally”, Ottawa: Industry Canada Working Paper Series, Nov. 25, 2008.
1 Coined by Antoine W. Van Agtmael during his tenure with the International Financial Corporation of the World Bank in 1981, the term “emerging economies” came into widespread use in the 2000s.
2 Originally coined by Jim O’Neill of Goldman Sachs in a 2001 paper “Building Better Global Economic BRICs” but made popular in O’Neill’s 2003 paper “Dreaming in BRICs.”
3 “The Rise of Global Value Chains” by Aaron Sydor, in the Seventh Annual Report on Canada’s State of Trade, “Trade and Investment Update – 2007.”
4 Adapted from the definition of global value chains used by GVC Initiative at Duke University.
5 In these models, gains from trade can result from reduced costs arising from economies of scale, from more efficient use of resources, from reducing distortions as one moves closer to perfect competition and from increased product variety.
6 Notwithstanding that within the economics canon, the term “global value chains” is rarely used, offshoring, outsourcing, trade in tasks etc. are considered for the present purposes to fall within the rubric of GVCs.
7 This special feature refers to activities. Distinguishing between tasks and activities is important but beyond the scope of this article.
8 Author’s calculations based on 1997 data from symmetric (industry by industry) I/O tables provided by Statistics Canada using purchaser prices in current Canadian dollars.
9 Based on 2007 near-peak fuel costs. Long-term elevated fuel prices could drive technological innovations or other adaptations aimed at saving fuel and lowering costs, e.g. reducing speed or decommissioning older vessels.
10 The recent global economic crisis is excluded here. That said, the general trends remain the same when data for 2009 and 2010 are included.
11 Available at UN comtrade.
12 A figure of 14.1 percent is obtained for 1961, but quickly falls suggesting that there may be a data issue with the first period in the series.
13 Outsourcing will refer to offshore outsourcing.
14 The data do not allow us to know the actual value of what was offshored or inshored or the employment associated with those movements and therefore we cannot know to what extent the scale of one is greater or less than the other.
15 Large firms are those with more than 500 employees, while medium employ between 100 and 500 and small firms less than 100.
16 The list of business activities is consistent with that used by Eurostat and by Michael Porter in “The Competitive Advantage of Nations.”
17 Once again “outsourcing” refers to offshore or foreign outsourcing.
18 Importance of obstacles are based on combining high and medium responses. There are some instances, however, where a response was marked high for a significant share of respondents without a correspondingly large medium share which lowers the overall score for that response. Specifically, for all industries, Canadian legal or administrative barriers would be ranked first based on high responses alone, while tariffs would have been ranked second for manufacturers. This may indicate that while these obstacles were not as widespread, for the firms that faced them, they were extremely important.
- Date Modified: