
CETA@5 Delivering trade benefits during unprecedented times
September 2022
Cette publication est aussi disponible en français sous le titre : AECG@5 : Générer des avantages commerciaux dans une période sans précédent
Information contained in this publication or product may be reproduced, in part or in whole, and by any means, for personal or public non-commercial purposes without charge or further permission, unless otherwise specified. Commercial reproduction and distribution are prohibited except with written permission from Global Affairs Canada.
For more information, contact:
Global Affairs Canada
125 Sussex Drive
Ottawa ON K1A 0G2
Canada
Telephone:
1-800-267-8376 (toll-free in Canada)
613-944-4000 (in the National Capital Region and outside Canada)
If you are deaf or hard of hearing, or if you have a speech impediment and use a text telephone, you can access the TTY service from 9 a.m. to 5 p.m. Eastern Time by calling 613-944-9136 (in Canada only)
Website: www.international.gc.ca
Email: info@international.gc.ca
© His Majesty the King in Right of Canada, as represented by the Minister of International Trade, Export Promotion, Small Business and Economic Development, 2022.
Cat. No. FR5-190/2022E-PDF
ISBN 978-0-660-45433-7 (PDF)
Key points
- Trade between Canada and the EU has seen impressive growth since CETA implementation. Despite the COVID-19 pandemic, two-way trade grew to a record high of $100 billion in 2021, an increase of 33.7% compared to the 2016 level, and outpacing the 18.6% growth recorded by overall Canadian merchandise trade over the same period.
- Canadian exports to the EU reached a record high of $32.5 billion in 2021, an increase of 46.4% from 2016. Over the same period, Canadian merchandise imports from the EU rose 28.4%. The number of Canadian firms exporting to the EU increased significantly over this period, the large majority being SMEs.
- Canadian exports that received tariff reductions from CETA grew 24.6% between 2016 and 2021. Products that saw the largest tariff reductions experienced the fastest growth: those that experienced a tariff reduction of more than 10 percentage points grew by 54.5%; those that received a reduction of between 5 and 10 percentage points grew by 36.2%; and those witnessing a reduction of between 0.1 and 5 percentage points grew by 19.5%.
- CETA is supporting increased trade in environmental goods, helping both Canada and EU member states achieve their climate change goals. Trade in environmental goods between Canada and the EU grew 21.8% in 2021 compared to 2016.
- The utilization of CETA preferences was 65.4% in 2021 for Canadian exports to the EU, an increase of 13.4 percentage points when compared to 2018. The utilization of CETA preferences for imports by Canada from the EU was slightly lower at 59.5% in 2021, but a sharp increase from the 38.4% utilization rate in 2018.
- Thanks to CETA, it is estimated that as much as $890.6 million was saved in duties in 2021 alone, which contributes to increased competitiveness for Canadian businesses and reduced prices for Canadian consumers. Nevertheless, if CETA preferences were fully utilized, an additional $415.5 million in savings could be realized.
Canada-EU trade performanceFootnote 1
Overview
As a group, the 27 European Union membersFootnote 2 (referred to as the EU hereafter), represent Canada’s third largest merchandise trading partner after the United States and China. In 2021, the EU accounted for 4.8% of Canada’s merchandise exports (the 2nd most important destination for Canadian merchandise exports) and 11.0% of Canada’s merchandise imports (the 3rd largest source).Footnote 3 , Footnote 4
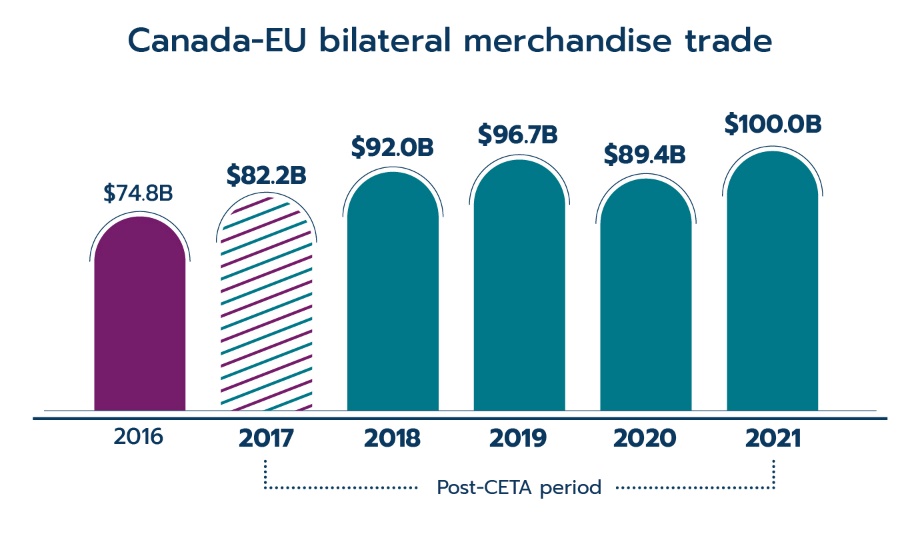
On September 21, 2017, the Canada-European Union Comprehensive Economic and Trade Agreement (CETA) provisionally entered into force, meaning that 2022 marks the fifth anniversary of the agreement. Two-way merchandise trade between Canada and the EU improved almost every year since CETA implementation (except in 2020), growing to a record high of $100 billion in 2021, an increase of 33.7% compared to the level recorded in 2016 – the last full-year before preferential tariff treatment under CETA was applicable. For comparison, overall Canadian merchandise trade expanded by 18.6% over the same period.
Furthermore, despite global economic challenges due to the COVID-19 pandemic heavily disrupting international trade flows in 2020, trade between Canada and the EU proved to be relatively resilient. Trade contracted by 7.6% in 2020 (compared to a 10.7% decline for overall Canadian merchandise trade), and it quickly rebounded in 2021 to 3.4% above its pre-pandemic level in 2019.Footnote 5
Text version
| Year | Value ($B) |
|---|---|
| 2016 | 74.8 |
| 2017 | 82.2 |
| 2018 | 92.0 |
| 2019 | 96.7 |
| 2020 | 89.4 |
| 2021 | 100.0 |
Data: Eurostat and Statistics Canada
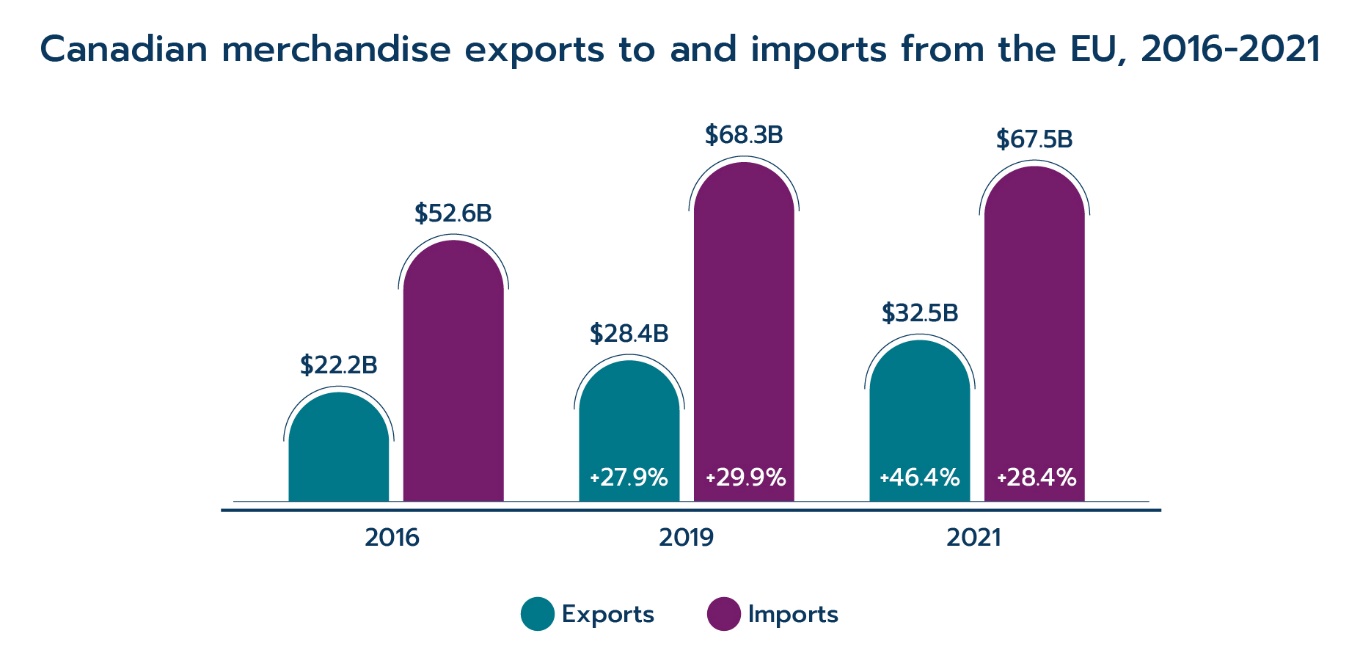
Canadian merchandise exports to the EU recorded exceptional growth since the agreement came into force. From 2016 to 2021, they expanded from $22.2 billion to a record high of $32.5 billion, an increase of 46.4%. Footnote 6 Over the same period, Canadian merchandise imports from the EU rose 28.4% to $67.5 billion in 2021.
Text version
| 2016 | 2019 | 2021 | |
|---|---|---|---|
| Exports | $22.2B | $28.4B | $32.5B |
| Imports | $52.6B | $68.3B | $67.5B |
* Growth from pre-CETA levels
Data: Eurostat and Statistics Canada
A growing number of Canadian firms trade with the EU
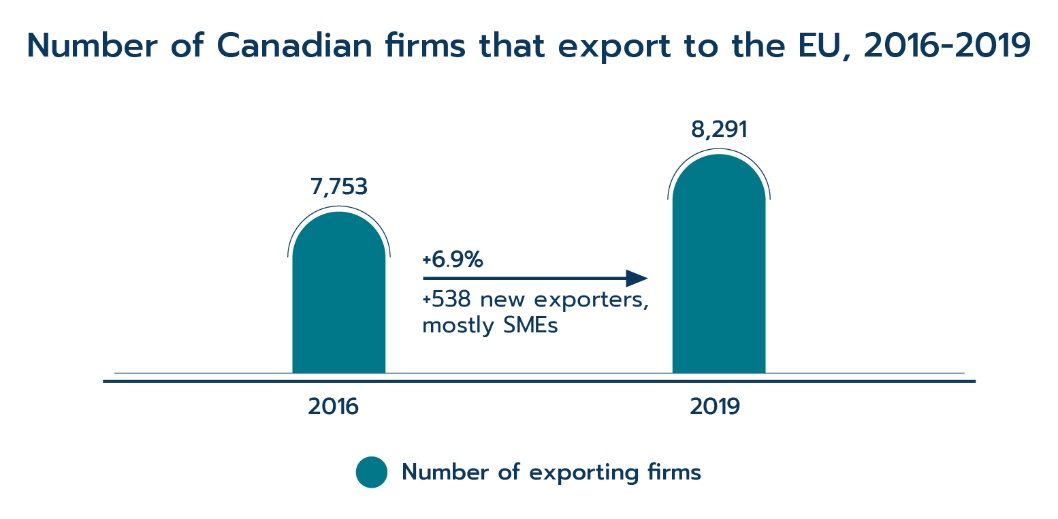
In addition to the impressive growth in trade values, the number of Canadian businesses that engage in trade with the EU has also increased since CETA implementation. From 2016 to 2019,Footnote 7 the number of Canadian firms that exported goods to the EU rose from 7,753 to 8,291. Small and medium-sized enterprises (SMEs) were the main driver of this growth, expanding from 7,295 SME exporters in 2016 to 7,787 in 2019. Moreover, 11.7% of Canadian firms exporting to the EU are majority-owned by women, making the EU one of the most important destinations for women-owned firms.Footnote 8 Over the same period, the number of Canadian firms that imported goods from the EU increased by 6.2%, from 45,472 in 2016 to 48,286 in 2019. It is broadly the case that there are far more firms that import than export, and this is no different for Canada’s trade with the EU.
Text version
Number of exporting firms in 2016 was 7,753.
Number of exporting firms in 2019 was 8,291.
Data: Statistics Canada
Trade by partner
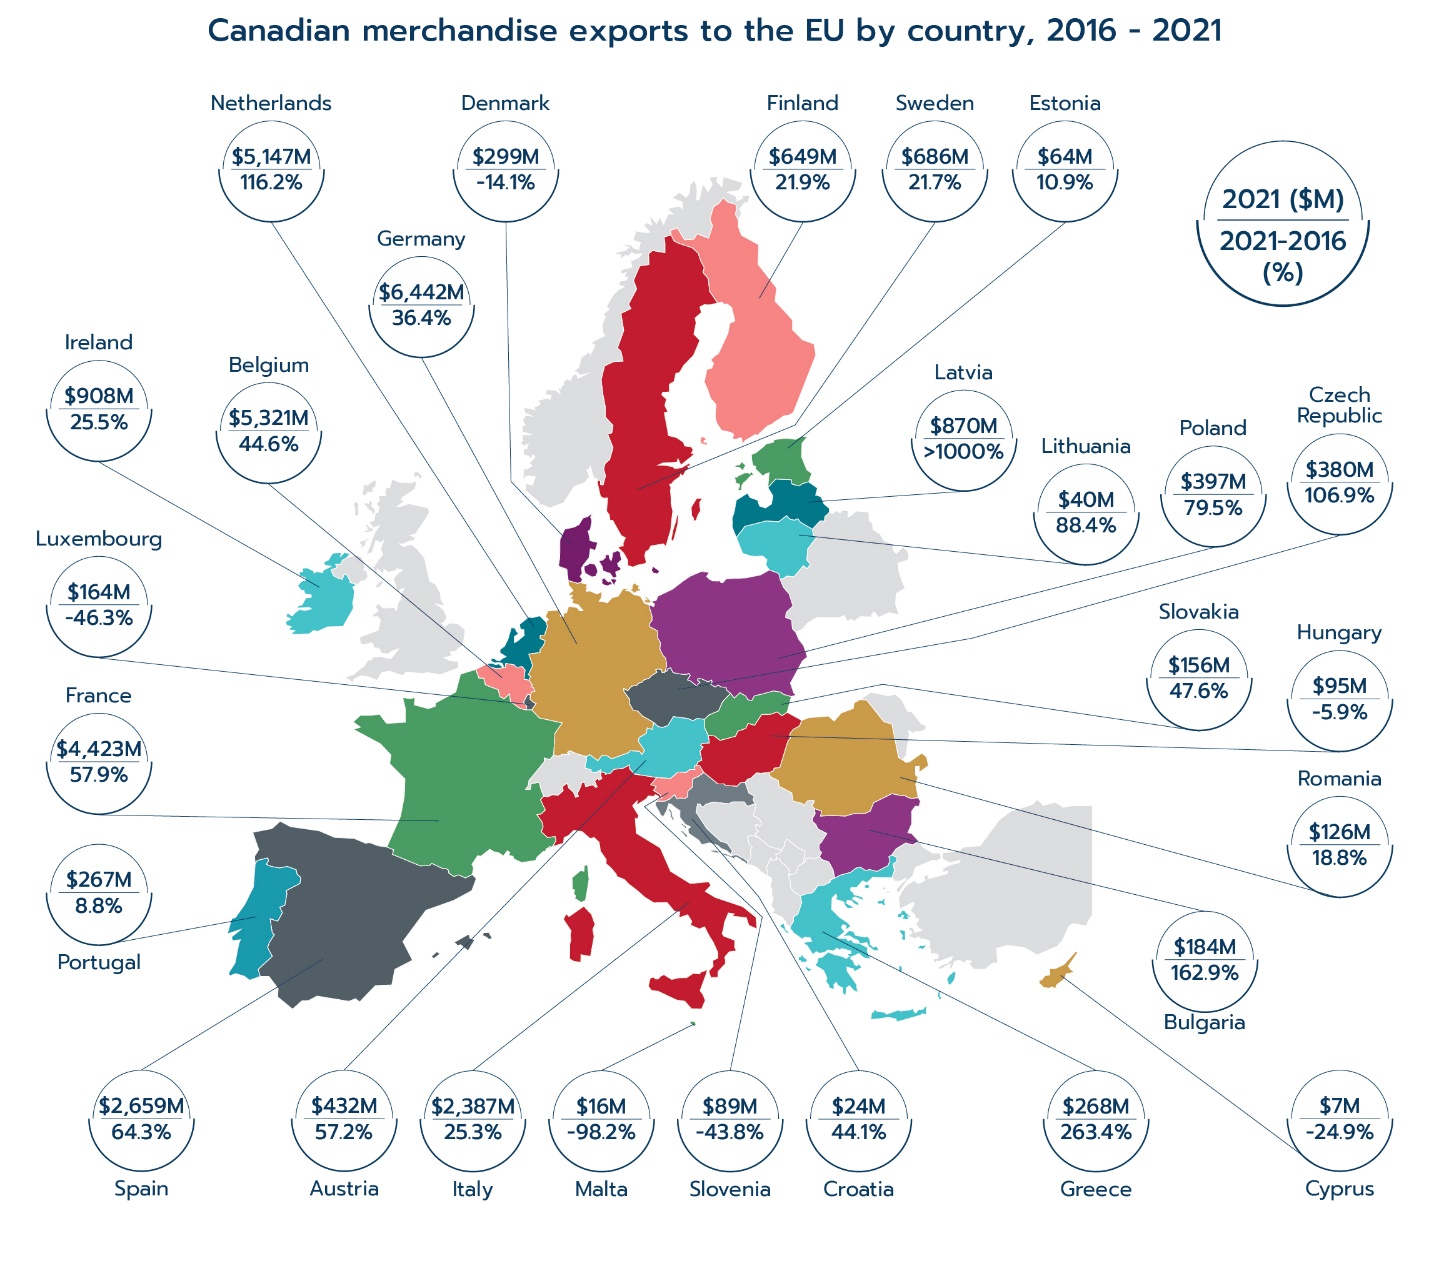
The expansion in Canadian merchandise exports to the EU since CETA implementation was mainly due to increased exports to five EU member states: the Netherlands, Germany, Belgium, France, and Spain. These five members accounted for 85% of the total increase in Canadian exports to the EU. Germany is Canada’s largest export destination in the region. Led by increased exports of Mineral ores (iron ores) and Precious stones and metals, Canadian exports to Germany increased by $1.7 billion, or 36.4%, since 2016. Over the same period, Canadian exports to the Netherlands posted the largest growth among all EU members by far, advancing by 116.2%, or $2.8 billion, since 2016, largely as a result of higher exports of Mineral ores, Aluminum, and Energy products. Canadian exports to Belgium and France also recorded impressive growth, primarily due to increased shipments of Precious stones and metals and Pharmaceutical products to Belgium and Mineral ores to France.
Despite the importance of these five members, growth in Canadian exports to the EU was widespread and a number of less traditional trade partners saw especially rapid expansion. Canadian exports to Latvia, the Czech Republic, Greece, Poland, Bulgaria, and Lithuania grew by more than 230%, or nearly $1.5 billion.
At the sector level, three of the top five Canadian export sectors registered impressive growth since 2016. Ores, slag and ash was the top export sector for Canada, posting the largest growth at 163.2%, or $4.1 billion. Precious stones and metals (+87.0%) and Mineral fuels and oils (+63.2%) also recorded strong growth over this period. On the other hand, Canadian exports of Aircraft and parts contracted by 18.7%, while Machinery exports fell by 9.3% from 2016 to 2021.
Text version
| Country | 2021 ($M) | 21/16 (%) |
|---|---|---|
| Germany | 6,442 | 36.4 |
| Belgium | 5,321 | 44.6 |
| Netherlands | 5,147 | 116.2 |
| France | 4,423 | 57.9 |
| Spain | 2,659 | 64.3 |
| Italy | 2,387 | 25.3 |
| Ireland | 908 | 25.5 |
| Latvia | 870 | >1000% |
| Sweden | 686 | 21.7 |
| Finland | 649 | 21.9 |
| Austria | 432 | 57.2 |
| Poland | 397 | 79.5 |
| Czech Republic | 380 | 106.9 |
| Denmark | 299 | -14.1 |
| Greece | 268 | 263.4 |
| Portugal | 267 | 8.8 |
| Bulgaria | 184 | 162.9 |
| Luxembourg | 164 | -46.3 |
| Slovakia | 156 | 47.6 |
| Romania | 126 | 18.8 |
| Hungary | 95 | -5.9 |
| Slovenia | 89 | -43.8 |
| Estonia | 64 | 10.9 |
| Lithuania | 40 | 88.4 |
| Croatia | 24 | 44.1 |
| Malta | 16 | -98.2 |
| Cyprus | 7 | -24.9 |
Data: Eurostat
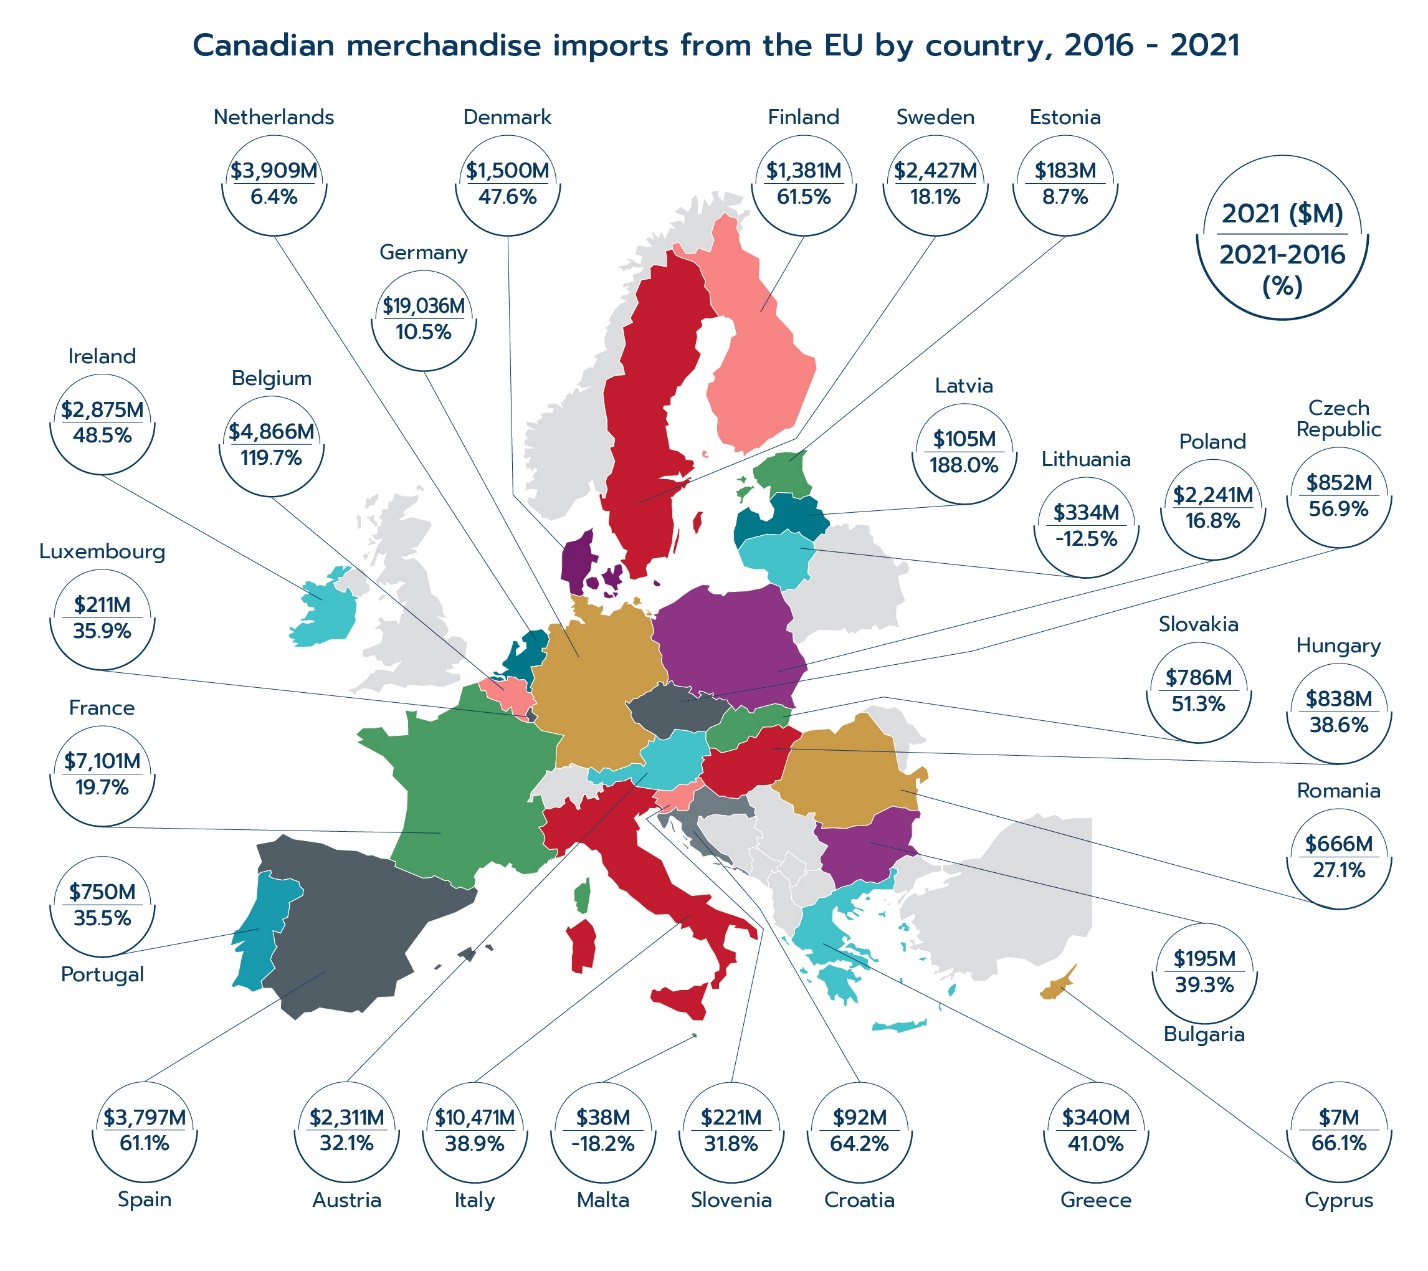
At the same time, Canada also recorded a substantial growth in imports from the EU since CETA implementation. Imports from Italy registered the largest expansion, rising by $2.9 billion, or 38.9%, mainly due to increased imports of Machinery and Precious stones and metals (platinum). Imports from Belgium (Automotive products and Pharmaceuticals), Germany (Pharmaceuticals), Spain (Machinery and Pharmaceuticals), and France (Aerospace products) also posted strong growth of over $1 billion since 2016.
Four of the top five import sectors also registered growth since CETA implementation. Machinery, the largest sector, expanded by 23.8%, or $2.4 billion, since 2016, as higher imports of a wide range of machinery and equipment were only partially offset by lower imports of turbojet and turbopropellers. Due to increased demand for essential medical goods since the onset of the global pandemic, Canadian imports of Pharmaceutical products from the EU posted the largest growth at $3.1 billion, or 55.9%, when compared to 2016. Blood products and Medicaments were the main drivers of this growth. Conversely, Canadian imports of Motor vehicles and parts, and Mineral fuels and oils registered single-digit growth over the same period, while imports of Electronics from the EU edged down 0.7%.
Text version
| Country | 2021 ($M) | 21/16 (%) |
|---|---|---|
| Germany | 19,036 | 10.5 |
| Italy | 10,471 | 38.9 |
| France | 7,101 | 19.7 |
| Belgium | 4,866 | 119.7 |
| Netherlands | 3,909 | 6.4 |
| Spain | 3,797 | 61.1 |
| Ireland | 2,875 | 48.5 |
| Sweden | 2,427 | 18.1 |
| Austria | 2,311 | 32.1 |
| Poland | 2,241 | 16.8 |
| Denmark | 1,500 | 47.6 |
| Finland | 1,381 | 61.5 |
| Czech Republic | 852 | 56.9 |
| Hungary | 838 | 38.6 |
| Slovakia | 786 | 51.3 |
| Portugal | 750 | 35.5 |
| Romania | 666 | 27.1 |
| Greece | 340 | 41.0 |
| Lithuania | 334 | -12.5 |
| Slovenia | 221 | 31.8 |
| Luxembourg | 211 | 35.9 |
| Bulgaria | 195 | 39.3 |
| Estonia | 183 | 8.7 |
| Latvia | 105 | 188.0 |
| Croatia | 92 | 64.2 |
| Malta | 38 | -18.2 |
| Cyprus | 7 | 66.1 |
Data: Statistics Canada
Trade by province and territoryFootnote 9
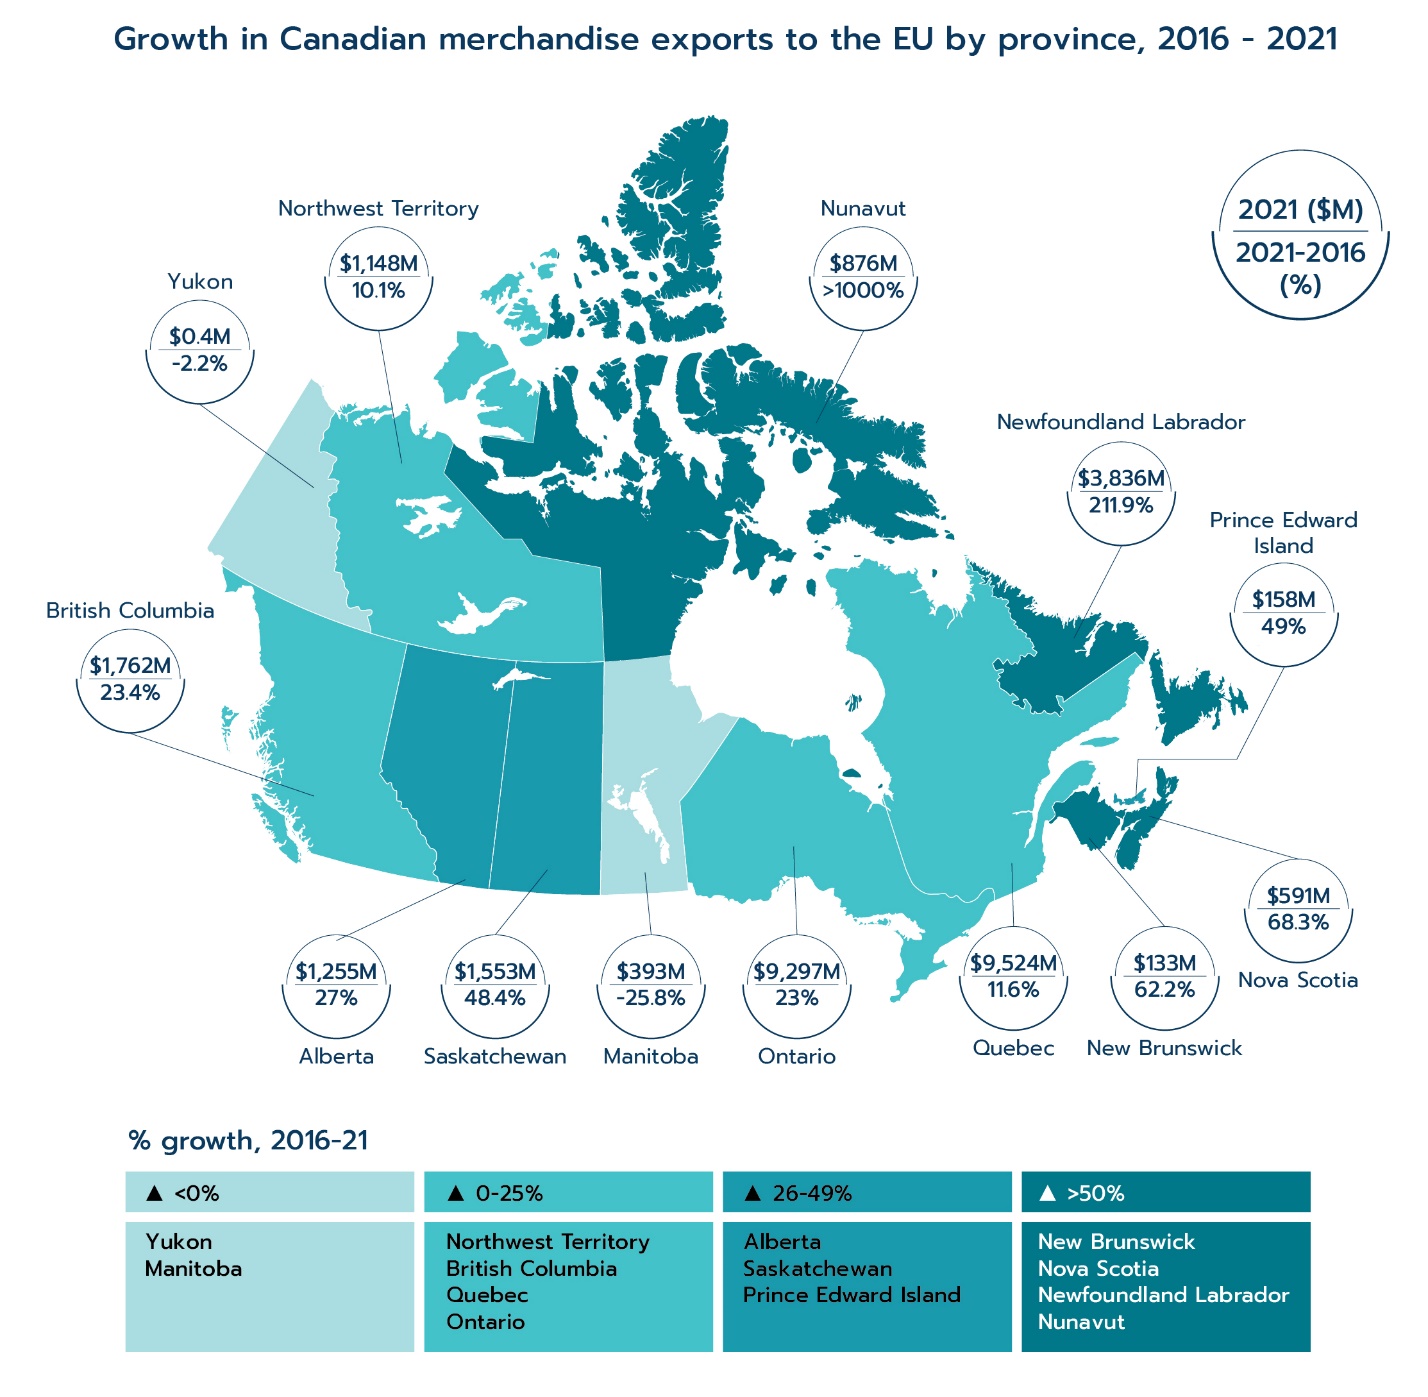
Eleven of the thirteen Canadian provinces and territories posted an increase in exports to the EU from 2016 to 2021. Newfoundland and Labrador led all regions as its exports to the EU more than tripled compared to the pre-CETA year, mainly from higher exports of Energy products and Mineral ores. Quebec (widespread growth) and Ontario (Precious stones and metals), the top two exporting provinces, also recorded substantial growth. In contrast, Manitoba’s exports to the EU fell by 25.8% since 2016, as higher exports of Oil seeds and Vegetables were offset by lower shipments of Mineral ores and Nickel.
Text version
| Province | 2021 ($M) | 21/16 (%) |
|---|---|---|
| Quebec | 9,524 | 11.6 |
| Ontario | 9,297 | 23 |
| Newfoundland Labrador | 3,836 | 211.9 |
| British Columbia | 1,762 | 23.4 |
| Saskatchewan | 1,553 | 48.4 |
| Alberta | 1,255 | 27 |
| Northwest Territory | 1,148 | 10.1 |
| Nunavut | 876 | >1000 |
| Nova Scotia | 591 | 68.3 |
| Manitoba | 393 | -25.8 |
| Prince Edward Island | 158 | 49 |
| New Brunswick | 133 | 62.2 |
| Yukon | 0.4 | -2.2 |
Data: Statistics Canada
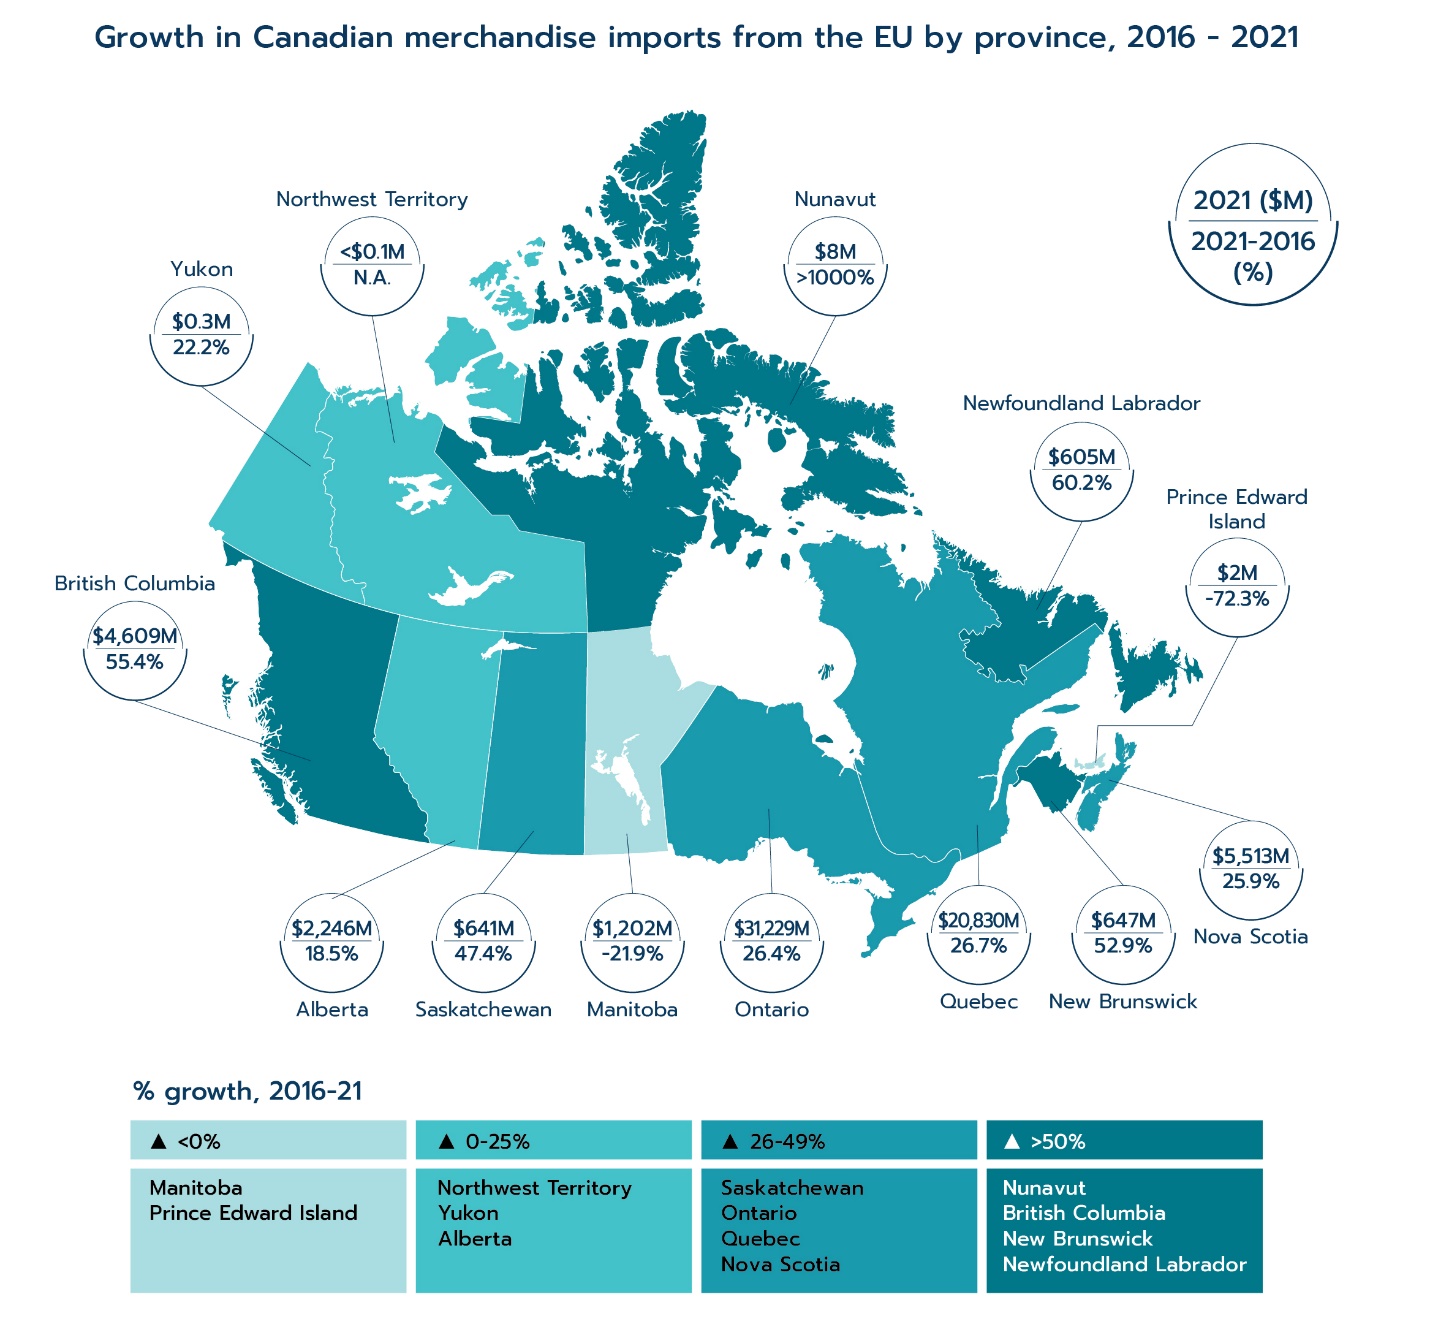
Similar to exports, nearly every Canadian province and territory reported growth in imports since CETA implementation. Ontario recorded the largest growth, with a rise of $6.5 billion, mainly due to increased imports of Pharmaceuticals. Quebec (Machinery), Nova Scotia (Automotive products), and British Columbia (Machinery) also registered large growth in imports.
Text version
| Province | 2021 ($M) | 21/16 (%) |
|---|---|---|
| Ontario | 31,229 | 26.4 |
| Quebec | 20,830 | 26.7 |
| Nova Scotia | 5,513 | 25.9 |
| British Columbia | 4,609 | 55.4 |
| Alberta | 2,246 | 18.5 |
| Manitoba | 1,202 | 21.9 |
| New Brunswick | 647 | 52.9 |
| Saskatchewan | 641 | 47.4 |
| Newfoundland Labrador | 605 | 60.2 |
| Nunavut | 8 | >1000 |
| Prince Edward Island | 2 | -72.3 |
| Yukon | 0.3 | 22.2 |
| Northwest Territory | <0.1M | N.A. |
Data: Statistics Canada
Trade growth by CETA preferencesFootnote 10
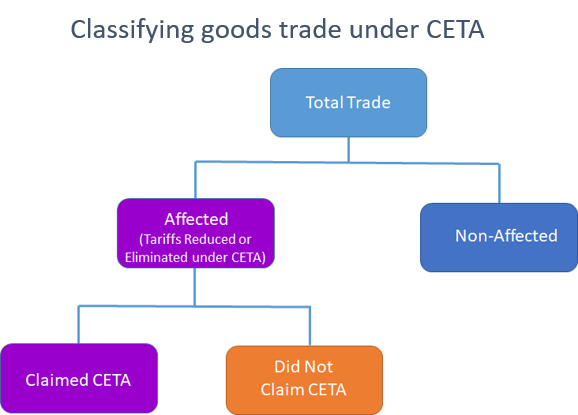
Overall trade growth provides only a limited understanding of the effects of CETA as many factors can impact on trade expansion. For a more direct assessment of the effects of CETA, one can focus on trade in products that experienced tariff reductions under the agreement.Footnote 11 Approximately 25% of total Canadian exports to the EU in 2021 ($8.2 billion, or €5.5 billion) would have been dutiableFootnote 12 (subject to duties) in the absence of CETA. From 2019 onward, the EU had unilaterally made more products duty-free for all countries including Canada. This resulted in fewer products being subject to CETA preferential tariff rates—which contributed largely to the 7.7% decrease in the value of Canada’s dutiable exports to the EU between 2016 and 2021.Footnote 13 Canada had also exported somewhat fewer dutiable products, mostly Aircrafts and parts, as well as Machinery. At the same time, duty-free exports to the EU increased 83.3% compared to 2016 as a result of increases in Ores, slag and ash, Aircraft and parts, and Precious stones and metals. Strong economic growth after the pandemic as economies rebounded drove commodity prices higher and contributed to the rapid increase in the value of Canadian exports in these sectors.Footnote 14
Text version
Total trade can be divided into Affected (Tariffs reduced or eliminated under CETA) and Non-affected. Affected trade can then be further divided into two parts: claimed CETA and did not claim CETA.
Source: Global Affairs Canada
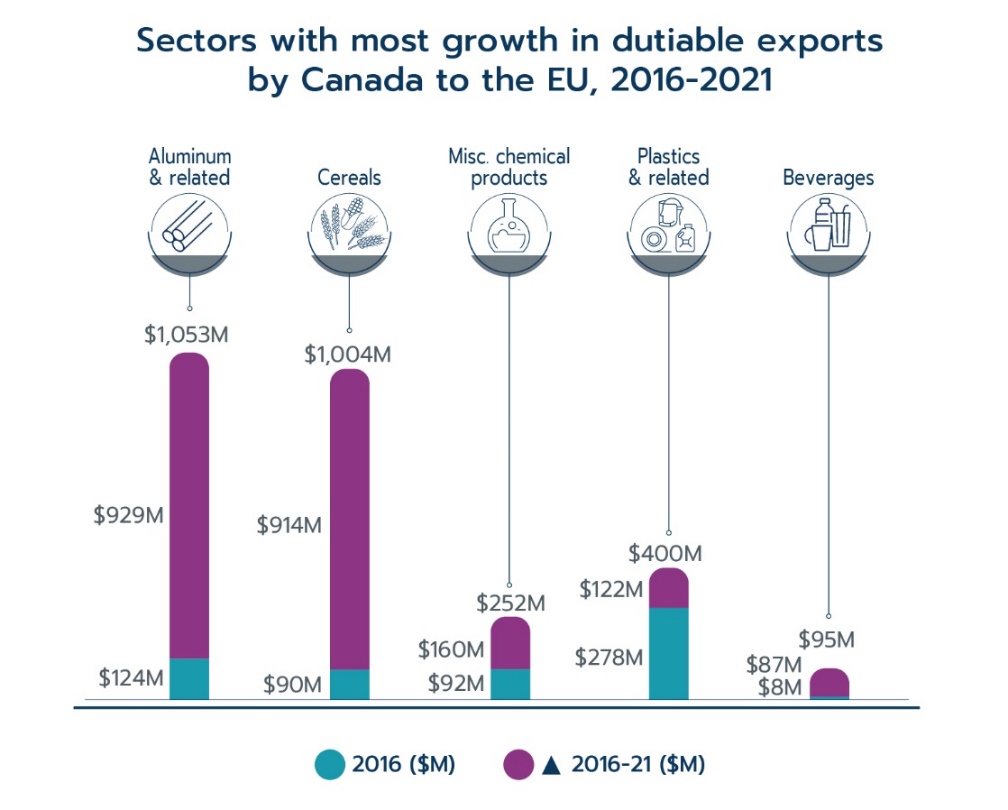
The figure below shows the sectors that experienced the largest growth in Canadian exports of dutiable products to the EU by value from 2016 to 2021.Footnote 15 Sectors that recorded the largest growth in their dutiable exports are Aluminum, Cereals, Miscellaneous chemical products, Plastics, and Beverages. Total growth in dutiable exports by these sectors represented 76.8% of the total positive growth in exports of dutiable products.
Text version
| Sector | 2016 ($M) | 2016-21 ($M) | 2021 ($M) |
|---|---|---|---|
| Aluminum & related | $124M | $929M | $1,053M |
| Cereals | $90M | $914M | $1,004M |
| Misc. chemical products | $92M | $160M | $252M |
| Plastics & related | $278M | $122M | $400M |
| Beverages | $8M | $87M | $95M |
Data: Eurostat and EU Custom Tariff (TARIC)
Dutiable imports by Canada from the EU totalled $16.7 billion in 2021, or 24.7% of all merchandise imports. This represents an increase of 15.1% compared to 2016. The increase came mostly from gains in Beverages, Ships and boats, and Precious stones and metals. Duty-free imports by Canada from the EU totalled $50.3 billion in 2021, an increase of 34.2% compared to 2016, mostly due to large advances in Pharmaceutical products, Machinery, and Precious stones and metals. Canadian sectors that experienced the largest growth in imports of dutiable products from the EU by value from 2016 to 2021are Beverages, Ships and boats, Precious stones and metals, Articles of leather, and Furniture and bedding. Total growth of dutiable imports in these sectors made up 36.8% of the total positive growth in imports of dutiable products.

Text version
| Sector | 2016 ($M) | 2016-21 ($M) | 2021 ($M) |
|---|---|---|---|
| Beverages | $1,316M | $414M | $1,730M |
| Ships & boats | $264M | $267M | $531M |
| Precious stones & metals | $194M | $205M | $399M |
| Leather products | $344M | $177M | $521M |
| Furniture & bedding | $513M | $159M | $672M |
Data: Statistics Canada and Canada Border Services Agency
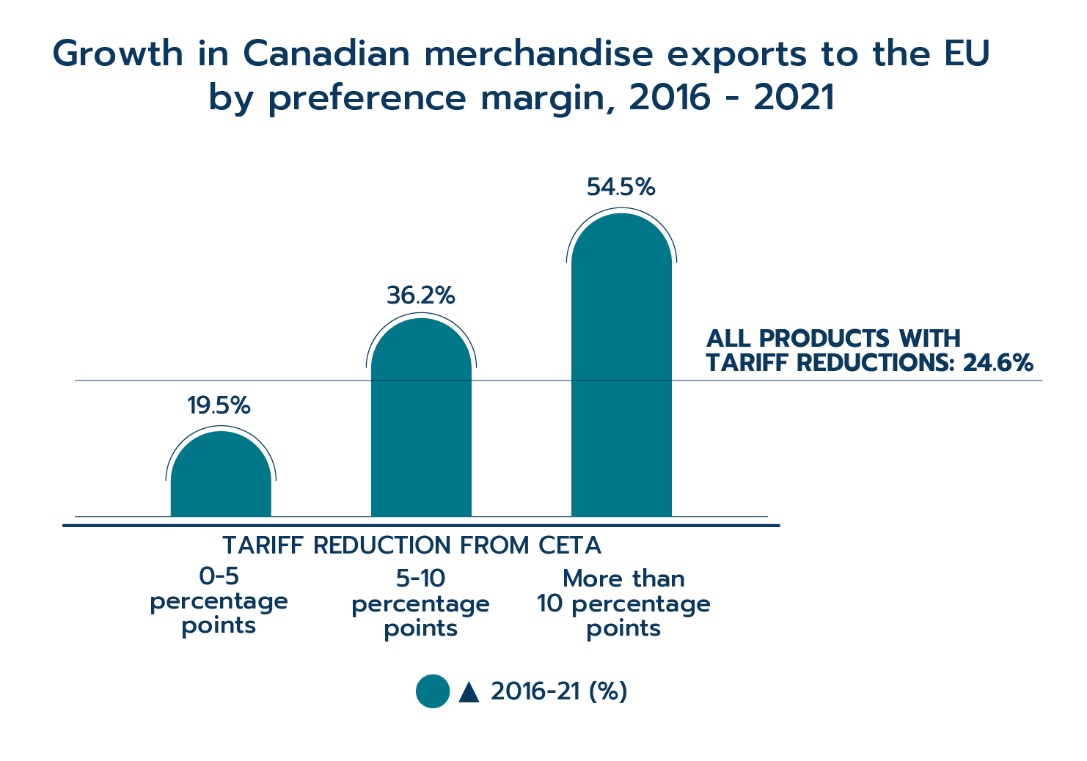
Trade can also be divided into categories based on preference marginsFootnote 16 and grouped by CETA tariff reductions in percentage points. Canadian exports increased in all preference margin categories, but products that enjoy the largest tariff reductions also saw the largest growth. The group of products that received tariff reductions of more than 10 percentage points had the strongest growth at 54.5%. Products benefiting from tariff reductions of between 5 and 10 percentage points grew 36.2%, while those with between 0 and 5 percentage points of tariff reductions expanded 19.5%. In total, the entire group of products that received tariff reductions under CETA grew 24.6% from 2016 to 2021.
Text version
| % change | |
|---|---|
| 0-5 percentage points | 19.5 |
| 5-10 percentage points | 36.2 |
| More than 10 percentage points | 54.5 |
| All products with tariff reductions | 24.6 |
Data: Eurostat and EU Custom Tariff (TARIC)
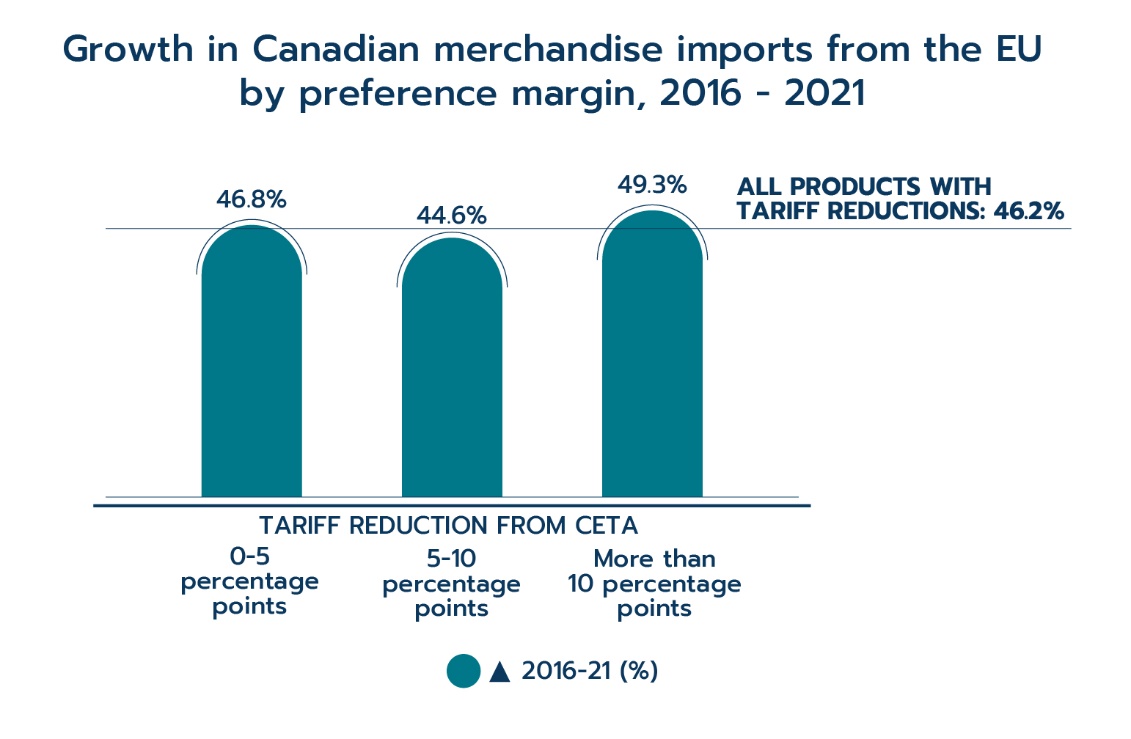
Canadian imports from the EU show widespread gains in all categories of tariff reduction between 2016 and 2021. Products that received more than 10 percentage points of tariff reduction had the strongest growth at 49.3%. The group of products receiving between 0 to 5 percentage points of tariff reduction grew 46.8%, while those with between 5 to 10 percentage points of tariff reduction expanded by 44.6%.
Text version
| % change | |
|---|---|
| 0-5 percentage points | 46.8 |
| 5-10 percentage points | 44.6 |
| More than 10 percentage points | 49.3 |
| All products with tariff reductions | 46.2 |
Data: Statistics Canada and Canada Border Services Agency
Trade in environmental goodsFootnote 17
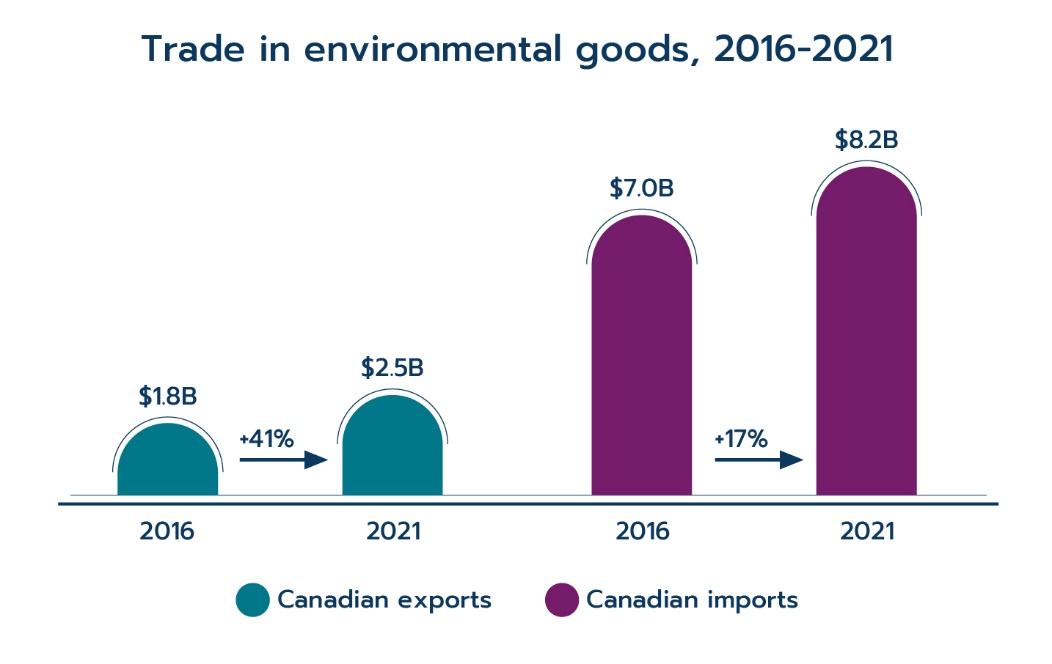
CETA additionally supports efforts by Canada and EU member states to fight climate change by making environmental goods less expensive and thus encouraging their adoption. Total bilateral trade in environmental goods between Canada and the EU amounted to $10.7 billion in 2021, an increase of 21.8% compared to a total of $8.8 billion in 2016.
Text version
| 2016 | 2021 | |
|---|---|---|
| Canadian exports | $1.8B | $2.5B |
| Canadian imports | $7.0B | $8.2B |
Data: Statistics Canada and Eurostat
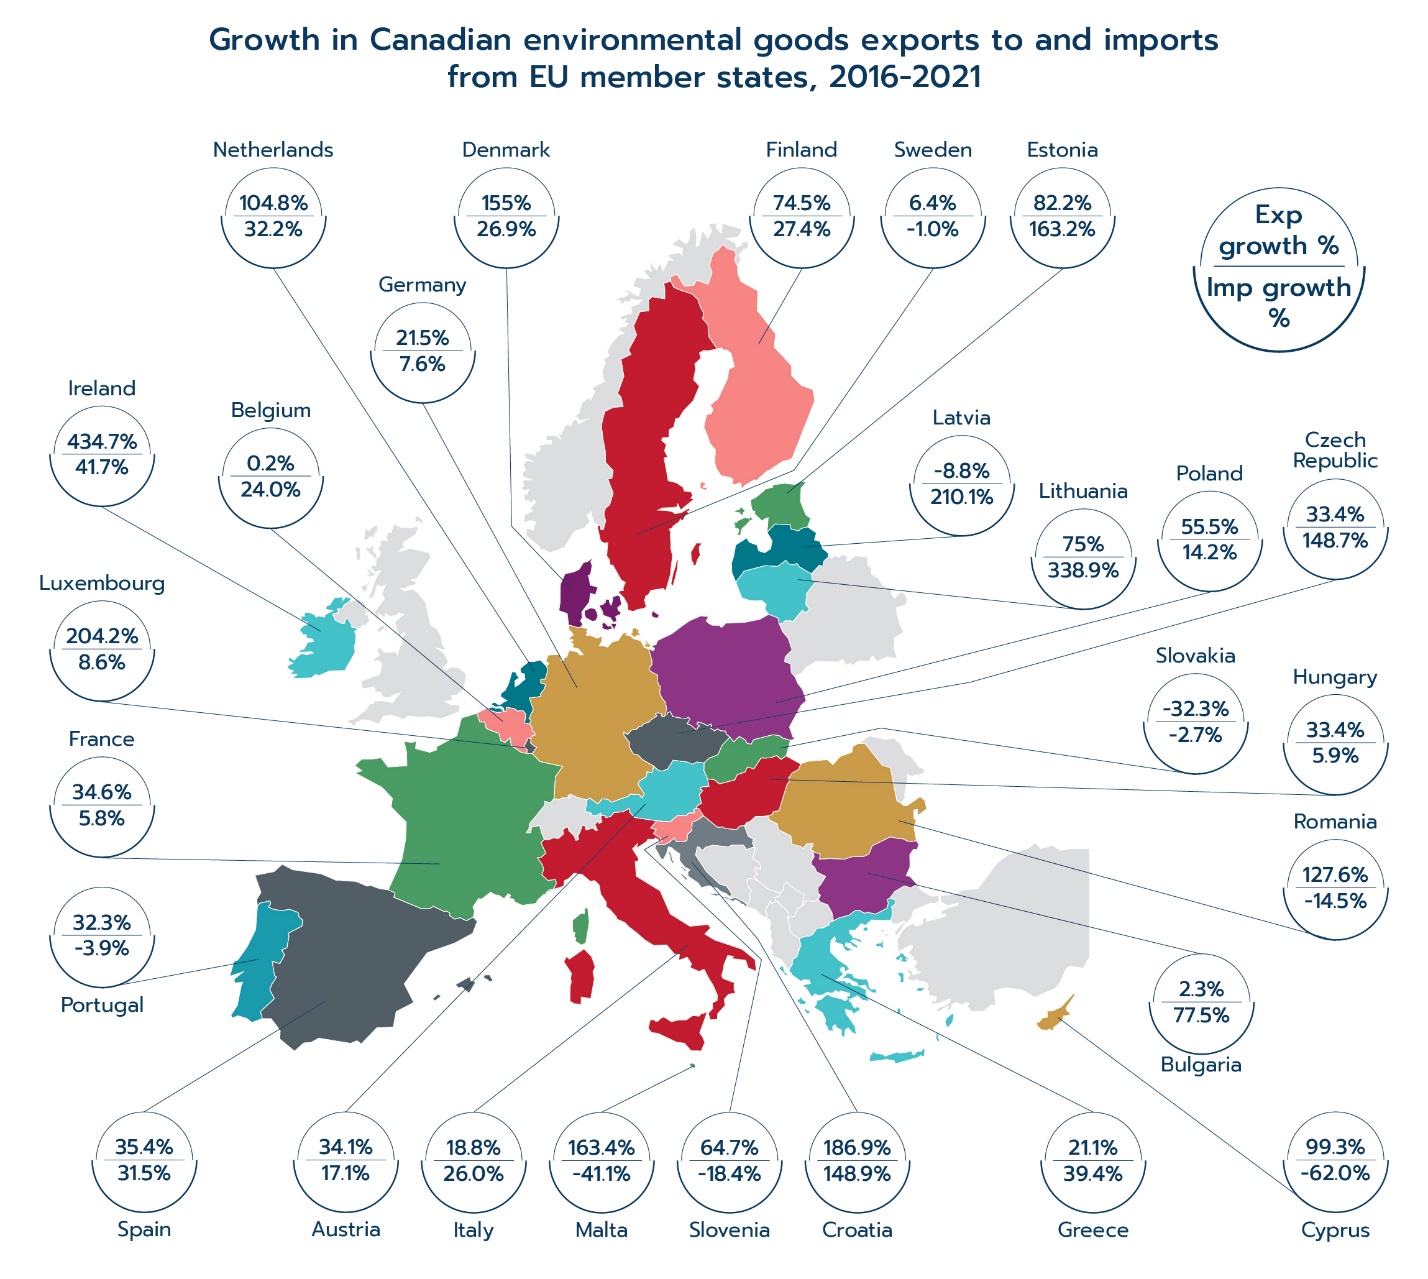
Canadian exports of environmental goods to the EU are smaller than imports, but are growing more quickly. Canadian exports of environmental goods to the EU increased 40.9%, from $1.8 billion in 2016 to $2.5 billion in 2021. The largest increase by value comes from exports to the Netherlands with a gain of $208 million; followed by Germany at $124 million and Ireland at $100 million. In total, Canadian exports of environmental goods increased at double-digit rates to 15 EU member states and at triple-digit rates to 7 EU member states since the implementation of CETA.
Text version
| Country | Export growth % | Import growth % |
|---|---|---|
| Netherlands | 104.8 | 32.2 |
| Germany | 21.5 | 7.6 |
| Ireland | 434.7 | 41.7 |
| France | 34.6 | 5.8 |
| Denmark | 155.0 | 26.9 |
| Italy | 18.8 | 26.0 |
| Spain | 35.4 | 31.5 |
| Poland | 55.5 | 14.2 |
| Finland | 74.5 | 27.4 |
| Austria | 34.1 | 17.1 |
| Luxembourg | 204.2 | 8.6 |
| Romania | 127.6 | -14.5 |
| Czech Republic | 33.4 | 148.7 |
| Hungary | 33.4 | 5.9 |
| Sweden | 6.4 | -1.0 |
| Croatia | 186.9 | 148.9 |
| Portugal | 32.3 | -3.9 |
| Estonia | 82.2 | 163.2 |
| Lithuania | 75.0 | 338.9 |
| Malta | 163.4 | -41.1 |
| Greece | 21.1 | 39.4 |
| Slovenia | 64.7 | -18.4 |
| Cyprus | 99.3 | -62.0 |
| Belgium | 0.2 | 24.0 |
| Bulgaria | 2.3 | 77.5 |
| Latvia | -8.8 | 210.1 |
| Slovakia | -32.3 | -2.7 |
Data: Eurostat and Statistics Canada
Canadian imports of environmental goods from the EU, on the other hand, increased $1.2 billion (or 17.1%) from $7.0 billion in 2016 to reach $8.2 billion in 2021. The largest increase by value came from imports from Italy, which increased by $256 million, followed by Germany at $201 million, and the Czech Republic at $142 million.
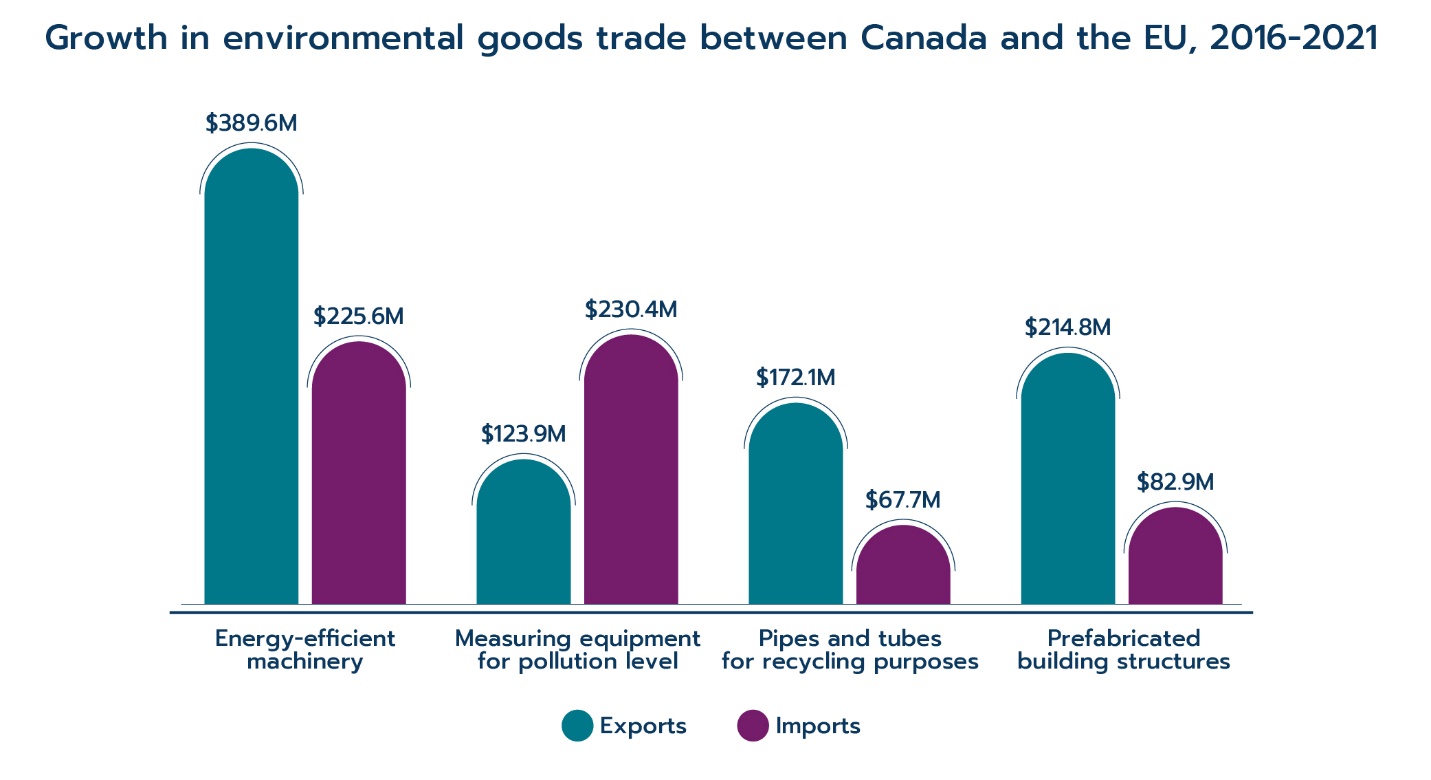
At the sector level, Canadian exports of energy-efficient machinery grew close to $390 million between 2016 and 2021. It was also the single largest group of products traded between Canada and the EU, at $6.1 billion in 2021. This is up considerably from the $5.5 billion registered prior to CETA. Prefabricated building structures, and pipes and tubes for recycling purposes recorded strong growth post-CETA as well. Measuring equipment for pollution level and energy-efficient machinery were the two strongest performing sectors in imports from the EU in 2021 compared to 2016 as both grew over $200 million.
Text version
| Exports | Imports | |
|---|---|---|
| Energy-efficient machinery | $389.6M | $225.6M |
| Measuring equipment for pollution level | $123.9M | $230.4M |
| Pipes and tubes for recycling purposes | $172.1M | $67.7M |
| Prefabricated building structures | $214.8M | $82.9M |
Data: Eurostat and Statistics Canada
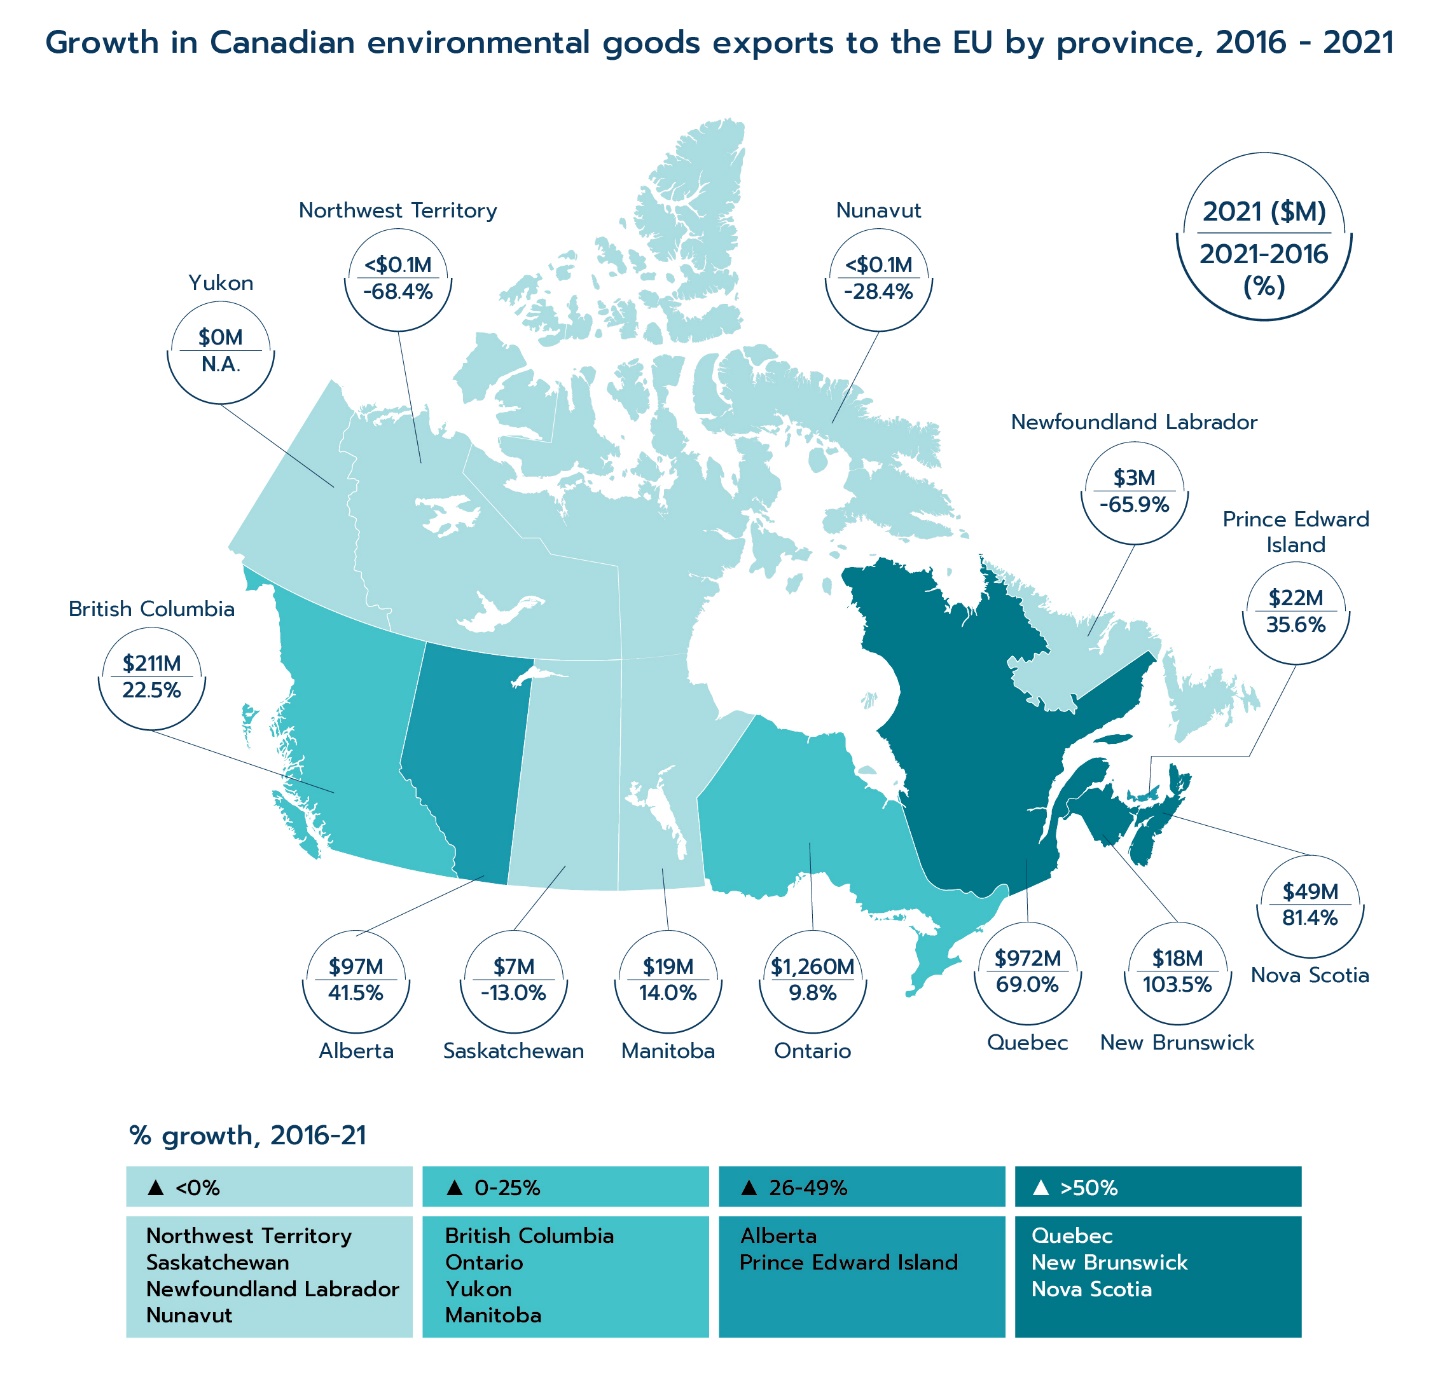
By provinceFootnote 18 , Ontario and Quebec were the two largest suppliers of environmental goods to the EU, accounting for 84% of Canadian exports. Exports from Ontario to the EU rose nearly 10% from 2016 to 2021 to $1.3 billion. This represented nearly 14% of the province’s total merchandise exports to the EU in 2021. Quebec posted the largest increase in environmental goods exports to the EU since 2016, growing by 69%, or $397 million, to reach $972 million in 2021. British Columbia, Alberta and Nova Scotia also recorded strong growth in their environmental goods exports to the EU over this period.
Text version
| Province | 2021 ($M) | 21/16 (%) |
|---|---|---|
| Ontario | 1,260 | 9.8 |
| Quebec | 972 | 69.0 |
| British Columbia | 211 | 22.5 |
| Alberta | 97 | 41.5 |
| Nova Scotia | 49 | 81.4 |
| Prince Edward Island | 22 | 35.6 |
| Manitoba | 19 | 14.0 |
| New Brunswick | 18 | 103.5 |
| Saskatchewan | 7 | -13.0 |
| Newfoundland Labrador | 3 | -65.9 |
| Nunavut | <0.1M | -28.4 |
| Northwest Territory | <0.1M | -68.4 |
Data: Statistics Canada
Utilization of CETA preferences
The CETA preference utilization rate (PUR) measures the extent to which products that are eligible for CETA preferential tariff rates actually claim those preferences when they enter the partner country.Footnote 19 Most tariff lines immediately became duty-free when CETA entered into force, with the remaining tariffs being phased out in stages after that. Each shipment entering the EU from Canada, and vice-versa, is accompanied by import declaration that includes information on the amount of imports that are claiming the CETA preferential tariff treatment.Footnote 20 The customs utilization data collected by the customs agency through import declarations provide an estimate of the extent to which importers and exporters are making use of the tariff reductions under CETA.
Utilization of CETA preferences for Canadian exports to the EU
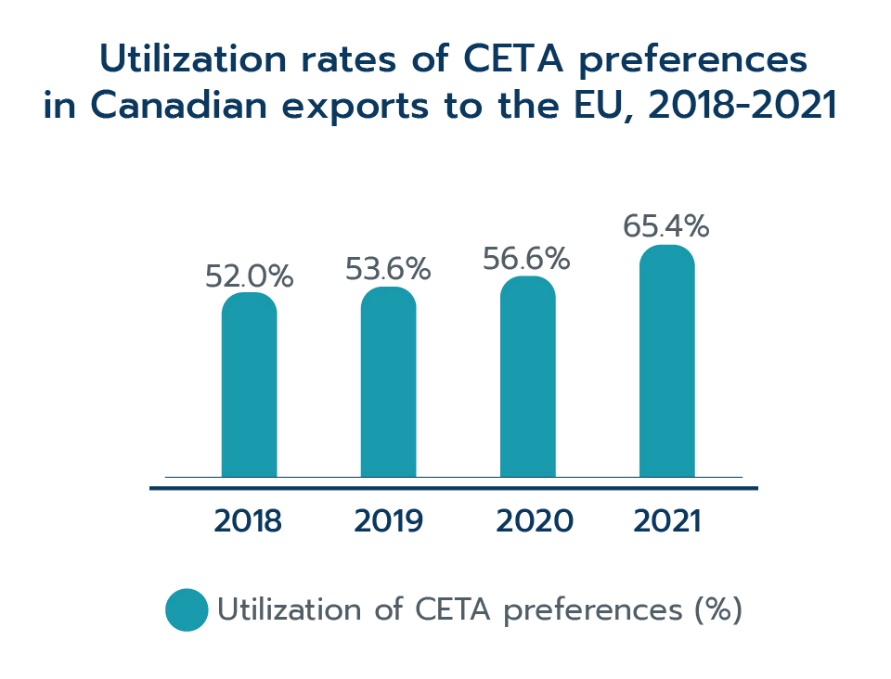
Of the total Canadian exports to the EU in 2021, $6.0 billion (18.7%) were CETA-eligible. Among the CETA-eligible exports, approximately $3.9 billion (65.4% of total CETA-eligible exports) entered the EU by claiming the CETA preferential treatment in 2021. This is a significant jump compared to the utilization rate of 56.6% in 2020, and a steady rise from the utilization rate of 52.0% in 2018 when full-year CETA customs utilization data are first available.
Text version
| Year | Utilization of CETA preferences (%) |
|---|---|
| 2018 | 52.0 |
| 2019 | 53.6 |
| 2020 | 56.6 |
| 2021 | 65.4 |
Data: Office of Chief Economist, DG Trade of the EU Commission
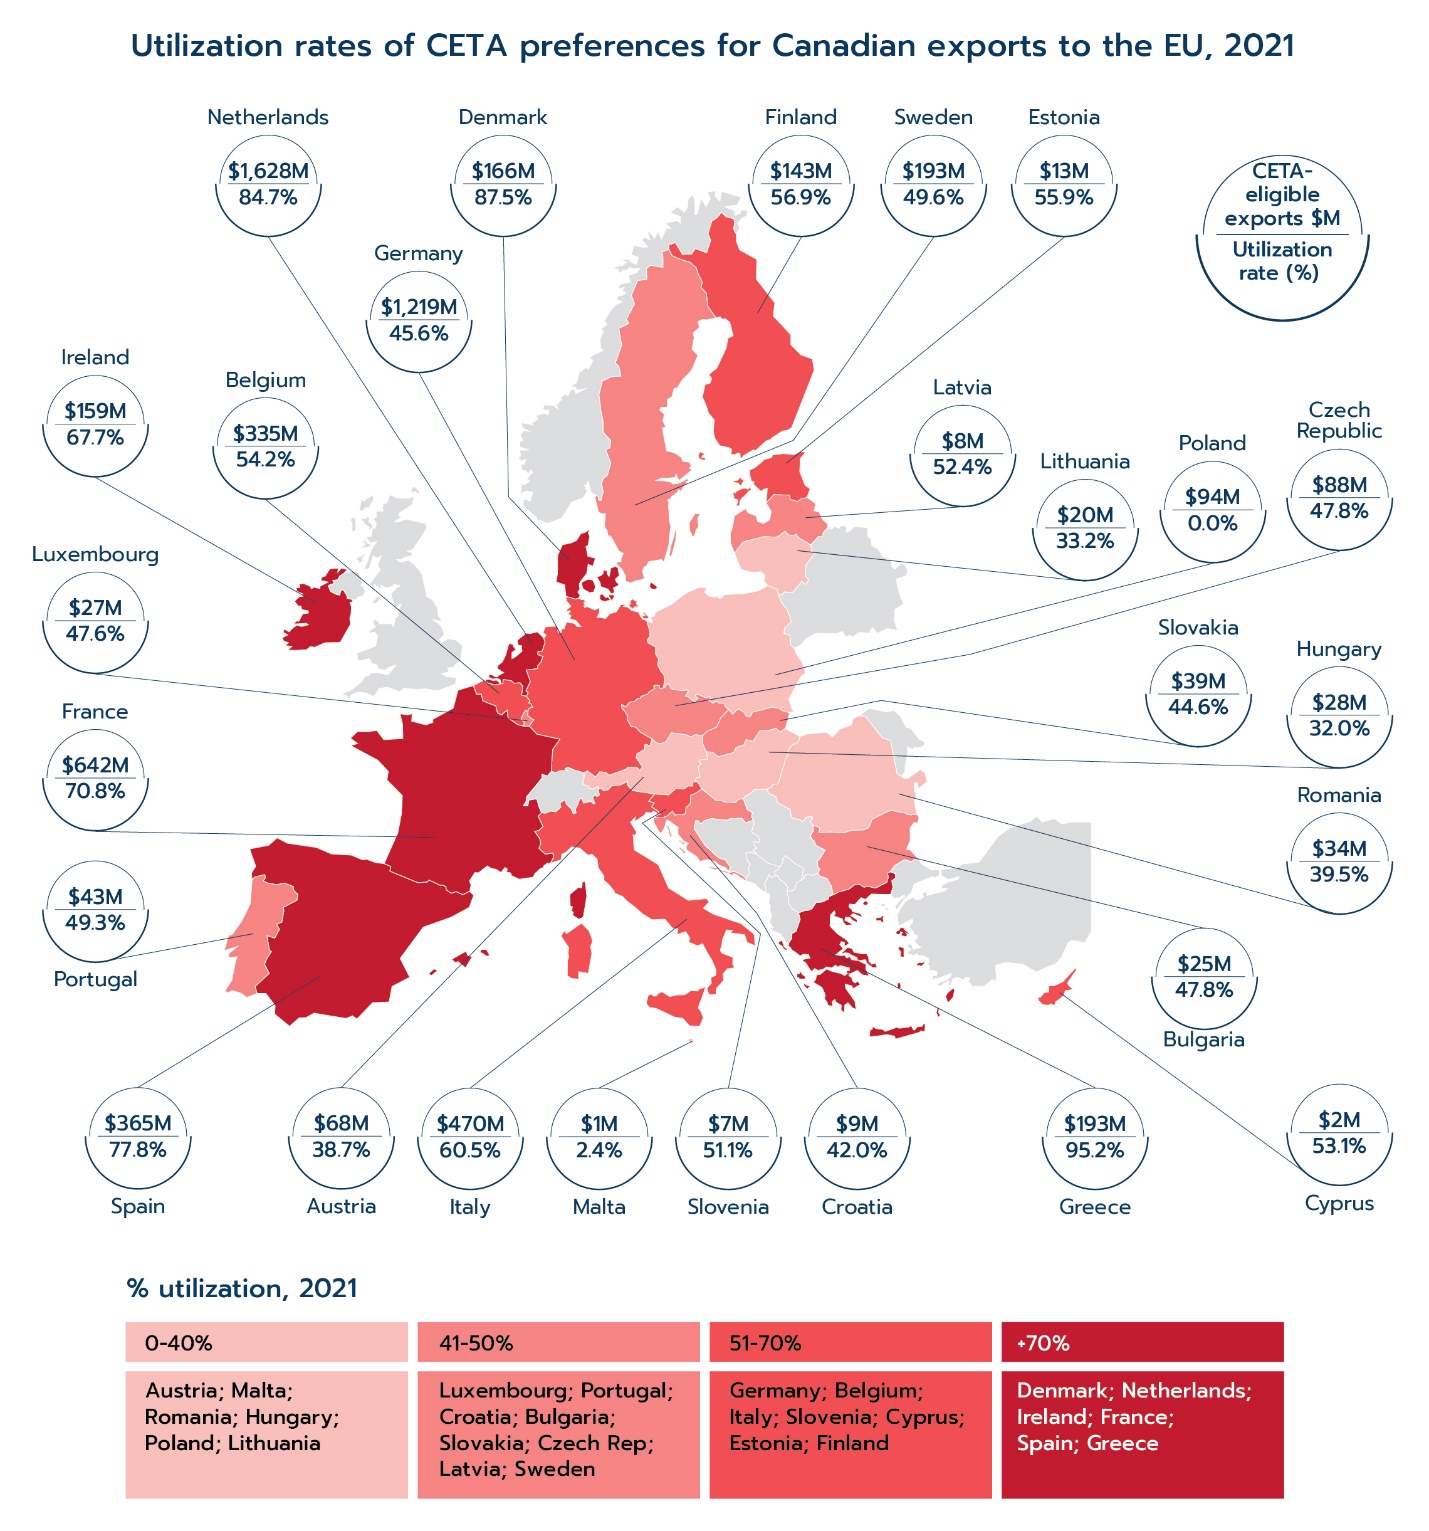
Utilization of CETA preferences for Canadian exports to the EU varies considerably across member states. In 2021, Greece, Denmark and the Netherlands had the highest rates of CETA preference utilization, with utilization rates of 95.2%, 87.5% and 84.7%, respectively. At the opposite end are Poland and Malta with utilization rates of 0.0%, and 2.4%, respectively.
Text version
| Country | CETA-eligible exports $M | Utilization rate (%) |
|---|---|---|
| Austria | 68 | 38.7 |
| Belgium | 335 | 54.2 |
| Bulgaria | 25 | 47.8 |
| Croatia | 9 | 42.0 |
| Cyprus | 2 | 53.1 |
| Czech Republic | 88 | 47.8 |
| Denmark | 166 | 87.5 |
| Estonia | 13 | 55.9 |
| Finland | 143 | 56.9 |
| France | 642 | 70.8 |
| Germany | 1,219 | 45.6 |
| Greece | 193 | 95.2 |
| Hungary | 28 | 32.0 |
| Ireland | 159 | 67.7 |
| Italy | 470 | 60.5 |
| Latvia | 8 | 52.4 |
| Lithuania | 20 | 33.2 |
| Luxembourg | 27 | 47.6 |
| Malta | 1 | 2.4 |
| Netherlands | 1,628 | 84.7 |
| Poland | 94 | 0.0 |
| Portugal | 43 | 49.3 |
| Romania | 34 | 39.5 |
| Slovakia | 39 | 44.6 |
| Slovenia | 7 | 51.1 |
| Spain | 365 | 77.8 |
| Sweden | 193 | 49.6 |
Data: Office of Chief Economist, DG Trade of the EU Commission
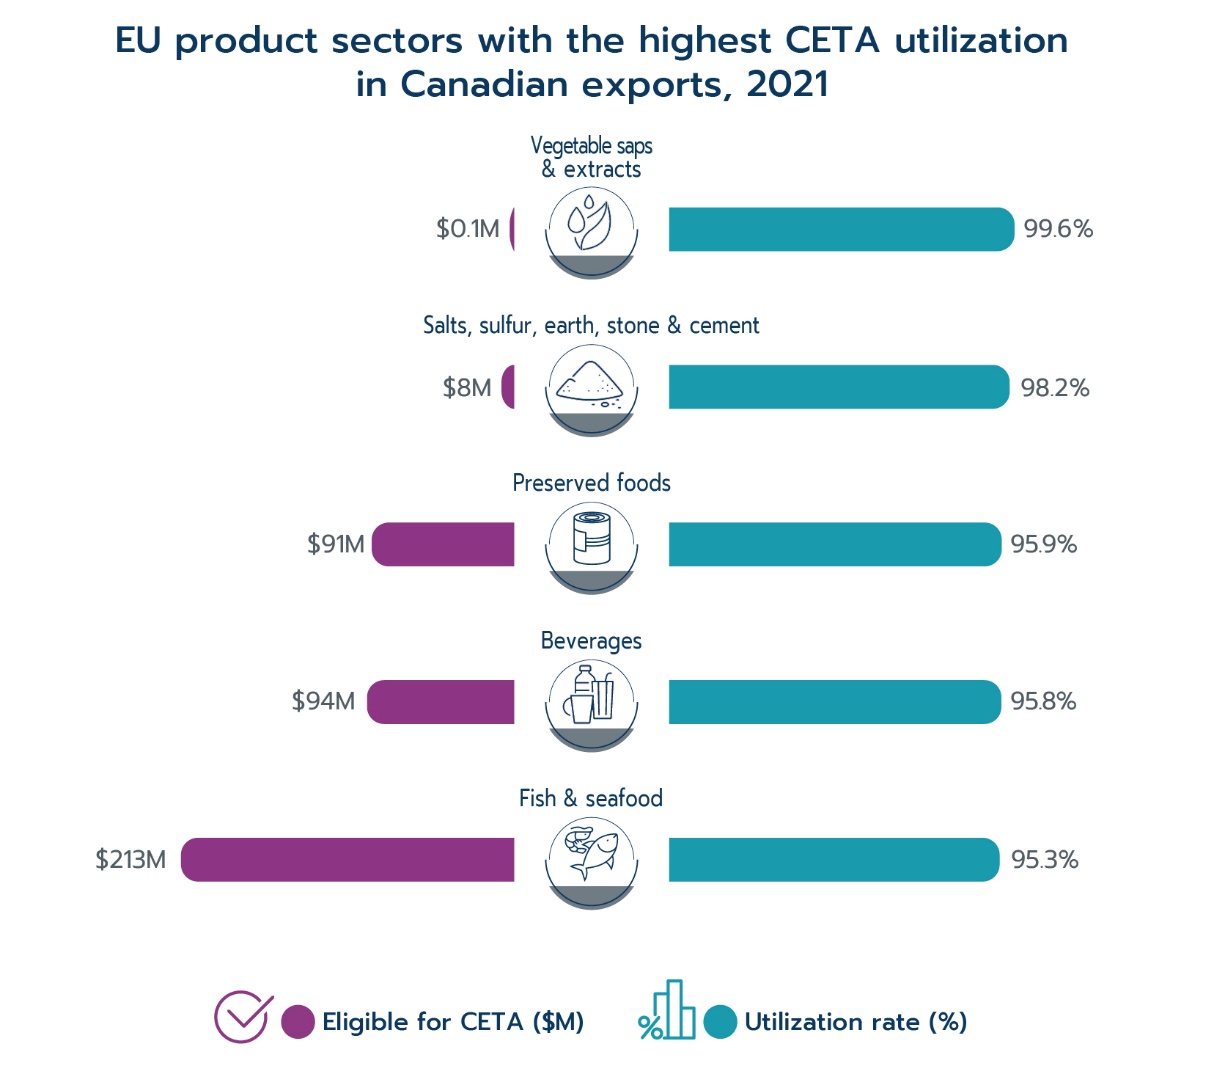
At the sector level, the utilization rate of CETA preferences for Canadian exports also varies significantly, from a high of 99.6% to a low of 0.0%. The figure below shows the sectors with the highest utilization of CETA preferences for Canadian exports to the EU. As can be seen, the Gum and resins sector has the highest utilization rate at 99.6%. Other sectors with high utilization rates include Sulphur and cement, Preparations of vegetables and fruits, Beverages, and Fish and crustaceans.
Text version
| Sector | Eligible for CETA, $M | Utilization rate, % |
|---|---|---|
| Vegetable saps & extracts | 0.1 | 99.6 |
| Salts, sulfur, earth, stone & cement | 8 | 98.2 |
| Preserved foods | 91 | 95.9 |
| Beverages | 94 | 95.8 |
| Fish & seafood | 213 | 95.3 |
Data: Office of Chief Economist, DG Trade of the EU Commission
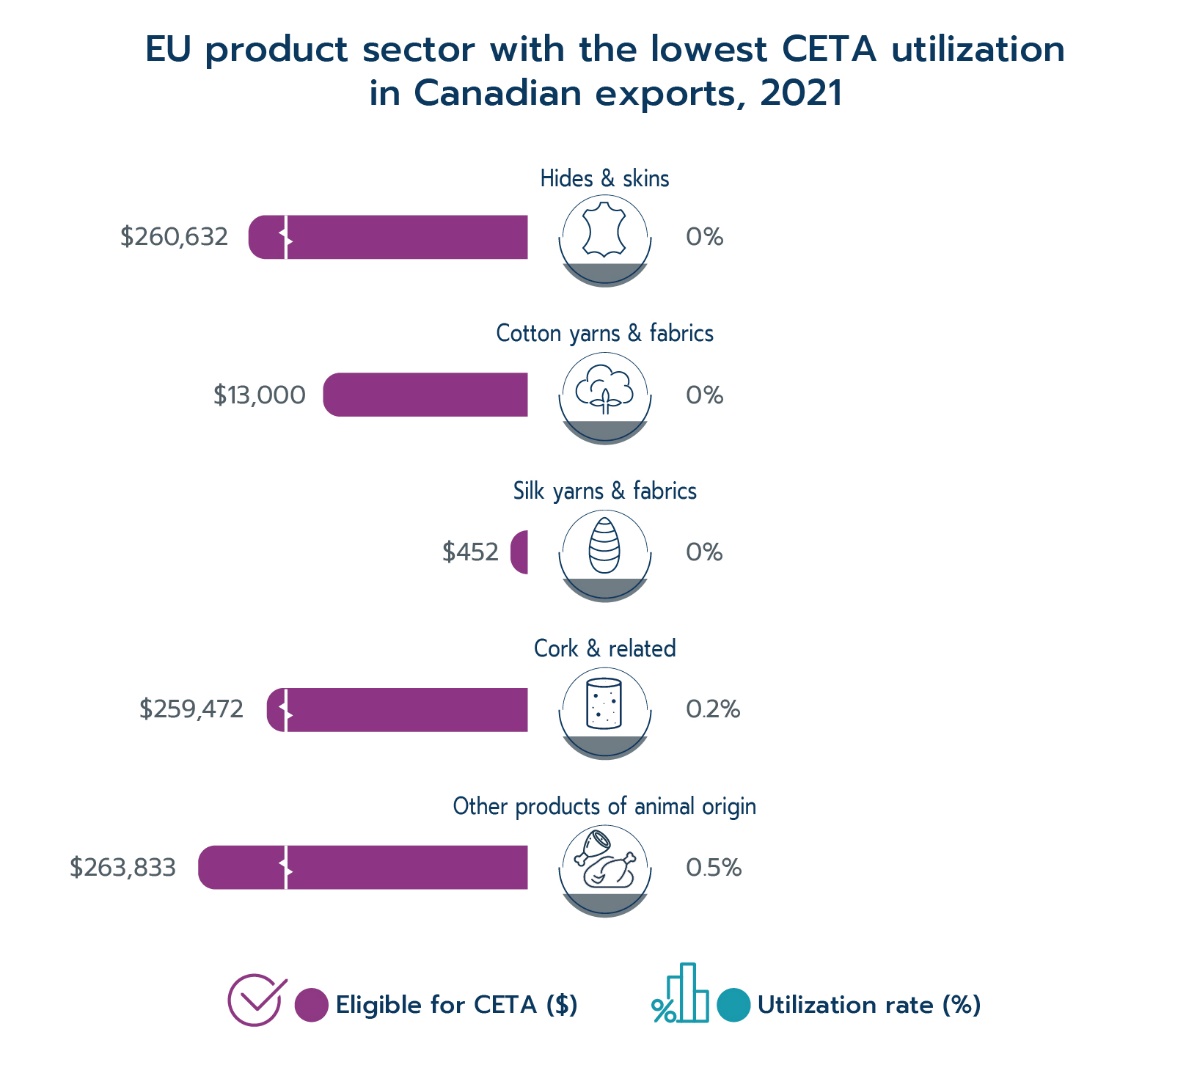
The EU product sectors that have the lowest utilization rates of CETA preferences for Canadian exports are shown below. There are three sectors with utilization rates of 0.0%: Raw hides and leather, Silk, and Products of animal origin. It is notable that the dollar values for all product groups with exceptionally low utilization rates are rather small at less than $300,000 eligible for CETA, and in a few cases are negligible.
Text version
| Sector | Eligible for CETA, $ | Utilization rate, % |
|---|---|---|
| Hides & skins | 260,632 | 0 |
| Silk yarns & fabrics | 13,000 | 0 |
| Other products of animal origin | 452 | 0 |
| Cork & related | 259,472 | 0.2 |
| Cotton yarns & fabrics | 263,833 | 0.5 |
Data: Office of Chief Economist, DG Trade of the EU Commission
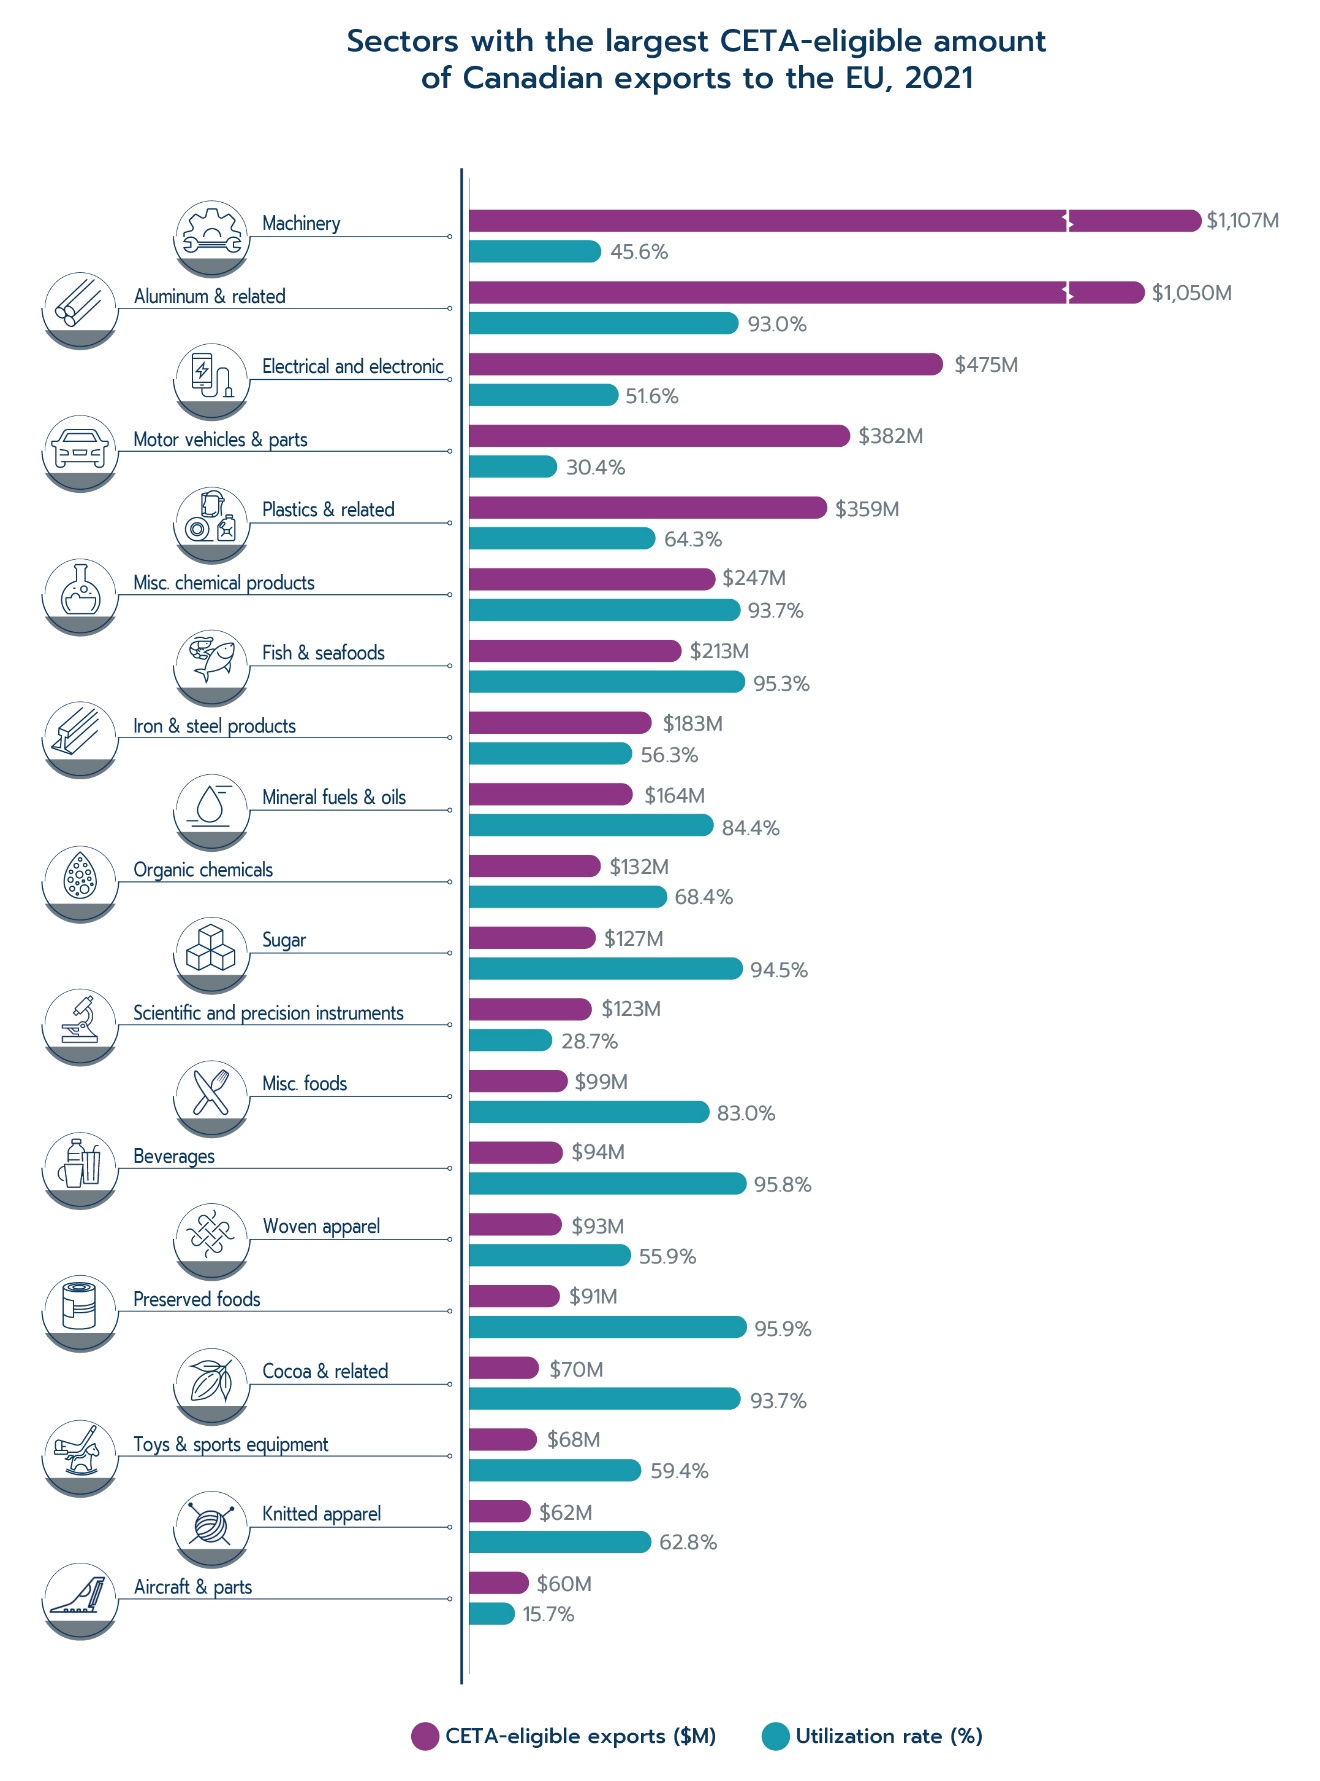
While the low CETA utilization of Canadian exports for some product sectors can be explained by the low CETA-eligible amount, this is not broadly the case. The product sectors with the largest CETA-eligible amounts for Canadian exports to the EU are shown below. The eligible exports from these sectors made up 86.4% of all CETA-eligible exports originating from Canada but some of these sectors that had high values of CETA-eligible trade had rather low utilization rates. For example, the utilization rates for sectors such as Machinery, and Motor vehicles and parts were only 45.6% and 30.4% respectively.
Text version
| Sector | CETA-eligible exports, $M | Utilization Rate (%) |
|---|---|---|
| Machinery | 1,107 | 45.6 |
| Aluminum & related | 1,050 | 93 |
| Electrical and electronic machinery & equipment | 475 | 51.6 |
| Motor vehicles & parts | 382 | 30.4 |
| Plastics & related | 359 | 64.3 |
| Misc. chemical products | 247 | 93.7 |
| Fish & seafood | 213 | 95.3 |
| Iron & steel products | 183 | 56.3 |
| Mineral fuels & oils | 164 | 84.4 |
| Organic chemicals | 132 | 68.4 |
| Sugar | 127 | 94.5 |
| Scientific and precision instruments | 123 | 28.7 |
| Misc. foods | 99 | 83 |
| Beverages | 94 | 95.8 |
| Woven apparel | 93 | 55.9 |
| Preserved foods | 91 | 95.9 |
| Cocoa & related | 70 | 93.7 |
| Toys & sports equipment | 68 | 59.4 |
| Knitted apparel | 62 | 62.8 |
| Aircraft & parts | 60 | 15.7 |
Data: Office of Chief Economist, DG Trade of the EU Commission
The top five product sectors in terms of amount of CETA-eligible exports had an average CETA utilization rate of 57.0% in 2021, even though their total CETA-eligible exports were close to $3.4 billion. The total savings on tariffs if these product sectors had fully utilized CETA preferential rates could have been substantial even if the preference margin is only minimal.
The following focusses on three sectors that have large CETA-eligible Canadian exports but low CETA utilization: Machinery, Electrical machinery, and Motor vehicles and parts.
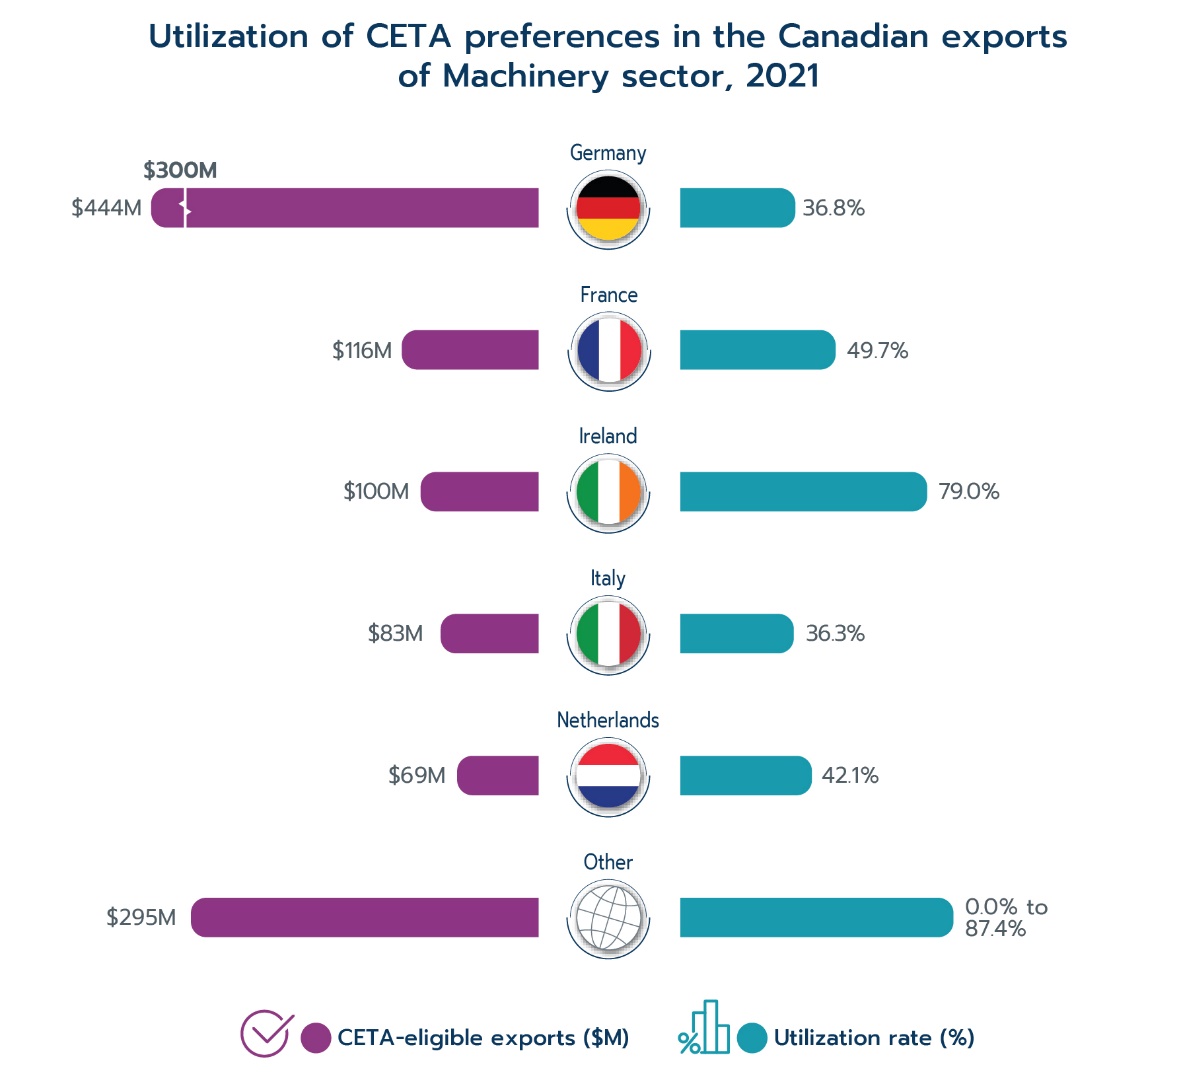
In the Machinery sector, the largest recipient of CETA-eligible exports from Canada was Germany which took in approximately 40.1% of the total, yet the utilization rate for CETA was only 36.8%. France also received 10.5% of the total CETA-eligible exports from Canada in this sector but the utilization rate was barely 50%. The average preference margin for CETA-eligible exports to the EU in this sector is approximately 2.3%.Footnote 21 If exports to these two member states fully utilized CETA, that is if all $559.8 million of CETA-eligible exports to these two member states utilized the tariff savings of 2.3%, an additional $7.8 million in savings could be realizedFootnote 22 .
Text version
| Country | CETA-eligible exports, $M | Utilization rate (%) |
|---|---|---|
| Germany | 444 | 36.8 |
| France | 116 | 49.7 |
| Ireland | 100 | 79 |
| Italy | 83 | 36.3 |
| Netherlands | 69 | 42.1 |
| Other | 295 | 0.0-87.4 |
Data: Office of Chief Economist, DG Trade of the EU Commission
In the Electrical machinery sector, Germany, France, the Netherlands and Italy accounted for 27.2%, 26.0%, 10.1% and 9.9% of total CETA-eligible exports from Canada, respectively. However, the utilization rates for Germany, the Netherlands and Italy are only 50.4%, 38.2% and 26.4%. Considering the average preference margin on Canadian exports to the EU for this sector is approximately 2.2%,Footnote 23 if Germany, the Netherlands and Italy fully utilized CETA preferences; that is, if all $223.7 million of CETA-eligible exports to these three member states utilized the tariff savings of 2.2%, total tariff savings could have been $2.8 million larger.Footnote 24

Text version
| Country | CETA-eligible exports, $M | Utilization rate (%) |
|---|---|---|
| Germany | 129 | 50.4 |
| France | 123 | 84.2 |
| Netherlands | 48 | 38.2 |
| Italy | 47 | 26.4 |
| Belgium | 23 | 59.5 |
| Other | 105 | 0.0-62.0 |
Data: Office of Chief Economist, DG Trade of the EU Commission
In the Motor vehicles and parts sector, Germany, Finland, the Netherlands and Belgium took in 26.3%, 17.0%, 10.3% and 10.3% of total CETA-eligible Canadian exports, respectively. However, their utilizations of CETA preferences were all on the low side, at only 27.8% for Germany, 49.8% for Finland, 8.0% for the Netherlands, and 12.7% for Belgium. Given that the average preference margin on exports to the EU for this sector is approximately 7.4%,Footnote 25 if these four member states fully utilized CETA preferences on all $244.0 million of CETA-eligible exports, the total tariff savings could have been $13.0 million larger.Footnote 26

Text version
| Country | CETA-eligible exports, $ | Utilization rate (%) |
|---|---|---|
| Germany | 100 | 27.8 |
| Finland | 65 | 49.8 |
| Netherlands | 39 | 8 |
| Belgium | 39 | 12.7 |
| Sweden | 23 | 51.4 |
| Other | 115 | 0.0-79.3 |
Data: Office of Chief Economist, DG Trade of the EU Commission
Utilization of CETA preferences for Canadian imports from the EU
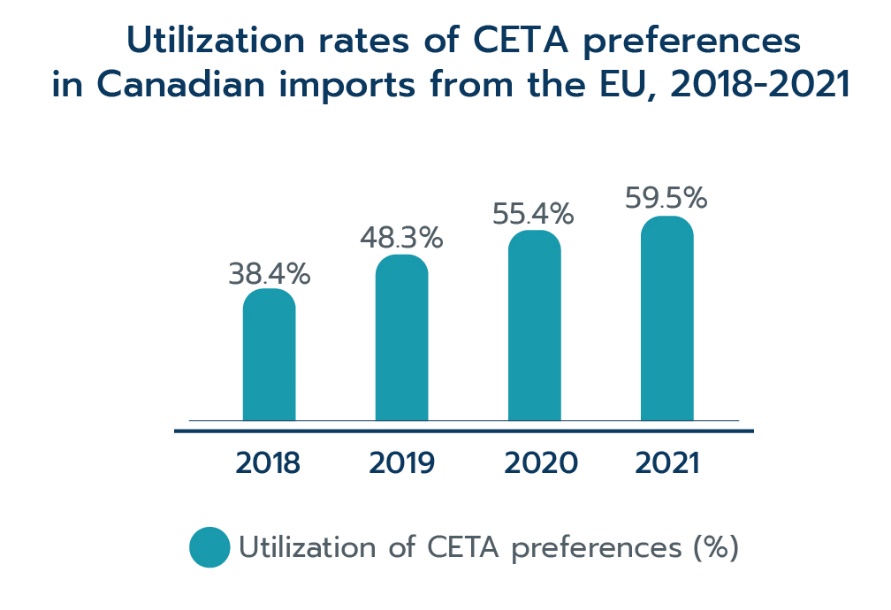
The Canadian utilization data include information on what proportion of affected importsFootnote 27 entering Canada claimed CETA preferential treatment and what proportion used MFN rates. As of 2021, $16.5 billion (24.7%) of Canadian imports were potentially eligible for lower tariffs under CETA. Among these affected imports, approximately $9.8 billion (or 59.5% of total affected imports) claimed CETA preferential treatmentFootnote 28 . The utilization rate of CETA preferences for Canadian imports in 2021 was therefore 59.5%; a small increase of 4.1 percentage points compared to the utilization rate of 55.4% in 2020 but a substantial jump from only 38.4% in 2018, the first year for which full-year CETA customs utilization data are available.
Text version
| Year | Utilization of CETA preferences (%) |
|---|---|
| 2018 | 38.4 |
| 2019 | 48.3 |
| 2020 | 55.4 |
| 2021 | 59.5 |
Data: Statistics Canada
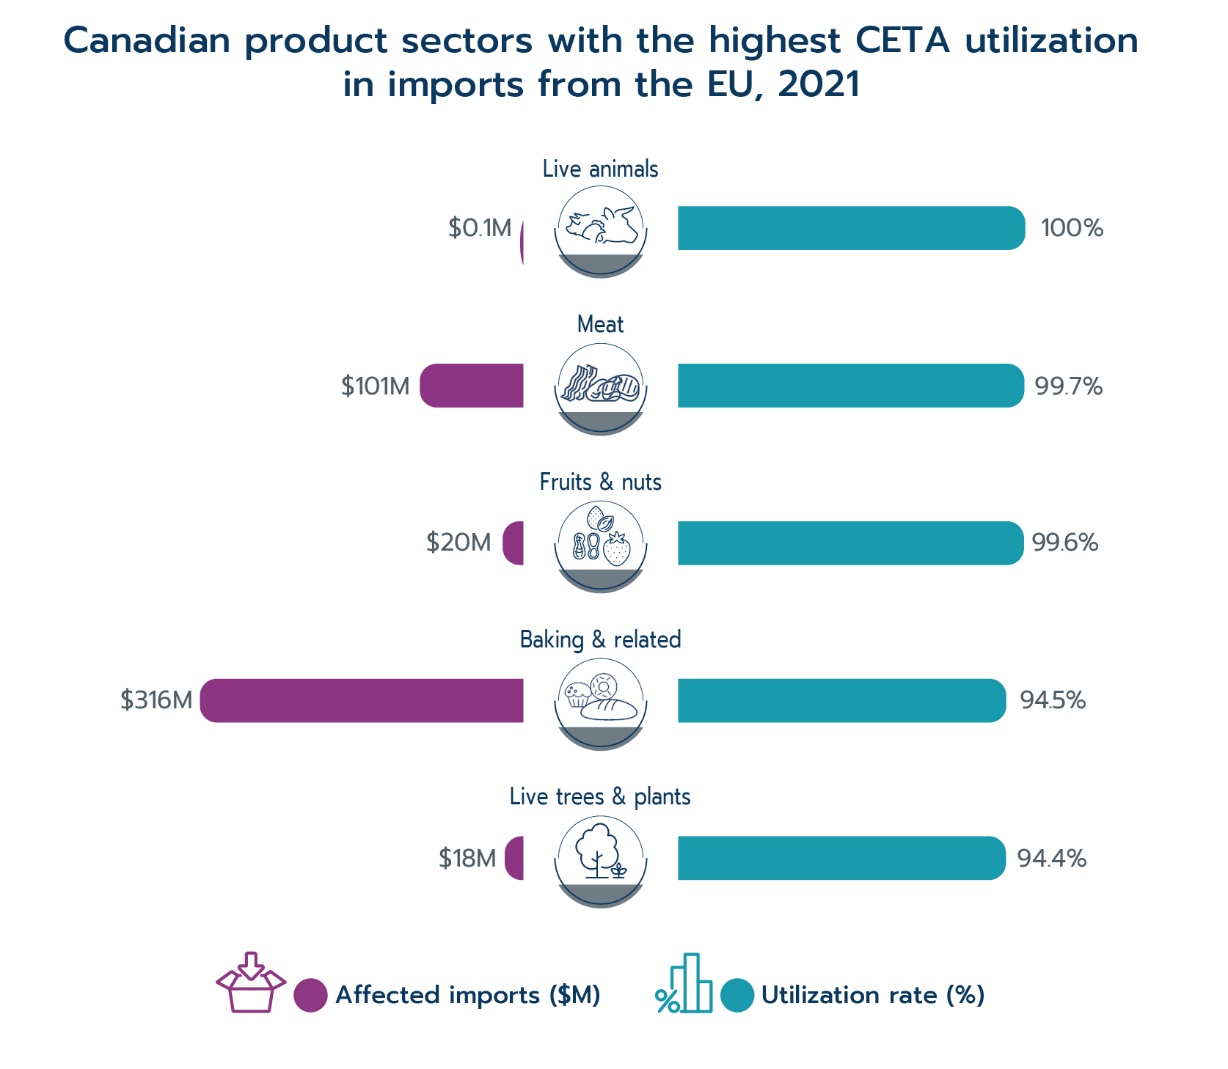
Canadian import sectors that have the highest utilization rates of CETA preferences are shown below. As can be seen, the Live animals sector has the highest utilization rate at 100%. The other sectors with high utilization rates are also in the agricultural sector.Footnote 29
Text version
| Sector | Affected imports, $M | Utilization rate |
|---|---|---|
| Live animals | 0.1 | 100 |
| Meat | 101 | 99.7 |
| Fruits & nuts | 20 | 99.6 |
| Baking & related | 316 | 94.5 |
| Live trees & plants | 18 | 94.4 |
Data: Statistics Canada
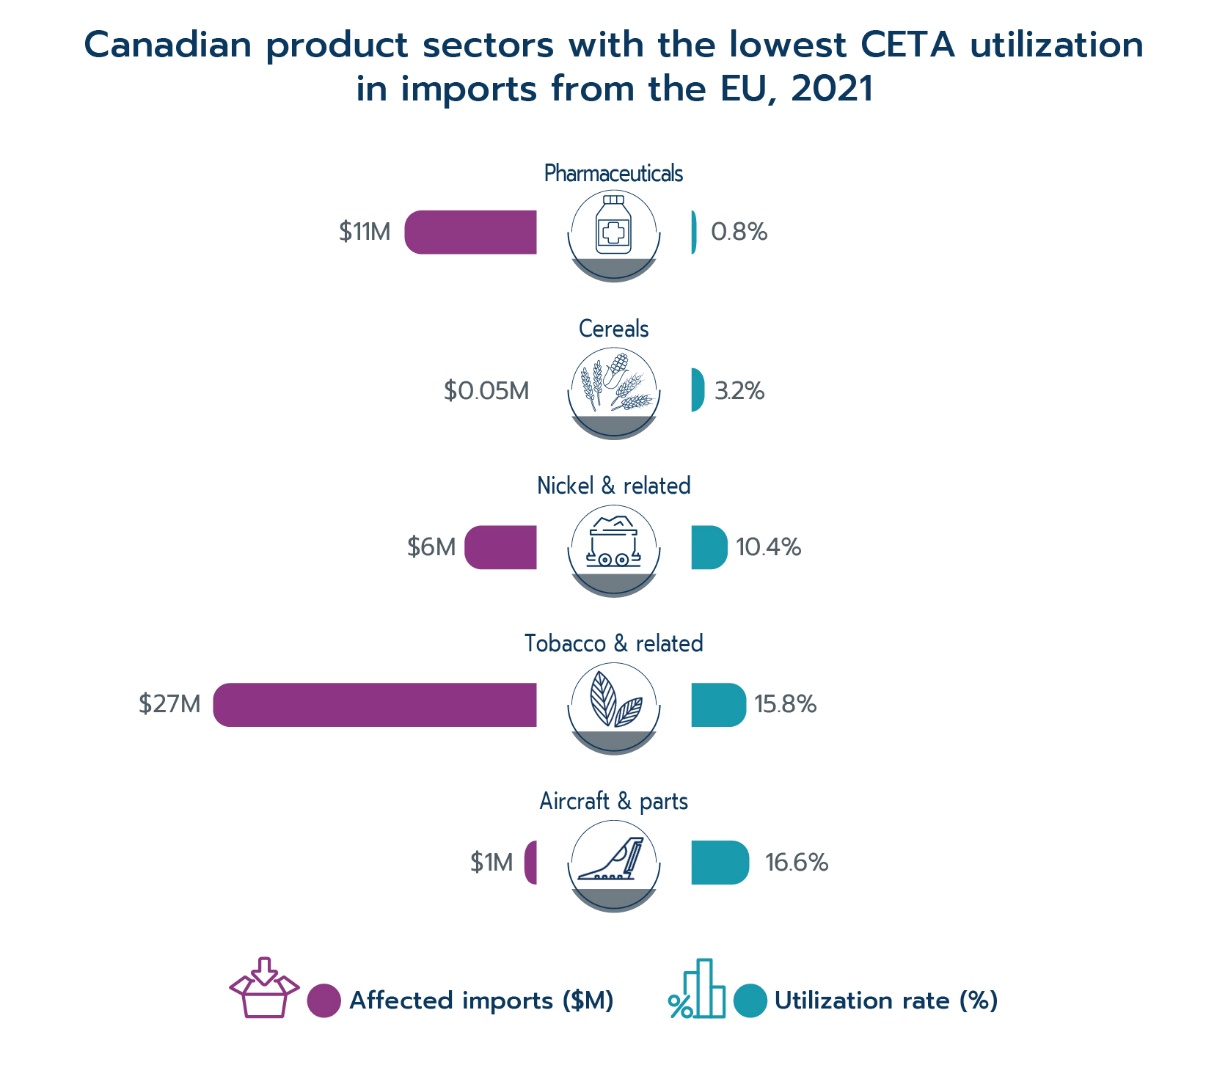
The figure below shows the Canadian import sectors that have the lowest utilization rates. They include Pharmaceutical products and Nickel. The actual reason why their utilization rate is low may not be apparent. One speculative explanation is that the amount of tariff savings may appear minor compared to the time and cost of claim processing since the affected imports for both product sectors only makes up minute proportions of total imports (0.1% for Pharmaceutical products and 4.6% for Nickel).
Text version
| Sector | Affected imports, $M | Utilization rate (%) |
|---|---|---|
| Pharmaceuticals | 11 | 0.8 |
| Cereals | 0.05 | 3.2 |
| Nickel & related | 6 | 10.4 |
| Tobacco & related | 27 | 15.8 |
| Aircraft & parts | 1 | 16.6 |
Data: Statistics Canada
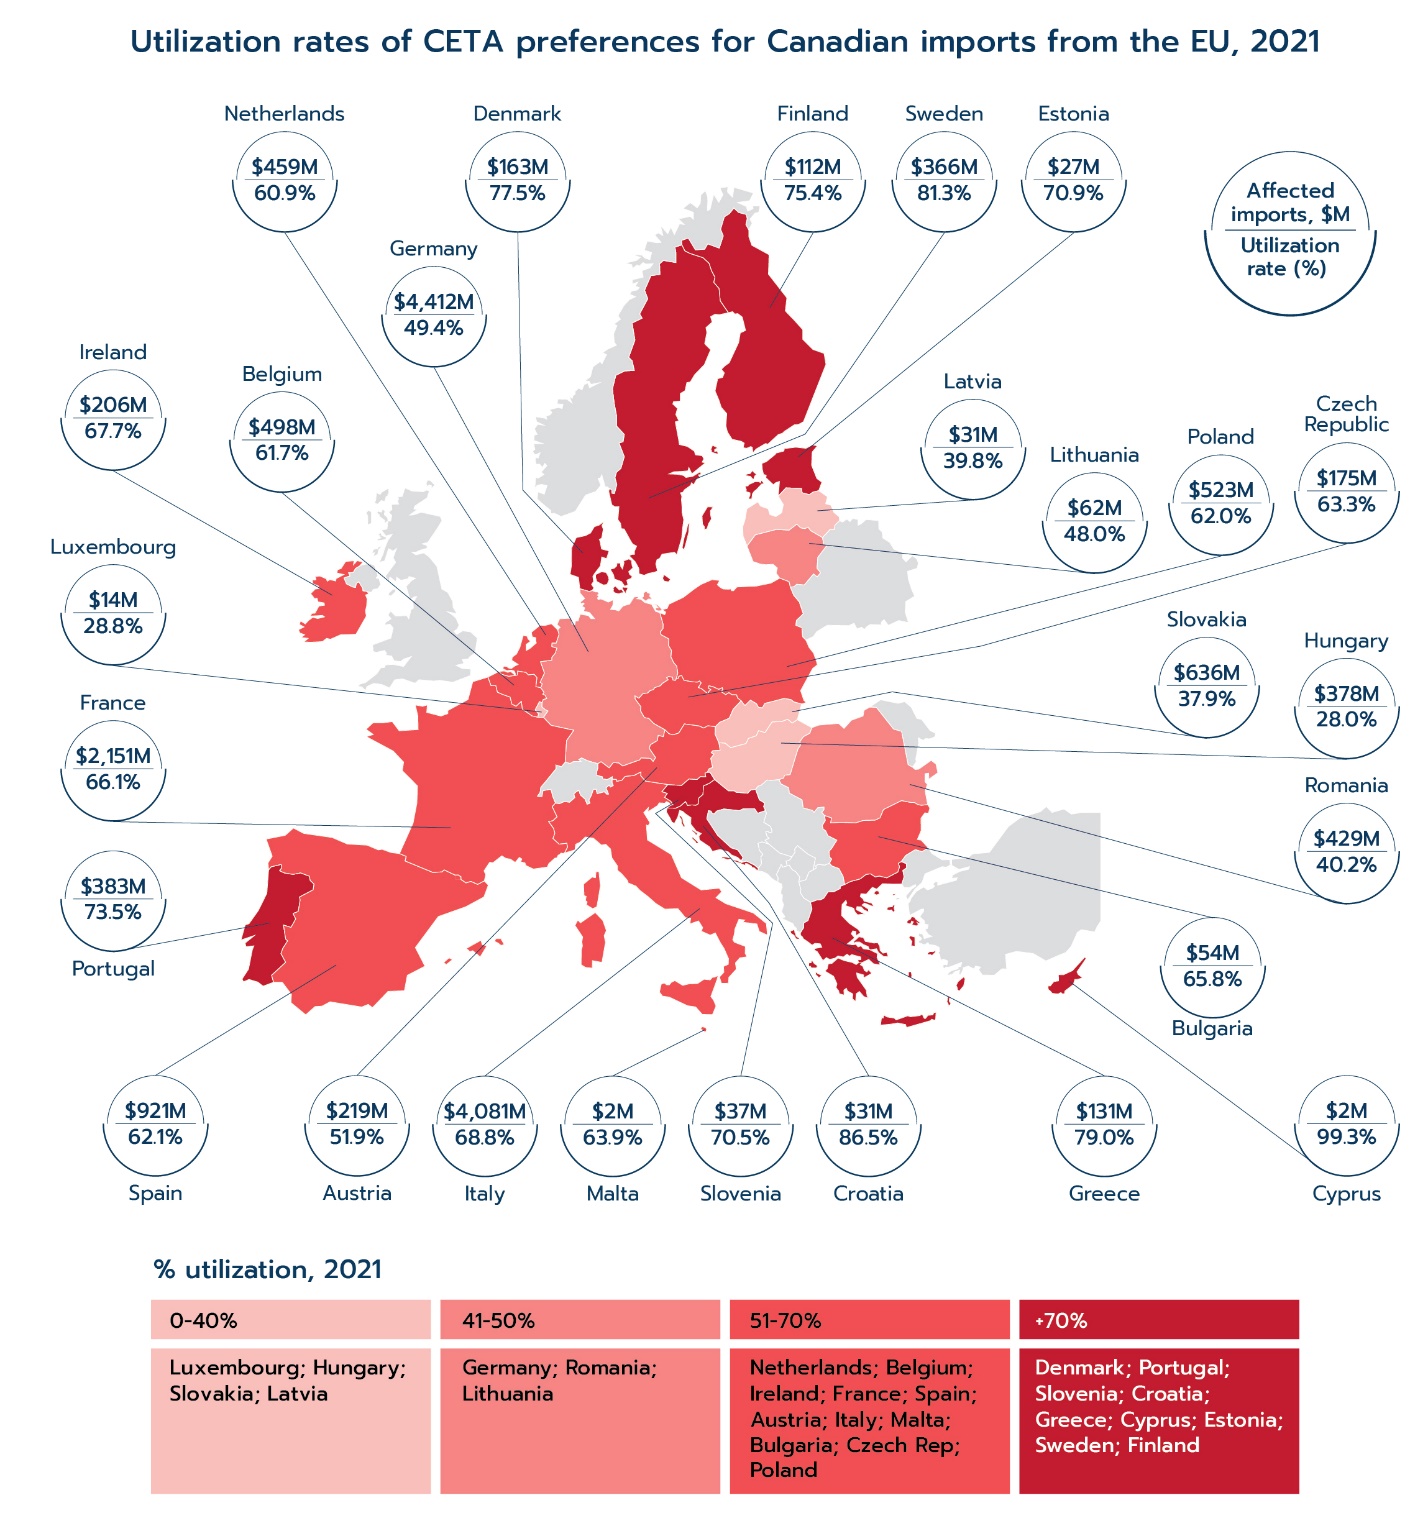
Similar to Canadian exports, the utilization rates of CETA preferences for Canadian imports also vary greatly by the EU member states of origin. The imports from the following member states had the highest utilization of CETA preferences in 2021: Cyprus (99.3%), Croatia (86.5%), Sweden (81.3%), Greece (79.0%) and Denmark (77.5%). On the other hand, imports from Hungary, Luxembourg and Slovakia have the lowest utilization rates of 28.0%, 28.8% and 37.9% respectively.
Text version
| Country | Affected imports, $M | Utilization rate (%) |
|---|---|---|
| Austria | 219 | 51.9 |
| Belgium | 498 | 61.7 |
| Bulgaria | 54 | 65.8 |
| Croatia | 31 | 86.5 |
| Cyprus | 2 | 99.3 |
| Czech Republic | 175 | 63.3 |
| Denmark | 163 | 77.5 |
| Estonia | 27 | 70.9 |
| Finland | 112 | 75.4 |
| France | 2,151 | 66.1 |
| Germany | 4,412 | 49.4 |
| Greece | 131 | 79.0 |
| Hungary | 378 | 28.0 |
| Ireland | 206 | 67.7 |
| Italy | 4,081 | 68.8 |
| Latvia | 31 | 39.8 |
| Lithuania | 62 | 48.0 |
| Luxembourg | 14 | 28.8 |
| Malta | 2 | 63.9 |
| Netherlands | 459 | 60.9 |
| Poland | 523 | 62.0 |
| Portugal | 383 | 73.5 |
| Romania | 429 | 40.2 |
| Slovakia | 636 | 37.9 |
| Slovenia | 37 | 70.5 |
| Spain | 921 | 62.1 |
| Sweden | 366 | 81.3 |
Data: Statistics Canada
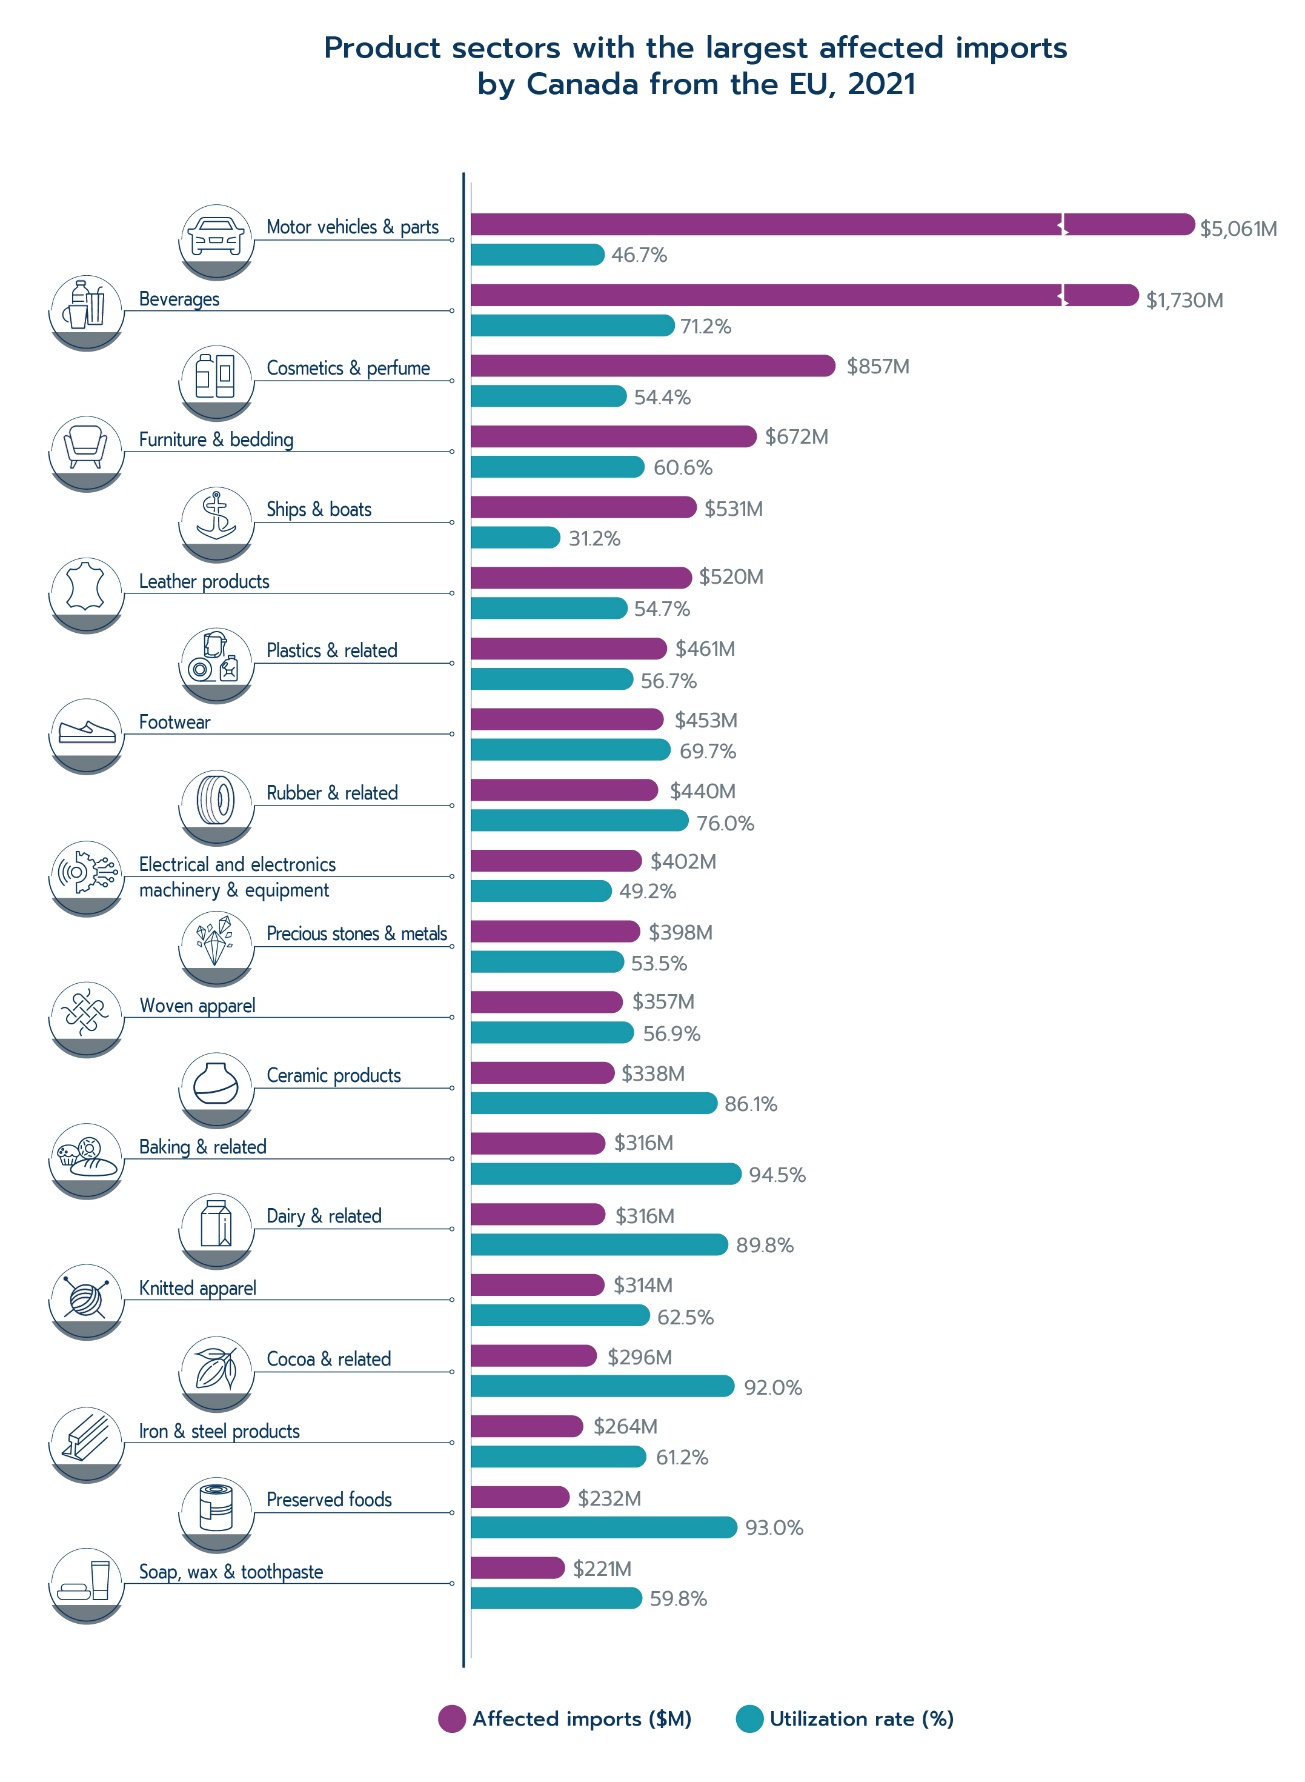
The sectors with the largest affected imports by Canada from the EU are shown below. Affected imports in these sectors made up 85.9% of all affected imports that entered Canada from the EU in 2021. The utilization rates of these sectors range widely, from a low of 31.2% to a high of 94.5%. The Motor vehicles and parts sector represented 30.7% of total affected imports in 2021 and yet has the second lowest CETA utilization rate among sectors with large affected imports.
Text version
| Sector | Affected imports, $M | Utilization Rate (%) |
|---|---|---|
| Motor vehicles & parts | 5,061 | 46.7 |
| Beverages | 1,730 | 71.2 |
| Cosmetics & perfume | 857 | 54.4 |
| Furniture & bedding | 672 | 60.6 |
| Ships & boats | 531 | 31.2 |
| Leather products | 520 | 54.7 |
| Plastics & related | 461 | 56.7 |
| Footwear | 453 | 69.7 |
| Rubber & related | 440 | 76.0 |
| Electrical and electronic machinery & equipment | 402 | 49.2 |
| Precious stones & metals | 398 | 53.5 |
| Woven apparel | 357 | 56.9 |
| Ceramic products | 338 | 86.1 |
| Baking & related | 316 | 94.5 |
| Dairy & related | 316 | 89.8 |
| Knitted apparel | 314 | 62.5 |
| Cocoa & related | 296 | 92.0 |
| Iron & steel products | 264 | 61.2 |
| Preserved foods | 232 | 93.0 |
| Soap, wax & toothpaste | 221 | 59.8 |
Data: Statistics Canada
The following focusses on three sectors that have large affected imports but low CETA utilization: Motor vehicles and parts, Essential oils and cosmetic preparations, and Ships and boats. As before, disaggregating CETA utilization by member state reveals a number of potential gaps.
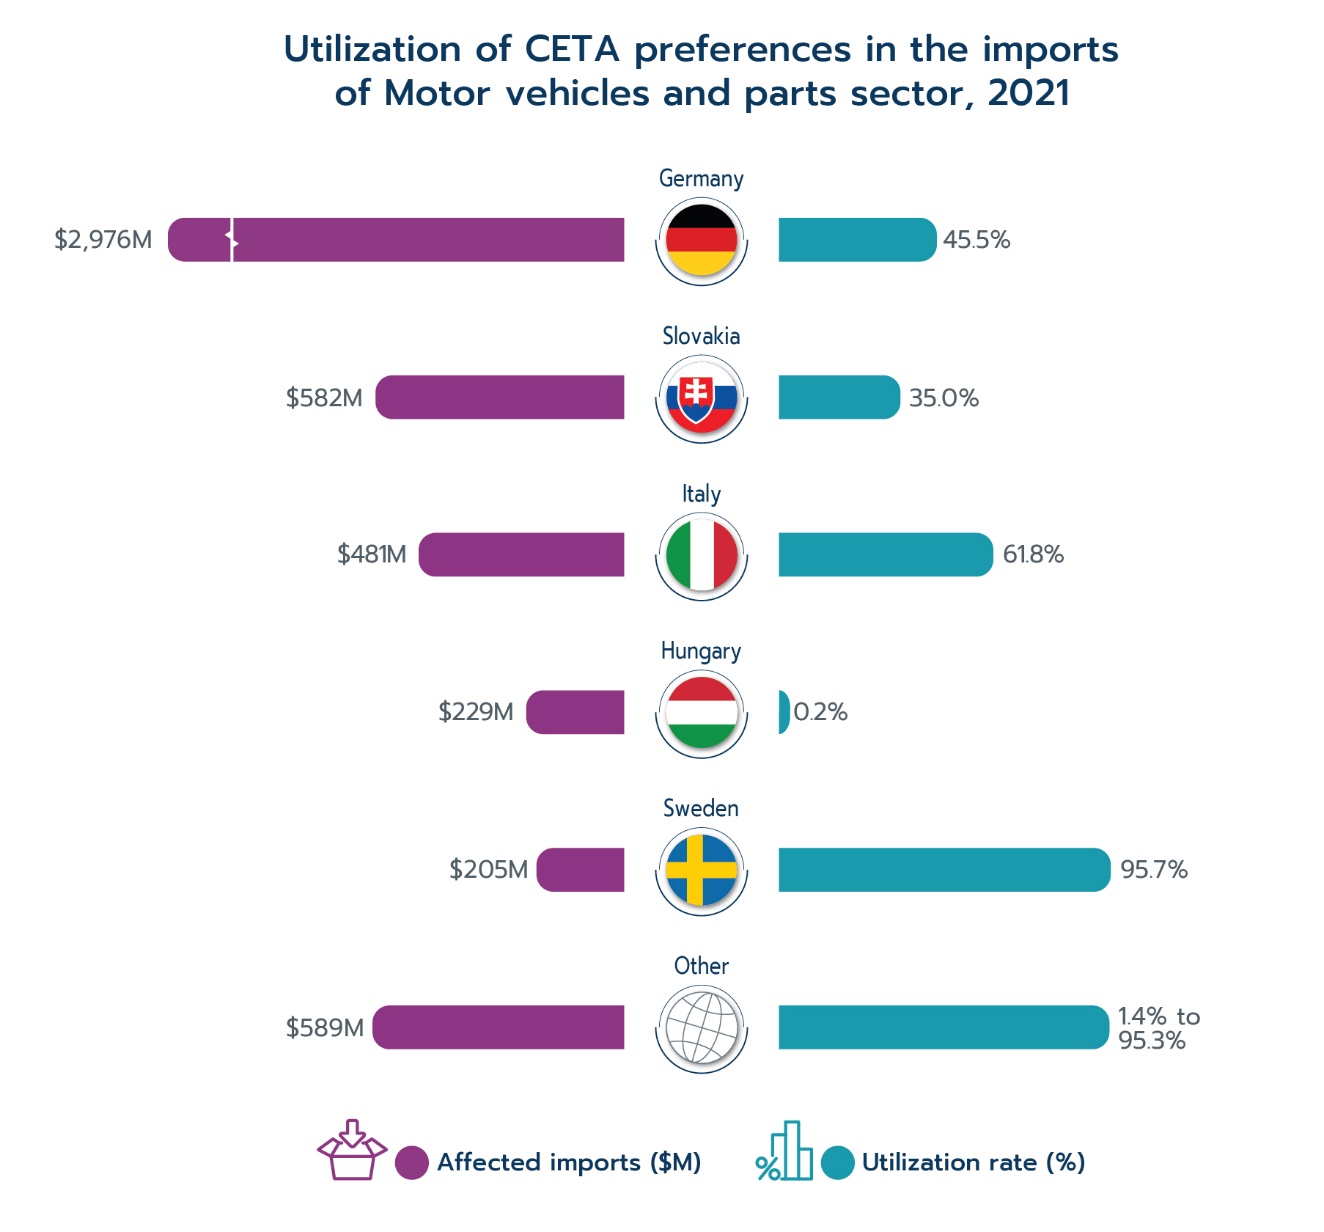
In the Motor vehicles and parts sector, Canada imported from Germany 58.8% and from Slovakia 11.5% of total affected imports. The CETA utilization rates for imports from these two member states are only 45.5% and 35.0%, respectively. Considering that the average preference margin on imports from the EU for this sector is approximately 3.4%,Footnote 30 if imports from these two member states fully utilized CETA preferences on affected imports and that all $3.6 billion affected imports claimed CETA preferential rates, then total tariff savings from these tariff reductions could have been $68.0 million larger.Footnote 31
Text version
| Country | Affected imports, $M | Utilization rate (%) |
|---|---|---|
| Germany | 2,976 | 45.5 |
| Slovakia | 582 | 35 |
| Italy | 481 | 61.8 |
| Hungary | 229 | 0.2 |
| Sweden | 205 | 95.7 |
| Other | 589 | 1.4-95.3 |
Data: Statistics Canada
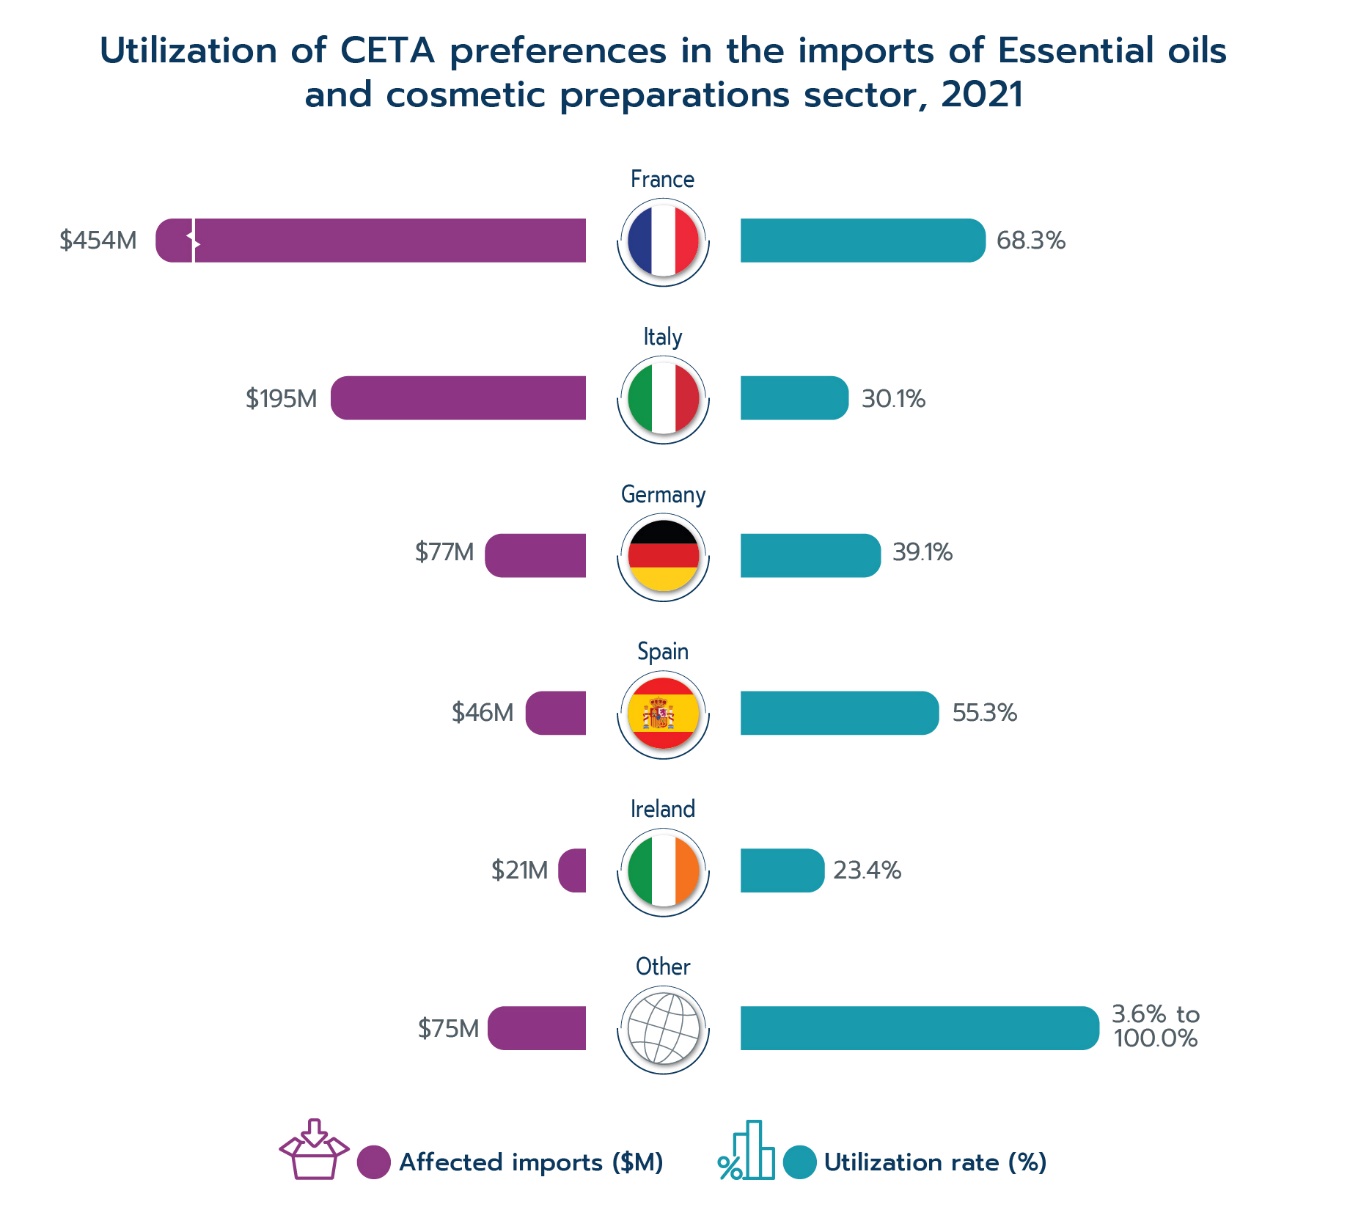
In the Essential oils and cosmetic preparations sector, Canada imported from France 51.8% and from Italy 22.7% of total affected imports. The utilization rates for these imports are 68.3% and 30.1%, respectively. The higher utilization rate for French products may be an indication that it is easier to fulfill the rule of origin requirement for imports from France. Given that the average preference margin on imports from the EU for this sector is approximately 4.3%,Footnote 32 if imports from these two member states fully utilized CETA preferences and that all $639.2 million affected imports from these two member states claimed the CETA preferential rates, then total savings from tariff reductions would have been $11.9 million larger.Footnote 33
Text version
| Country | Affected imports, $M | Utilization rate (%) |
|---|---|---|
| France | 454 | 68.3 |
| Italy | 195 | 30.1 |
| Germany | 77 | 39.1 |
| Spain | 46 | 55.3 |
| Ireland | 21 | 23.4 |
| Other | 75 | 3.6-100.0 |
Data: Statistics Canada
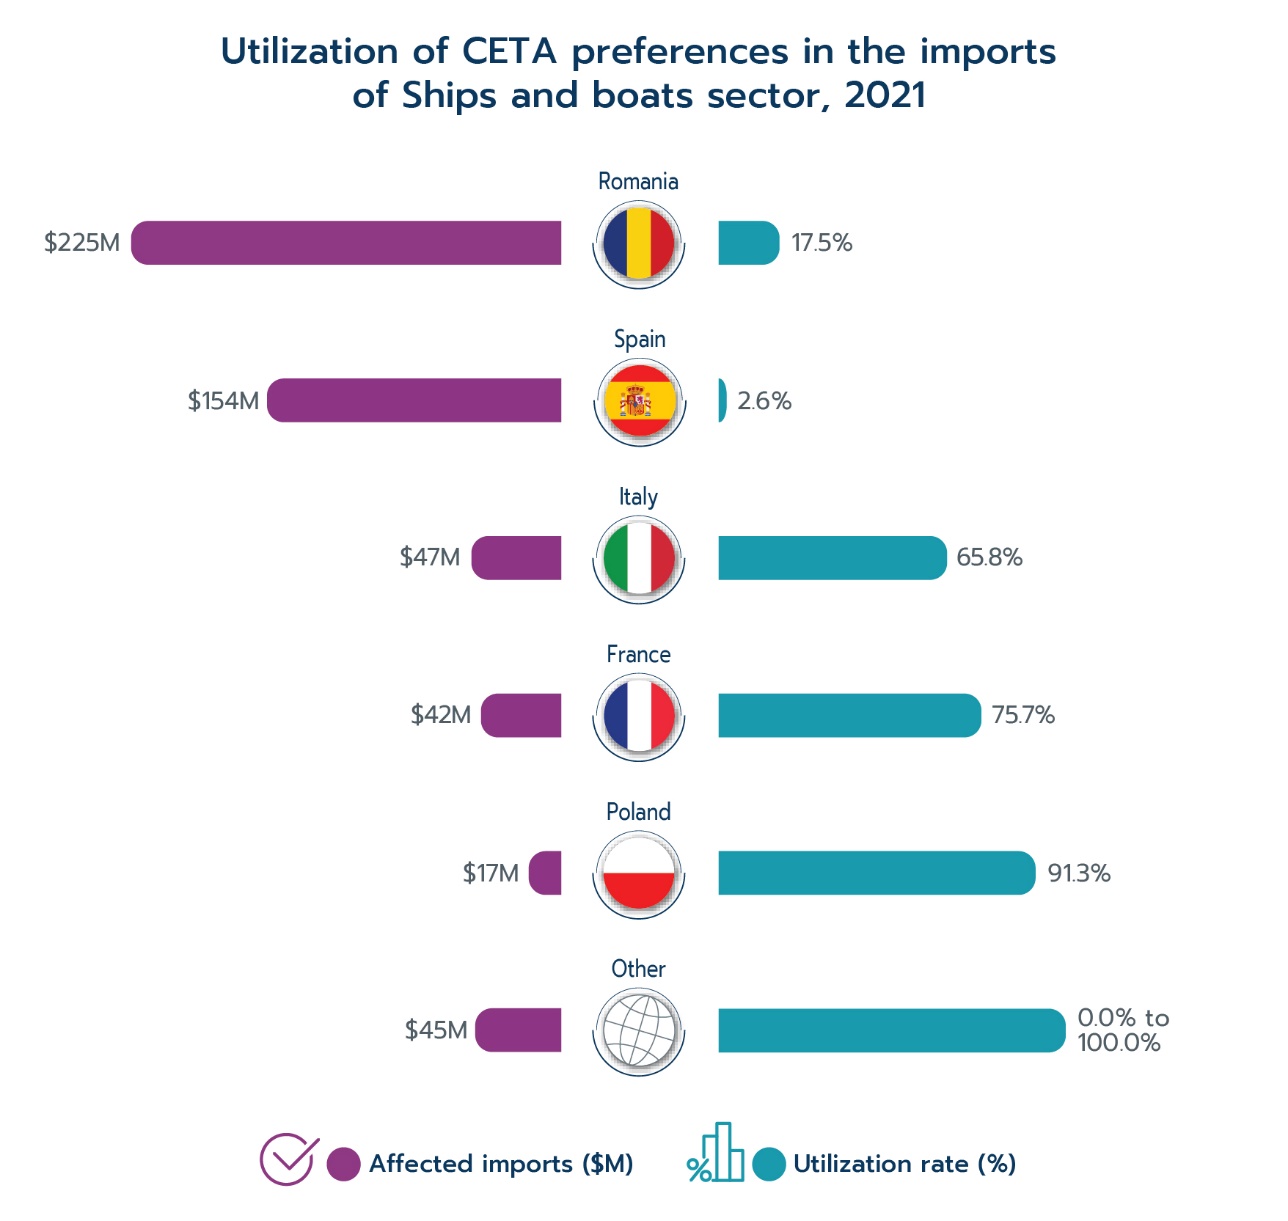
In the Ships and boats sector, Canada imported from Romania 42.5% and from Spain 29.0% of total affected imports, respectively. However, the utilization rates for these imports are only 17.5% and 2.6%. Given that the average preference margin on imports from the EU in this sector is approximately 14.0%,Footnote 34 if imports from these two member states fully utilized CETA preferences, and that all $379.6 million of affected imports claimed CETA preferential rates, then total savings from tariff reductions would have been $47.0 million larger.Footnote 35
Text version
| Country | Affected imports, $M | Utilization rate (%) |
|---|---|---|
| Romania | 225 | 17.5 |
| Spain | 154 | 2.6 |
| Italy | 47 | 65.8 |
| France | 42 | 75.7 |
| Poland | 17 | 91.3 |
| Other | 45 | 0.0-100.0 |
Data: Statistics Canada
In 2021 alone, it is estimated that Canadian and EU companies saved approximately $890.6 million in duties, thanks to CETA. However, the moderate level of CETA utilization also means there are still more savings that could be realized.
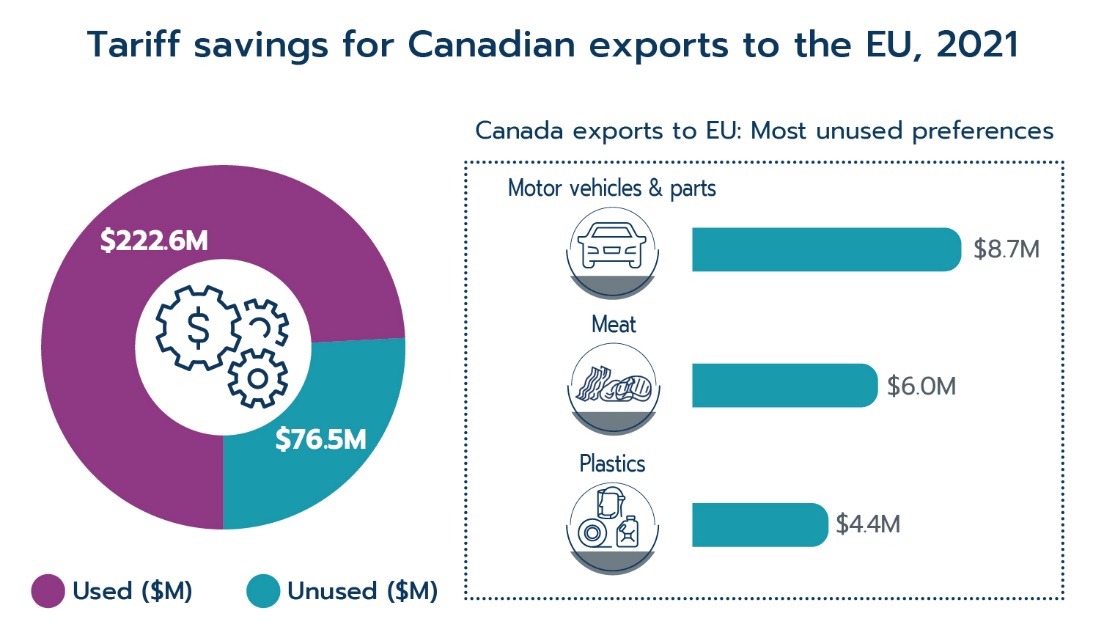
Tariff reductions enjoyed by Canadian products exported to the EU can contribute to lower prices and in turn, improve competitiveness of Canadian firms in the EU market. Close to $6.0 billion worth of Canadian exports were CETA-eligible in 2021, and Canadian companies saved an estimated $222.6 million in duties. However, because CETA preferences have not been fully utilized, an additional $76.5 million in potential savings have yet to be realized. These potential savings are estimated assuming the traded goods qualify for duty-free status under CETA. Some of the sectors with the most unused tariff savings are Motor vehicles and parts (approximately $8.7 million), Meat (approximately $6.0 million), and Plastics (approximately $4.4 million)Footnote 36 . If all of these savings had been fully realised, total tariff savings for Canadian products entering the EU in 2021 could have been as high as $299.1 millionFootnote 37 .
Tariff savings Canadian exports to EU ($M)
Text version
Tariff savings Canadian exports to EU ($M)
- Used 222.6
- Unused 76.5
Canada exports to EU: Most unused preferences
- Motor vehicles and parts 8.7 million
- Meat 6.0 million
- Plastics 4.4 million
Data: DG Trade of the EU Commission
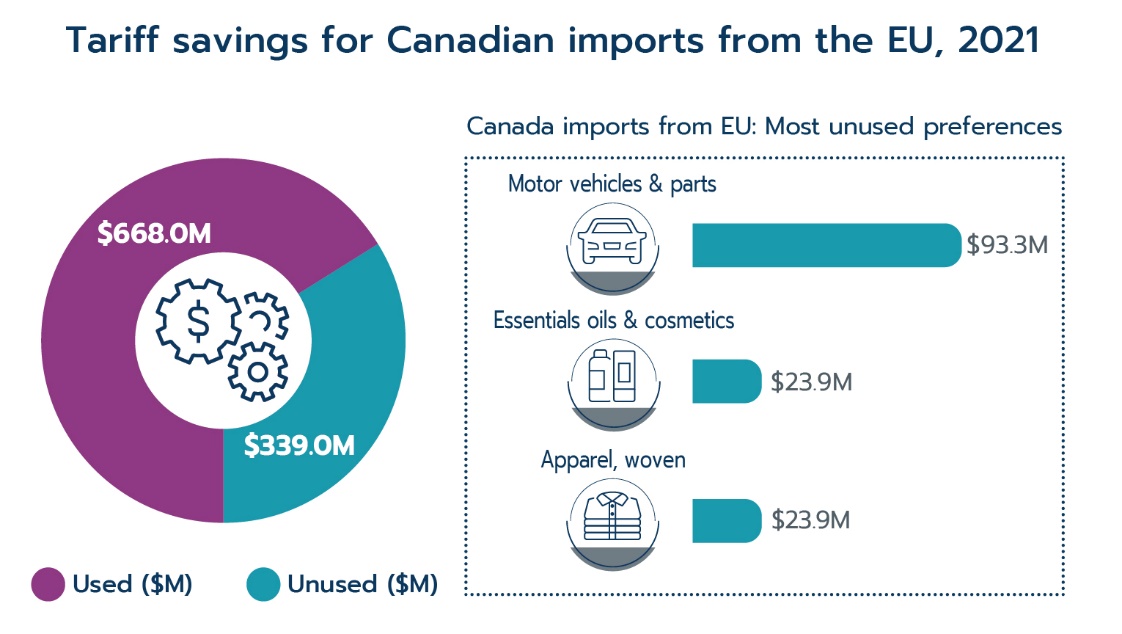
Benefits of tariff savings can also pass to Canadian consumers who may see lower prices for EU imports. In 2021, total EU imports covered by CETA amounted to almost $16.0 billion and have garnered $668.0 million in duties saved. Even so, as much as $339.0 million in duties were paid that could have potentially been avoided if utilization was 100% and if all products qualified for CETA treatment. Some sectors with large amounts of unused tariff savings include Motor vehicles and parts (approximately $93.3 million), Essential oils and cosmetic preparations (approximately $23.9 million) and Apparel, not knitted (approximately $23.9 million)Footnote 38 . If CETA preferences had been fully utilized, approximately $1.1 billion in duties could have been savedFootnote 39 .
Text version
Tariff savings Canadian imports from EU ($M)
- Used 668.0
- Unused 339.0
Canada imports from EU: Most unused preferences
- Motor vehicles and parts 93.3 million
- Essential oils & cosmetics 23.9 million
- Apparel, woven 23.9 million
Data: Statistics Canada and Canada Border Services Agency
Conclusion
Trade between Canada and the EU has seen impressive growth since the provisional implementation of CETA. Despite the COVID-19 pandemic, two-way trade grew to a record high of $100 billion in 2021, an increase of 33.7% compared to the 2016 level, prior to the agreement coming into force. This expansion outpaced significantly the 18.6% growth of total Canadian merchandise trade over the same period.
Trade growth was broad-based, with most product sectors expanding. Canadian merchandise exports to the EU increased by 46.4% since 2016, and imports from EU rose 28.4%. Moreover, the gains from CETA were widespread as nearly every Canadian province and territory posted an increase in trade with the EU since CETA implementation.
Exports of products that received tariff reductions from CETA, grew 24.6% between 2016 and 2021, and the products that saw the largest tariff reductions also experienced the largest growth. Exports of products with a tariff reduction of more than 10 percentage points increased by 54.5%; those that received a reduction of between 5 and 10 percentage points grew by 36.2%, and those witnessing a reduction of between 0.1 and 5 percentage points expanded by 19.5%.
Utilization of CETA preferences showed a notable improvement in both trade directions in 2021. Canadian exports to the EU have a utilization rate of 65.4%, while imports by Canada from the EU have a CETA utilization rate of 59.5%. The increased but moderate level of CETA utilization indicates that businesses still stand to gain more from tariff savings by increasing their use of CETA preferences.
- Date Modified: