
Canada’s Environmental and Clean Technology Sector
July 2023
Kevin Jiang
Key findings
- The environmental and clean technology (ECT) sector accounted for 2.9% of Canada’s GDP and 1.6% of employment in 2021.
- Although the ECT sector's real GDP growth surpassed that of the entire Canadian economy each year from 2012 to 2016, its pace has often been slower than the overall economy in recent years. However, despite this slowdown, the ECT sector experienced significant growth of 21% over the past decade, surpassing the 15% economic growth achieved by the overall Canadian economy.
- Employment growth in the ECT sector expanded 16% since 2012, outpacing the 8% growth in total Canadian employment.
- The sector exhibited strong export performance during 2012 to 2021, surpassing the growth rate of total Canadian exports by expanding an impressive 90%.
- ECT goods were responsible for almost the entire growth, mainly supported by sales to the United States and Europe.
- Services accounted for a small share of ECT exports and were mostly concentrated in scientific and R&D services.
- Canadian SMEs in the clean technology industry are more active in international markets than SMEs in other industries: 25% reported export sales in 2020 vs 12% for all Canadian SMEs. They are less likely to be majority-owned by women or by racialized groups.
Introduction
Environmental and clean technologies (ECT) play a crucial role in enabling Canada and all global economies to meet their carbon reduction objectives. Additionally, they are essential for fostering economic growth while protecting our environmental heritage. Severe climate events in the past few years with global heat waves, flooding, and other natural disasters have put an even greater emphasis on the need for environmentally sustainable economic growth.
The lack of an international consensus on a definition of ECT as well as measurement difficulties, however, mean that data on Canada’s ECT sector and its role in the domestic economy has been limited. The purpose of this report is to provide an overview of Canada’s environmental and clean technology sector performance with a focus on exports.
This report follows the common clean technology definition and taxonomy and uses data from different sources to provide a comprehensive view of the sector in Canada and its international performance. The first section focuses on the ECT sector’s overall performance by looking at its contribution to the domestic economy in terms of GDP, employment, and exports. The second section provides an analysis of the role of small and medium sized enterprises (SMEs) in the ECT sector.
Contribution to the Domestic Economy
ECT sector composition
Environmental and clean technology products are defined in the Environmental and Clean Technology Products Economic Account (ECTPEA) as any process, product or service that reduces environmental impacts through any of the following three strategies:
- environmental protection activities that prevent, reduce or eliminate pollution or any other degradation of the environment
- resource management activities that result in the more efficient use of natural resources, thus safeguarding against their depletion
- the use of goods that have been adapted to be significantly less energy or resource intensive than the industry standard
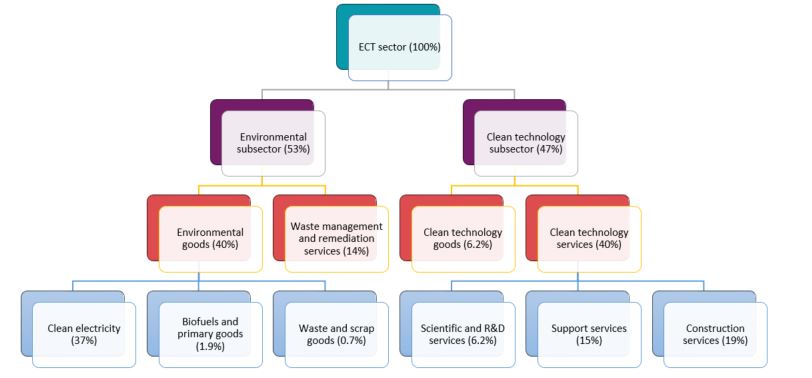
In nominal terms, the ECT sector in Canada was valued at $73 billion in 2021. This represents about 2.9% of Canada’s economy, a share that has remained relatively stable since the start of the data series in 2007. The ECTPEA breaks down the ECT sector into two broad subsectors–the environmental subsector, which accounts for 53% of the sector, and the clean technology subsector, accounting for the remaining 47%. The gap between the two subsectors has narrowed since 2007, when the environmental subsector accounted for nearly 57% of the entire sector.
Figure 1 shows the environmental subsector (including clean electricity, biofuels and primary goods, and waste management and remediation services) is largely comprised of electricity generation activities. Clean electricity generated from renewable and nuclear sources totalled two-thirds of this subsector in 2021, followed by waste management and remediation services and biofuels and primary goods. On the other hand, the clean technology subsector includes manufactured goods, scientific and research and development services, construction services, and support services. This subsector is dominated by services, which together accounted for 87% of the subsector in 2021, leaving the rest to clean technology goods.
Figure 1: ECT sector composition, 2021
Source: Adapted from Statistics Canada, Table 36-10-0627-01.
Text version
| Sector | Share (%) |
|---|---|
| ECT sector | 100 |
| Environmental subsector | 53 |
| Environmental goods | 40 |
| -Clean electricity | 37 |
| -Biofuels and primary goods | 1.9 |
| -Waste and scrap goods | 0.7 |
| Waste management and remediation services | 14 |
| Clean technology subsector | 47 |
| Clean technology goods | 6.2 |
| Clean technology services | 40 |
| -Scientific and R&D services | 6.2 |
| -Support services | 15 |
| -Construction services | 19 |
Sector growth
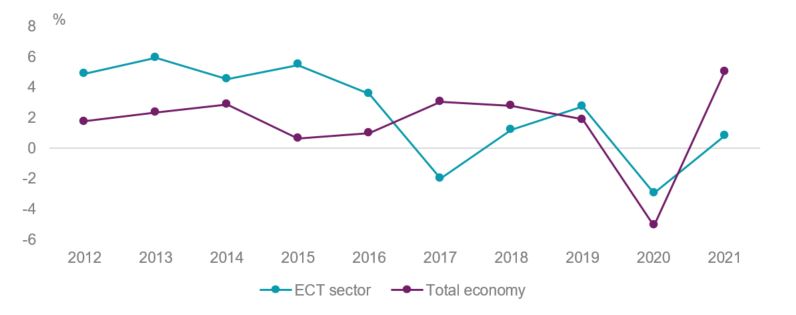
Canada’s ECT sector’s real GDP increased by 21% over 2012 to 2021, significantly outpacing the 15% growth recorded by the overall Canadian economy over the same period. Most of this growth, however, occurred between 2012 and 2016 (Figure 2). Following a slight downturn in 2017, the annual growth of the ECT sector has predominantly mirrored or lagged behind that of the broader economy.
Although the contraction experienced during the pandemic was significant, it aligned closely with the overall economic decline in 2020. However, the subsequent economic recovery in 2021 proved to be less robust.
Figure 2: Growth in ECT sector vs total Canadian economy real GDP growth, 2012 - 2021
Source: Statistics Canada, Table 36-10-0630-01. Calculations by the Office of the Chief Economist.
Text version
| ECT sector | Total economy | |
|---|---|---|
| 2012 | 4.89 | 1.76 |
| 2013 | 5.94 | 2.33 |
| 2014 | 4.54 | 2.87 |
| 2015 | 5.46 | 0.66 |
| 2016 | 3.56 | 1.00 |
| 2017 | -1.97 | 3.04 |
| 2018 | 1.22 | 2.78 |
| 2019 | 2.75 | 1.89 |
| 2020 | -2.94 | -5.07 |
| 2021 | 0.80 | 5.01 |
Both the environmental and clean technology subsectors recorded rapid real GDP growth from 2012 to 2021. Every main component in the environmental subsector expanded over this period. Biofuels and primary goods registered the fastest growth, expanding from $222 million in 2012 to $1.3 billion in 2021, an increase of over 5 folds, followed by waste and scrap goods (30%) and waste management and remediation services (26%). However, overall subsector growth was dragged down by sluggish growth in clean electricity which only expanded by 14%.
Conversely, the clean technology subsector exhibited a more concentrated growth pattern, primarily driven by the substantial expansion of clean technology support services, which accounted for nearly 90% of the entire subsector's growth.
EmploymentFootnote 1
While some clean technology companies are capital-intensive, the ECT sector as a whole is still an important source of employment for Canadians. In 2021, total employment in environmental and clean technology activities is estimated at over 314,000, representing approximately 1.6% of all jobs in Canada. Of these workers, 40% were in the environmental subsector, while the remaining 60% were involved in the clean technology subsector.
Utilities was the largest industry, employing over one-fifth of all workers in the ECT sector (Table 1), followed by administrative, waste management and remediation services and engineering construction. The total of other ECT industries also accounted for nearly 20% of all ECT workers.
Table 1: Number of jobs in environmental and clean technology activities by industry, 2021
| Employment (2021, jobs) | Share (2021, %) | 21/12 (∆%) | |
|---|---|---|---|
| Utilities | 65,656 | 20.9 | -6.9 |
| Administrative, waste management & remediation services | 55,515 | 17.7 | 58.5 |
| Engineering construction | 48,581 | 15.5 | -25.4 |
| Professional, scientific and technical services | 43,660 | 13.9 | 59.2 |
| Manufacturing | 38,582 | 12.3 | 44.2 |
| Other industries | 62,262 | 19.8 | 35.5 |
| Total ECT sector | 314,257 | 100.0 | 16.1 |
Source: Statistics Canada, Table 36-10-0632-01. Calculations by the Office of the Chief Economist.
Similar to real GDP growth, job growth in the ECT sector has surpassed that of other industries in Canada. From 2012 to 2021, total ECT employment grew 16%, outpacing the 8% growth in total Canadian employment. Furthermore, the growth has been widespread, with 4 out of 6 ECT industries posting double-digit growth rates since 2012. The only industries with declines in employment over this period were utilities and engineering construction, which contracted by 6.9% and 25% respectively since 2012.
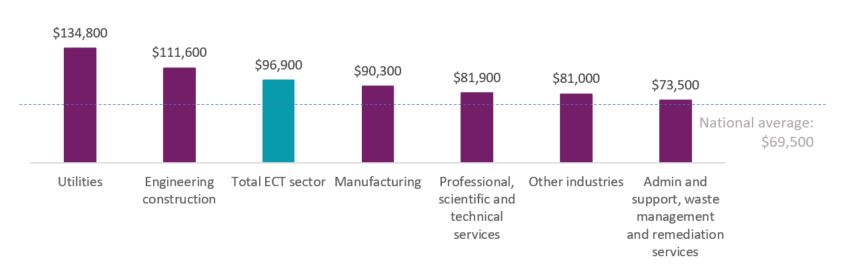
Not only did the ECT sector see much faster employment growth, but jobs in the sector also have a notably higher annual average compensation compared to the national average. The average annual compensation in the ECT sector was $96,900 in 2021. This represents a premium of 39% over the national average of $69,500. In 2021, the top 3 highest paid industries were utilities, engineering construction, and manufacturing (Figure 3).
Figure 3: Average annual compensation of ECT employees, 2021
Source: Statistics Canada, Table 36-10-0632-01.
Text version
| 2021 | |
|---|---|
| Admin and support, waste management and remediation services | 73,500 |
| Other industries | 81,000 |
| Professional, scientific and technical services | 81,900 |
| Manufacturing | 90,300 |
| Total ECT sector | 96,900 |
| Engineering construction | 111,600 |
| Utilities | 134,800 |
| National average | 69,500 |
Exports
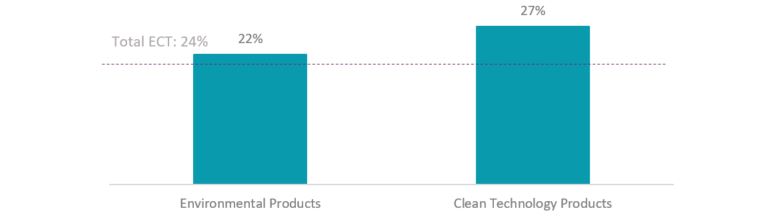
Canadian exports of ECT goods and services reached $18 billion in 2021, representing roughly 2.3% of total Canadian exports. The sector as a whole is less export-oriented when compared to others in Canada, with an export-to-GDP ratio of approximately 24% in 2020 as opposed to 31% for Canada overall. Furthermore, there exists a 5 percentage point gap between the environmental and the clean technology subsectors (Figure 4).
Figure 4: ECT products export-to-GDP ratio, 2021
Sources: Statistics Canada, Tables 36-10-0629-01 and 36-10-0627-01. Calculations by the Office of the Chief Economist.
Text version
| Export-to-GDP ratio | |
|---|---|
| Environmental Products | 22% |
| Clean Technology Products | 27% |
Canada’s ECT exports are dominated by goods (Table 2). In 2021, ECT goods exports were valued at $16 billion (nearly 90% of total ECT exports). In contrast, ECT services exports stood at only $2.1 billion in 2021, mainly consisting of scientific and research and development services and clean technology support services.
Table 2: ECT sector export composition, 2021
| Product | 2021 ($M) | Share of total (%) |
|---|---|---|
| Environmental goods and services | 8,701 | 48.6 |
| Goods | 8,547 | 47.7 |
| Services | 153 | 0.9 |
| Clean technology goods and services | 9,204 | 51.4 |
| Goods | 7,233 | 40.4 |
| Services | 1,971 | 11.0 |
| Total ECT goods and services | 17,905 | 100.0 |
Source: Statistics Canada, Table 36-10-0629-01. Calculations by the Office of the Chief Economist.
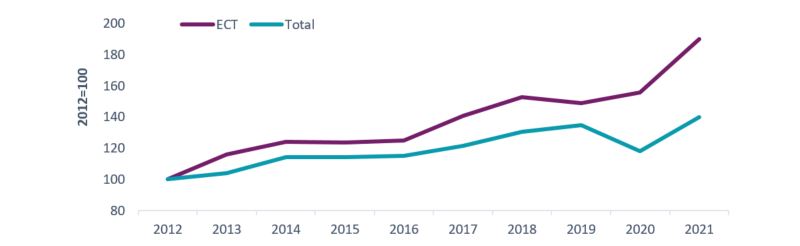
Growth of ECT exports has been especially strong. Prior to the pandemic, total ECT goods and services exports expanded by 49%, from $9.4 billion in 2012 to $14 billion in 2019, outpacing the 35% growth recorded by overall Canadian exports over the same period (Figure 5).
Despite pandemic impacts, ECT exports continued to grow in 2020 and 2021. As a result, ECT exports expanded by 90% over 2012 to 2021, more than double the 40% rate of growth recorded by overall Canadian exports over the same period. ECT goods were responsible for almost the entire growth from 2012 to 2021, while ECT services only expanded by $1.0 billion in value.
Figure 5: Growth of ECT exports vs total Canadian exports, 2012-2021
Sources: Statistics Canada, Tables 36-10-0629-01 and 36-10-0014-01. Calculations by the Office of the Chief Economist.
Text version
| ECT exports (2012=100) | Total exports (2012=100) | |
|---|---|---|
| 2007 | 91 | 97 |
| 2008 | 110 | 103 |
| 2009 | 90 | 81 |
| 2010 | 89 | 88 |
| 2011 | 99 | 98 |
| 2012 | 100 | 100 |
| 2013 | 116 | 104 |
| 2014 | 124 | 114 |
| 2015 | 124 | 114 |
| 2016 | 125 | 115 |
| 2017 | 141 | 121 |
| 2018 | 153 | 130 |
| 2019 | 149 | 135 |
| 2020 | 156 | 118 |
| 2021 | 190 | 140 |
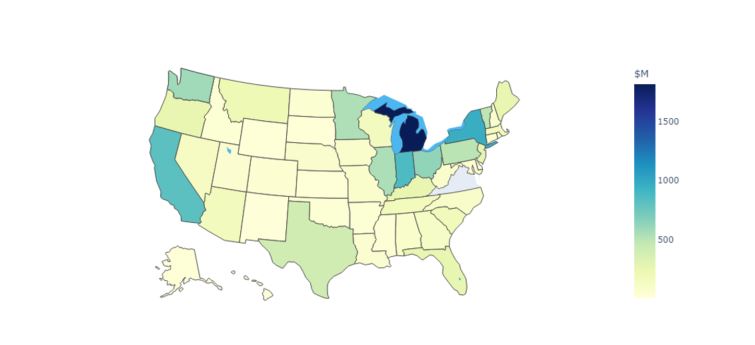
The United States was Canada’s largest export market for ECT goods and services and the main driver of growth. It was the destination for more than three-quarters of total Canadian ECT exports in 2021, for a value of $14 billion, more than double the value in 2012.
Approximately 52% of the 2021 value of ECT exports to the U.S. was from the clean technology subsector, while the environmental subsector accounted for the remaining 48%, which were mainly and clean electricity and waste and scrap goods. Exports were most concentrated in the Northeastern states located along the U.S.-Canada border (Figure 6), with Michigan being the top U.S. market by far, accounting for 13% of Canada’s total ECT exports, trailed by New York and Indiana.
Figure 6: Distribution of Canadian ECT exports in the United States, 2021
Source: Statistics Canada, Table 36-10-0646-01. Calculations by the Office of the Chief Economist.
Text version
| State | ECT exports ($M) |
|---|---|
| United States | 13,562 |
| Michigan | 1,820 |
| New York | 961 |
| Indiana | 864 |
| California | 815 |
| Ohio | 626 |
| Washington, State | 583 |
| Illinois | 543 |
| Minnesota | 539 |
| Pennsylvania | 498 |
| Vermont | 490 |
| Texas | 407 |
| New Jersey | 286 |
| Florida | 265 |
| Kentucky | 264 |
| Maine | 261 |
| Oregon | 258 |
| Virginia | 218 |
| Montana | 202 |
| South Carolina | 173 |
| Tennessee | 171 |
| Arizona | 166 |
| Massachusetts | 157 |
| Wisconsin | 155 |
| Nevada | 133 |
| Georgia | 117 |
| North Carolina | 101 |
| Alabama | 82 |
| Missouri | 80 |
| West Virginia | 80 |
| Iowa | 77 |
| Nebraska | 76 |
| New Hampshire | 74 |
| Louisiana | 62 |
| Maryland | 57 |
| Utah | 56 |
| North Dakota | 54 |
| Colorado | 45 |
| Connecticut | 44 |
| Oklahoma | 42 |
| Arkansas | 40 |
| Idaho | 37 |
| Rhode Island | 28 |
| Mississippi | 28 |
| Kansas | 21 |
| South Dakota | 18 |
| Alaska | 18 |
| Wyoming | 16 |
| New Mexico | 12 |
| Delaware | 6 |
| Hawaii | 5 |
Europe posted the fastest increase in demand for Canadian ECT exports out of all the main regions (Table 3), with a rapid growth of over 106% since 2012, mainly to the Norway, Germany, and the United Kingdom. As a result, Europe solidified its position as the second largest market for Canadian ECT exports accounting for 12% in 2021.
ECT exports also saw notable improvements to Asia, Central America, and South America. In contrast, exports to the Antilles, Middle East, and Oceania exhibited only modest growth, while exports to Africa contracted, falling below the levels recorded in 2012.
Table 3: ECT exports by destination
| Value (2021, $M) | Share (2021, %) | 21/12 (∆%) | |
|---|---|---|---|
| North America | 13,656.9 | 76.3 | 102.4 |
| Europe | 2,101.3 | 11.7 | 106.3 |
| Asia | 1,554.1 | 8.7 | 48.3 |
| Africa | 172.9 | 1.0 | -6.2 |
| South America | 139.1 | 0.8 | 31.3 |
| Antilles | 97.9 | 0.5 | 18.5 |
| Middle East | 84.7 | 0.5 | 12.5 |
| Oceania | 68.5 | 0.4 | 9.5 |
| Central America | 16.4 | 0.1 | 46.7 |
| All trading partners | 17,905.1 | 100.0 | 90.0 |
Source: Statistics Canada, Table 36-10-0646-01. Calculations by the Office of the Chief Economist.
Profile of clean technology SMES
SMEs make an important contribution to the clean technology industry in Canada. There were an estimated more than 2,000 clean technology SMEs in Canada according to Statistics Canada’s Survey of Financing and Growth of SMEs (2020). These SMEs tend to be:
- faster growing (21% reported growing faster than 10% per year from 2018-2020, vs 16% for SMEs overall)
- much more likely to adopt advanced technologies (57% vs 34% for SMEs overall)
- more active in their on-line presence (76% vs 59% for SMEs overall)
The owners of SMEs in the clean technology industry are also rather different when compared to SMEs in other industries. First, clean technology SMEs are much less likely to be majority-owned by women or racialized‑groups (Figure 7). Second, the owners of clean technology SMEs are more educated, with 79% having attained at least a college, CEGEP or trade school diploma, compared to 70% of owners with the equivalent education for all Canadian SME. Moreover, Canadian clean technology SMEs are notably more engaged in international markets compared to SMEs in other industries. In 2020, 25% of clean technology SMEs were involved in exports, whereas the average for all Canadian SMEs stood at 12%.
Figure 7: Ownership characteristics of clean technology SMEs, 2020 (% share of firms)
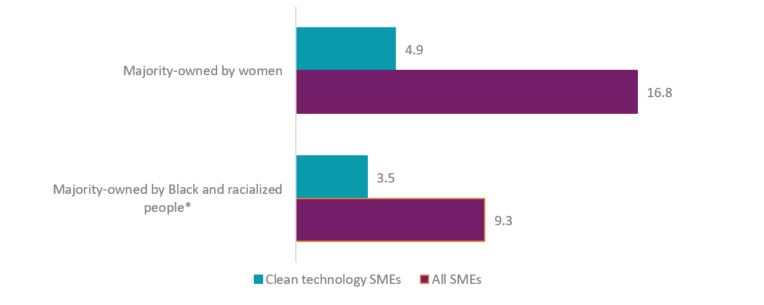
* Category does not include Indigenous Peoples
Source: Statistics Canada, Table 33-10-0459-01. Calculations by the Office of the Chief Economist.
Text version
| Clean technology SMEs | All SMEs | |
|---|---|---|
| Majority-owned by women | 4.9 | 16.8 |
| Majority-owned by Black and racialized people* | 3.5 | 9.3 |
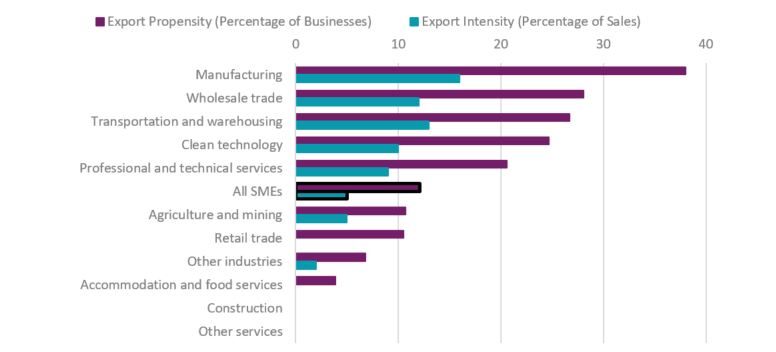
SMEs in the clean technology industry have the fourth highest export propensity out of all the industries in Canada in 2020, after manufacturing, wholesale trade, and transportation and warehousing (Figure 8). By destination, the U.S. led all countries with 88% of exporting clean technology SMEs in Canada reporting sales in the U.S. Other popular export destinations included the United Kingdom (8.1%), China (8.1%), Mexico (7.4%), and Japan (7.4%).
Additionally, not only do clean technology SMEs have a high tendency to export, they are also one the most export intensive, with an average of 10% of their sales derived from exports compared to only 5.0% for all Canadian SMEs in 2020. This high level of international engagement has a number of potential benefits as exporting firms have empirically been found to have lower failure ratesFootnote 2 and increased productivity growth.Footnote 3
Clean technology SMEs also have a higher tendency to export goods compared to all SMEs in Canada (i.e. higher export propensity). Out of all clean technology SMEs that exported, nearly half (49%) reported exporting goods only, and 33% reported exporting both goods and services, while just 18% reported exporting only services. In contrast, overall exporting SMEs in Canada are much more evenly divided between exporting goods only (38%) and services only (45%).
Figure 8: Canadian SMEs export propensity and intensity by industry, 2020
Note: clean technology is not a part of the North American Industry Classification System but a special aggregation of the survey
Source: Statistics Canada, Table 33-10-0448-01. Calculations by the Office of the Chief Economist.
Text version
| Export Propensity (Percentage of Businesses) | Export Intensity (Percentage of Sales) | |
|---|---|---|
| Manufacturing | 38 | 16 |
| Wholesale trade | 28.1 | 12 |
| Transportation and warehousing | 26.7 | 13 |
| Clean technology | 24.7 | 10 |
| Professional and technical services | 20.6 | 9 |
| All SMEs | 12.1 | 5 |
| Agriculture and mining | 10.7 | 5 |
| Retail trade | 10.5 | 0 |
| Other industries | 6.8 | 2 |
| Accommodation and food services | 3.9 | 0 |
| Construction | 0 | 0 |
| Other services | 0 | 0 |
Conclusion
This report provides an overview of Canada’s ECT sector and examines its contributions to the domestic economy. Comprised of both environmental and clean technology goods and services, the ECT sector has exhibited steady growth, outpacing the overall Canadian economy since 2012. It has also created employment opportunities with above-average compensation. In terms of exports, the ECT sector has witnessed strong growth to not only the U.S. and Europe, but also to countries in Asia, Central America, and South America.
Clean technology SMEs also make a significant contribution to the Canadian economy, demonstrating faster growth, higher adoption of advanced technologies, and a stronger online presence compared to SMEs in other sectors. Clean technology SMEs also exhibit a greater tendency to engage in international markets, with a higher proportion involved in exports and a higher export intensity.
- Date Modified: