
Explaining the volatility of foreign direct investment flows
Zachary MacNaughton
February 2021
Key takeaways
- The historical perspective demonstrates how foreign direct investment (FDI) flows are extremely volatile over time.
- In the energy and mining sector, a large recipient industry of FDI in Canada, transactions between firms are typically very large since the pricing of an operation accounts for the future stream of revenues from extracting the resources in the ground, so can disproportionately affect data.
- FDI flows do not follow the traditional business cycle; FDI decisions are not as much influenced by current economic conditions as other business variables.
- For these reasons, to understand FDI trends or performance requires multiple indicators along with FDI flows.
Introduction
This paper explores the volatility of foreign direct investment (FDI) inflows coming into Canada, and how some increases which may seem extremely significant, such as the 64% growth in flows from 2017 to 2018, can be misinterpreted without proper context and a broader, historical view of FDI flows.
Analysis
FDI is a key driver of global economic growth, meaning that measuring and reporting on it helps track economic performance over time. Policy-makers want as much information as possible to monitor FDI performance and investor sentiment.
At the same time, reporting on and measuring FDI can be challenging. There are multiple factors that can underlie a given statistical result and, as such, a result needs to be analyzed carefully before drawing a conclusion.
First, it is important to be aware that FDI flows can fluctuate drastically from quarter to quarter (as seen Figure 1), and even from year to year (as seen in Figure 2). In fact, the historical volatility stands at 40%, meaning that one can expect changes from year to year of 40%. So, an increase or decrease in flows of the order of 40%, while it appears significant, it is not out of the ordinary.

Text version
Figure 1: Quarterly net FDI flows
Q1 2007-Q4 2019, $B CAD
| Total net flows | Historical average (Q1 2007-Q4 2019) is 14 | |
|---|---|---|
| 21.1 | ||
| 2007 | 22.8 | |
| 30.8 | ||
| 50.7 | ||
| 20.4 | ||
| 8.6 | ||
| 22.8 | ||
| 13.9 | ||
| 1.3 | ||
| 2009 | 0.2 | |
| 15.8 | ||
| 8.7 | ||
| 1.2 | ||
| 10.1 | ||
| -6.7 | ||
| 14.2 | ||
| 12.0 | ||
| 2011 | 17.8 | |
| 8.1 | ||
| 1.3 | ||
| 17.5 | ||
| 5.7 | ||
| 8.5 | ||
| 11.4 | ||
| 21.1 | ||
| 2013 | 22.4 | |
| 12.6 | ||
| 15.4 | ||
| 15.4 | ||
| 13.4 | ||
| 15.8 | ||
| 20.7 | ||
| 7.1 | ||
| 2015 | 23.3 | |
| 19.7 | ||
| 5.9 | ||
| 8.3 | ||
| 14.8 | ||
| 10.3 | ||
| 14.4 | ||
| 7.0 | ||
| 2017 | 7.2 | |
| 11.3 | ||
| 8.9 | ||
| 18.4 | ||
| 7.1 | ||
| 11.8 | ||
| 19.0 | ||
| 12.4 | ||
| 2019 | 20.3 | |
| 16.5 | ||
| 17.9 |
Source: Statistics Canada. Table 36-10-0025-01 Balance of international payments, flows of Canadian direct investment abroad and foreign direct investment in Canada, quarterly (x 1,000,000). Data retrieved on September 15, 2020.
Text version
Figure 2: Annual net FDI flows
2007-2019, $B CAD
| Total net flows | Historical average (2007-2019) = 55.9 | |
|---|---|---|
| 2007 | 125,476 | |
| 2008 | 65,679 | |
| 2009 | 25,948 | |
| 2010 | 29,257 | |
| 2011 | 39,254 | |
| 2012 | 43,076 | |
| 2013 | 71,459 | |
| 2014 | 65,186 | |
| 2015 | 56,057 | |
| 2016 | 47,796 | |
| 2017 | 34,424 | |
| 2018 | 56,315 | |
| 2019 | 67,163 |
Source: Statistics Canada. Table 36-10-0025-01 Balance of international payments, flows of Canadian direct investment abroad and foreign direct investment in Canada, quarterly (x 1,000,000). Data retrieved on September 15, 2020.
Even fluctuations greater than 40% warrant scrutiny. A large increase like the one observed between 2017 and 2018 of $21.9 B or 64%, can appear at first glance as being very significant. When compared to the historical average, however, it becomes clear that the 2018 result is in line with the historical performance ($56.3B versus $55.9B), exhibiting a deviation from the average of only 0.7%, or $0.4B. So 2018 performance saw a large increase but in fact, it was at par with the historical average.
Another factor that can influence the results and the fluctuations observed is large transactions in a given year: a single transaction can alter the total result for FDI flows in a given year. The decline in 2017 is a case to point. The decrease in FDI flows into Canada from 2016 to 2017 was strongly influenced by two transactions in the energy sector. Specifically, ConocoPhillips from the United States sold oil sands and conventional assets to the Canadian Cenovus Energy for $17.7B, while Royal Dutch Shell from the Netherlands sold oil sands assets to Canadian Natural Resources Limited for $11.1B. If these two transactions are omitted from the 2017 result, the FDI flows that entered Canada were about $11B greater, i.e. the two sales in the energy sector translated in FDI flows of $11B leaving Canada and “cancelling” $11B of incoming flows. So, in fact, in 2017, at least $45.4B of FDI flows came to Canada, an “adjusted” result almost at par with the 2016 results of $47.8B. The conclusion drawn then is quite different: from a significant decline in FDI flows in 2017 to 2017 results being similar to those of the previous year and only slightly below the historical average of $55.9B.
This “adjusted” 2017 result of $45.4B also has implications for the conclusion to be drawn about the 2018 result of $56.3B. Rather than being a very large increase in FDI flows with a growth rate of 64%, the 2018 flows exhibit a noteworthy increase of 24%, yet below the historical volatility of 40%.
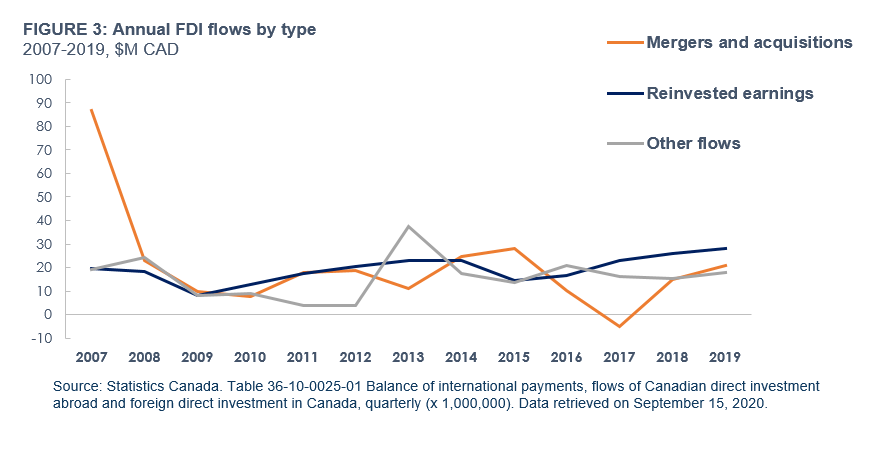
Looking at FDI by type of flows, it is clear that the individual components of FDI flows – reinvested earnings, mergers and acquisitions, and ‘other flows’ – also fluctuate greatly (Figure 3). It becomes even more evident how it is possible for a few transactions to affect FDI flows, whether the transaction is a merger and acquisition deal or a new expansion by one company (which is captured in ‘other flows’). For example, while mergers and acquisitions (M&A) flows increase on average annually by 26% between 2007 and 2019, they decreased by the highest percentage since 2007 between 2016 and 2017(-148%) before experiencing the highest growth since 2007 between 2017 and 2018 (407%). Similarly, the ‘other flows’ increased dramatically between 2012 and 2013, increasing by 908%.
Text version
Figure 3: Annual FDI flows by type
2007-2019, $M CAD
| Mergers and acquisitions | Reinvested earnings | Other flows | |
|---|---|---|---|
| 2007 | 87 | 20 | 19 |
| 2008 | 23 | 18 | 24 |
| 2009 | 10 | 8 | 8 |
| 2010 | 8 | 13 | 9 |
| 2011 | 18 | 17 | 4 |
| 2012 | 19 | 21 | 4 |
| 2013 | 11 | 23 | 37 |
| 2014 | 25 | 23 | 17 |
| 2015 | 28 | 14 | 13 |
| 2016 | 10 | 17 | 21 |
| 2017 | -5 | 23 | 16 |
| 2018 | 15 | 26 | 15 |
| 2019 | 21 | 28 | 18 |
Source: Statistics Canada. Table 36-10-0025-01 Balance of international payments, flows of Canadian direct investment abroad and foreign direct investment in Canada, quarterly (x 1,000,000). Data retrieved on September 15, 2020.
Similar fluctuations are observed in the FDI flows from the United States (Figure 4). U.S. FDI flows contribute an average of 40% to total FDI flows in a given year. U.S. flows grow annually an average of 26% while exhibiting a high of 138% (2012 to 2013) to a low of -49% (2013 to 2014) since 2012. Although U.S flows rank near the bottom in terms of historical volatility (12th out of 15 countries), they still exhibit an historical volatility of 71%.

Text version
Figure 4: Annual total and U.S. FDI flows
2012-2019, $B CAD
| U.S flows | Average U.S. flows (2012-2019) = 27.4 | Total flows | Average total flows (2012-2019) = 55.2 | |
|---|---|---|---|---|
| 2012 | 17 | 43.1 | ||
| 2013 | 40.6 | 71.5 | ||
| 2014 | 20.8 | 65.2 | ||
| 2015 | 41.4 | 56.1 | ||
| 2016 | 24.7 | 47.8 | ||
| 2017 | 18.9 | 34.4 | ||
| 2018 | 23.7 | 56.3 | ||
| 2019 | 32 | 67.2 |
Source: Statistics Canada. Table 36-10-0473-01 Balance of international payments, flows of Canadian direct investment abroad and foreign direct investment in Canada, by selected countries (x 1,000,000). Data retrieved on September 15, 2020.
Finally, two more realities must be accounted for when interpreting FDI flows trend. First, FDI flows do not typically follow the business cycle as other economic indicators do. A 2012 study looking at determinants of FDI flows found that GDP growth was not as significant a determinant of a firm selecting to invest compared to other variables, such as sharing a common language and the host country development level.Footnote 1 As such a positive FDI result, like an increase from one year to the next, should not be attributed to positive economic results in the recipient economy and by extension to investor sentiment improving. Investors do pay attention to the overall economic conditions and the good management of the economy, but their interest lie in a long-term perspective to ensure that their investment will prosper in the years to comeFootnote 2.
Second, FDI statistics are subject to revisions by statistical authorities such as Statistics Canada. In an effort to provide timely information, preliminary annual FDI estimates are published first, usually in April for the previous year, and then are verified and updated the following quarter. Revisions can take place for more than one year and can be significant, such as in 2019 for the 2018 results. The initial estimate for 2018 was $54.7B while the revision stood at $56.3B. The 2017 estimates were also updated at the same time and went for $32.2B to $34.4B. So, using the first estimates, it suggested that FDI flows into Canada grew 70% from $32.2B in 2017 to $54.7B in 2018, while after revision, the FDI flows had increased by 64% from $34.4B to $56.3B.
Conclusion
This note demonstrated that although changes in FDI flows from one given year, or even quarter, to the next may seem very large, whether negative or positive, it helps to look at flows over time. Using the 64% increase in flows from 2017 to 2018, we showed that one or two large transactions can influence greatly the overall result and, if not taken into account, take lead to the wrong conclusions. Looking at the average over time and identifying significant investments or disinvestments, we can get a better sense of what the general trend of FDI flows and overall FDI performance are.
- Date Modified: