
Growing Canada’s Exports to Overseas Markets by 50 Percent
Tuan Tran
Economist, Trade and Economic Analysis Division
Table of Contents
1. Abstract
Canada is a trading nation but Canadian exports are highly concentrated geographically, with around three quarters of Canadian merchandise exports destined for the United States. Recognizing the need for diversification, in its Fall Economic Statement 2018, the Government of Canada launched the Export Diversification Strategy, with the goal of increasing by 50 percent Canada’s overseas exports by 2025. In this report, various private sector forecasts and historical trends were examined to develop the baseline necessary to achieve this goal. Increasing by 50 percent Canadian exports to overseas market by 2025 is ambitious, and will require sustained efforts from all stakeholders involved in the exporting process.
2. Summary
- In the Fall Economic Statement 2018, the Government of Canada set a target of increasing by 50 percent Canadian overseas exports by 2025.
- This target implies reaching $291 billion in Canadian exports of goods and services to non-U.S. destinations, which would require an average annual growth rate of 5.2 percent from 2017 to 2025.
- Strong overseas export growth in 2018 gave Canada a good start toward achieving the stated goal, lowering the required annual growth rate to 4.7 percent for the period 2018 to 2025. However, exports can be volatile and a year of flat or negative growth in the future could put Canada off the projected path required to reach its goal.
- Based on past growth and third-party forecasts, the government’s target, while ambitious, is achievable with concerted efforts from all stakeholders involved in the exporting process.
3. Introduction
In its Fall Economic Statement (FES) 2018, the Government of Canada launched an Export Diversification Strategy, with the goal of increasing by 50 percent Canada's overseas exports by 2025.Footnote 1 To attain this target, Canada’s overseas exports of goods and services need to reach $291 billionFootnote 2 by 2025, requiring an average annual growth rate of 5.2 percent. The purpose of this report is to provide an overview of Canada’s exports to overseas markets, and assess the prospect of reaching the target set in the Fall Economic Statement 2018.
3.1 Why does expanding overseas exports matter?
Canada has a strong history of being a trading nation, with a trade-to-GDP ratio of 66 percent. As a trading nation, Canada benefits from higher paying jobs (Statistics Canada, 2018), increased access to goods, lower consumer prices, and increased productivity (Baldwin and Yan, 2015). However, Canadian exports have a strong reliance on the United States (U.S.), with that country accounting for 75 percent of Canadian merchandise exports in 2018. While the Canada-U.S. commercial relationship has been beneficial to both countries, a strong reliance on a single partner means that Canada is particularly vulnerable to the economic and political environment prevailing in one country. A prime example is crude oil, where the U.S. accounts for 99 percent of Canadian exports, and Canadian producers are vulnerable to developments across the border. The monthly average price gap between West Texas Intermediate (WTI) and Western Canadian Select (WCS) reached $US 45.93 in November 2018, much higher than the usual price gap, which fluctuates between $US 10 and $US 20. This unusual large price gap was due mainly to the lack of export capacity resulting from transportation bottlenecks, but temporary refinery shutdowns in the U.S. exacerbated the problem.
Furthermore, while the U.S. remains one of the largest economies in the world, it has not been the fastest growing in recent decades. Between 2000 and 2017, the U.S. economy grew 38 percent while emerging market economies (EME) together grew 158 percent (IHS Markit Forecast, 2019). In the medium term (2018-2025), the U.S. economy is expected to grow by 14.4 percent, but EME are expected to grow by 34.9 percent (IHS Markit Forecast, 2019). Further diversifying Canadian exports to overseas markets could help Canadian exporters access these fast-growing economies, which can potentially accelerate Canada’s exports growth.
4. Historical economic and export growth
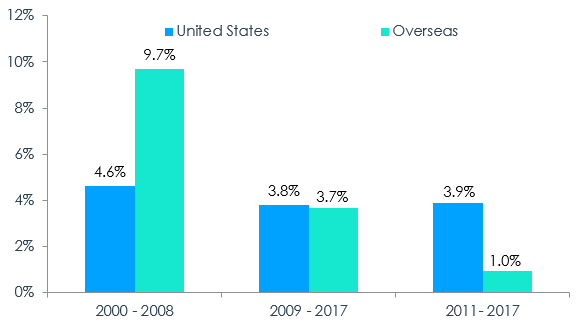
Increased exports to a market and high economic growth in the same market tend to be correlated. During the 2000-2008 period, prior to the global economic crash, overseas economies were growing at a nominal Footnote 3 rate of 9.7 percent per year, compared to 4.6 percent growth in the U.S. (Figure 1). In the post-recession period, the trend has been reversed, with stronger growth coming from the U.S., especially in the 2011-2017 period.Footnote 4
Figure 1: Average Annual Nominal GDP Growth Rate
Data: IHS Markit, Global Economic Forecast 2019, retrieved on 2019-12-10
Source: Global Affairs Canada, Office of the Chief Economist
Text version
| Regions | 2000 - 2008 Annual Nominal GDP Growth (%) | 2009 - 2017 Annual Nominal GDP Growth (%) | 2011 - 2017 Annual Nominal GDP Growth (%) |
| United States | 4.6 | 3.8 | 3.9 |
| Oversea | 9.7 | 3.7 | 1.0 |
Reflecting these economic growth patterns, Canadian overseas exports grew at a much faster pace (6.4 percent) than exports to the U.S. (0.6 percent) prior to the recession (Figure 2). However, as economic growth reversed in the post-recession period, Canadian exports exhibited again a similar pattern, with stronger growth toward the United States (4.1 percent vs 2.5 percent).
A Note on the Exchange Rate
The direction of economic growth and exports growth were the same, but the economy grew at a faster pace than exports prior to the recession, while the opposite was observed after the recession. A potential explanation for this pattern is provided by the changes in the Canadian Effective Exchange Rate (CEER), a weighted average of bilateral exchange rates for the Canadian dollar against the currencies of the country’s major trading partners (Barnett et al., 2016). Prior to the recession, the CEER peaked in October 2007, after appreciating 39.5 percent between January 2000 and October 2007, causing Canadian exports to become more expensive; this is potentially one of the reasons why Canadian exports grew slower than international economic growth. The reverse trend occurred after the recession, with the CEER depreciating 14.3 percent between January 2011 and December 2017.
Figure 2 - Average Annual Canadian Goods and Services Exports Growth Rate

Data: Statistics Canada, Table 36-10-0014-01
Source: Global Affairs Canada, Office of the Chief Economist
Text version
| Regions | 2000 - 2008 Annual Growth in Canadian Exports of Goods and Services (%) | 2009 - 2017 Annual Growth in Canadian Exports of Goods and Services (%) | 2011 - 2017 Annual Growth in Canadian Exports of Goods and Services (%) |
| United States | 0.6 | 5.4 | 4.1 |
| Overseas | 6.4 | 4.8 | 2.5 |
4.1 Composition of overseas exports
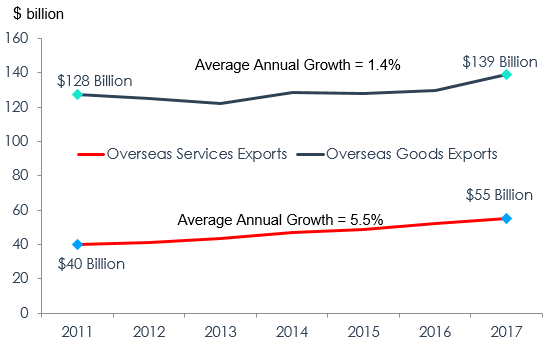
Between 2011 and 2017, services exports to overseas markets grew at a much faster pace (5.5 percent) than goods exports (1.4 percent), causing the share of services exports to increase to 28 percent from 24 percent in overseas markets. In contrast, only 14 percent of Canadian exports to the U.S. were services in 2017.
Figure 3 - Overseas Goods and Services Exports
Data: Statistics Canada, Table 36-10-0014-01
Source: Global Affairs Canada, Office of the Chief Economist
Text version
| 2011 | 2012 | 2013 | 2014 | 2015 | 2016 | 2017 | |
| Canadian Overseas Services Exports ($ millions) | 39,842 | 41,248 | 43,737 | 47,050 | 49,008 | 51,957 | 54,999 |
| Canadian Overseas Goods Exports ($ millions) | 127,589 | 125,194 | 122,188 | 128,387 | 127,866 | 129,465 | 139,050 |
| Annual Growth in Overseas Good Exports, 2011 - 2017 (%) | 1.4 | ||||||
| Annual Growth in Overseas Services Exports, 2011 - 2017 (%) | 5.5 |
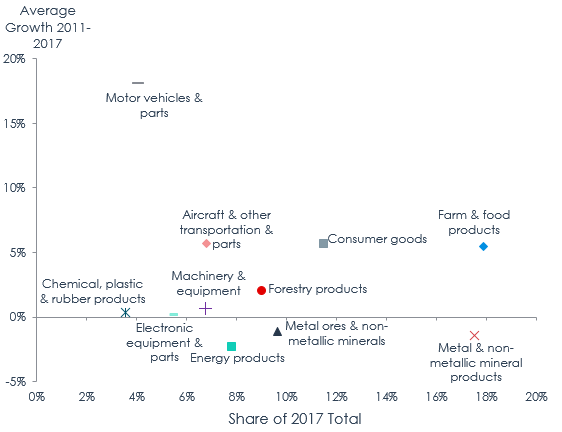
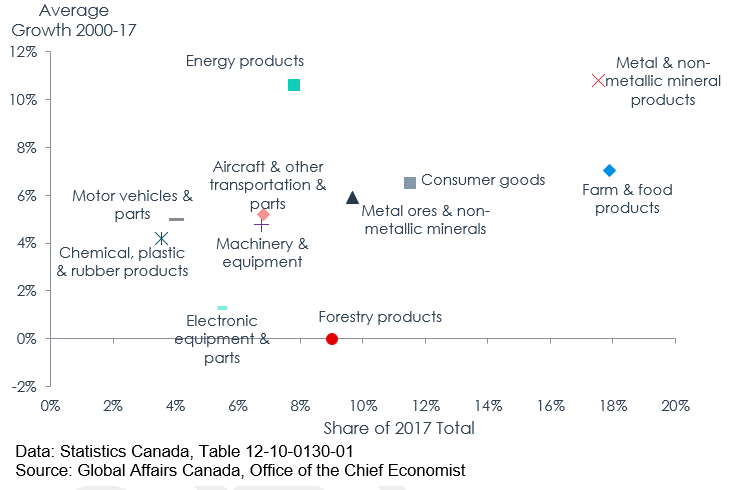
In 2017, the largest share of Canadian merchandise exports to overseas markets belonged to farm and food products (17.9 percent), followed by metal and non-metallic products (17.5 percent) (Figure 4), but while farm and food products grew 5.5 percent per year between 2011 and 2017, metal and non-metallic products declined by 1.4 percent annually. The fastest growing merchandise exports to overseas markets were motor vehicles and parts (18.1 percent per year); however, motor vehicles and parts still account for a small share (4.1 percent) of Canadian overseas merchandise exports.
Figure 4 - Merchandise Exports to Overseas Markets
Data: Statistics Canada, Table 12-10-0130-01
Source: Global Affairs Canada, Office of the Chief Economist
Text version
| Merchandise Products | Share of 2017 exports (%) | Annual exports growth 2011 to 2017 (%) |
| Farm & food products | 17.9 | 5.5 |
| Energy products | 7.8 | -2.3 |
| Metal ores & non-metallic minerals | 9.7 | -1.1 |
| Metal & non-metallic mineral products | 17.5 | -1.4 |
| Chemical, plastic & rubber products | 3.6 | 0.4 |
| Forestry products | 9.0 | 2.0 |
| Machinery & equipment | 6.8 | 0.7 |
| Electronic equipment & parts | 5.4 | 0.2 |
| Motor vehicles & parts | 4.1 | 18.1 |
| Aircraft & other transportation & parts | 6.8 | 5.7 |
| Consumer goods | 11.5 | 5.6 |
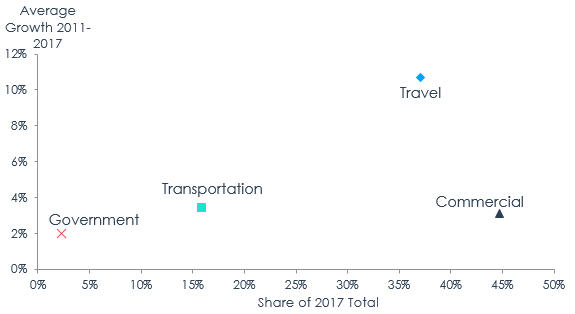
Commercial services (44.7 percent) accounted for the largest share of Canadian services exports to overseas markets in 2017 (Figure 5), but only rank third when it comes to growth between 2011 and 2017 (3.1 percent per year). Travel services (10.7 percent per year) are the fastest growing services exports, representing the second largest share (37.1 percent). Transportation services have been growing at 3.4 percent per year between 2011 and 2017, and accounted for 15.9 percent of Canadian overseas services exports.
Figure 5 - Services Exports to Overseas Markets
Data: Statistics Canada, Table 36-10-0014-01
Source: Global Affairs Canada, Office of the Chief Economist
Text version
| Type of Services | Share of 2017 exports (%) | Annual exports growth 2011 to 2017 (%) |
| Travel | 37.1 | 10.7 |
| Transportation | 15.9 | 3.4 |
| Commercial | 44.7 | 3.1 |
| Government | 2.3 | 2.0 |
5. What is required to reach the target?
Historical growth (I) and leading forecasts (II) were examined to analyze the prospect of reaching the target set in the Fall Economic Statement 2018.
5.1 Extending historical growth
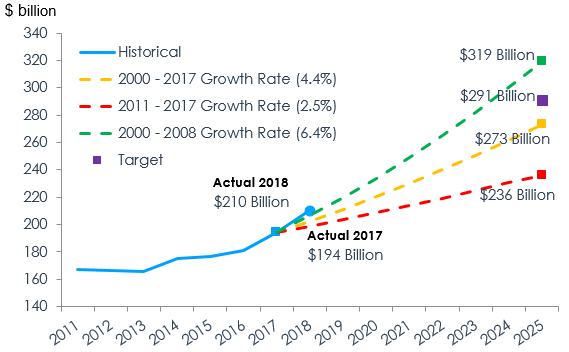
If we extend to 2025 the historical Canadian overseas exports growth rate of 4.4 percent per year registered between 2000 and 2017, Canadian overseas exports would reach $273 billion, which is $17.9 billion short of the $291 billion target (Figure 6). However, in the period prior to the economic crash (2000-08), Canada grew its overseas exports by 6.4 percent per year, and if we project this growth rate to 2025, Canadian exports to overseas markets would reach $319 billion, $28.4 billion higher than the $291 billion target. In recent history (2011-2017), Canadian exports to overseas only grew by 2.5 percent per year, which if extended to 2025 would give Canada $236 billion in overseas exports, $54.8 billion short of the published target. As seen in Figure 4, motor vehicles and parts, consumer goods, farm and food products, and aircraft and other transportation equipment have led the growth in Canadian overseas merchandise exports. The strong growth of motor vehicles and parts is a recent phenomenon, as long-term annual average growth (2000-2017) of motor vehicles and parts exports to overseas markets is 4.9 percent (see Annex for long-term trends). On the services side, travel services led the growth in Canadian overseas services exports, supported by a 7.0-percent annual increase (2011 to 2017) in overseas non-resident travellers to Canada.
While recent growth in Canadian overseas exports has been tepid, 2018 was a strong year (8.5 percent growth). This robust start implies that Canadian overseas exports only need to grow 4.7 percent per year between 2018 and 2025 to reach the stated target.
Figure 6 - Growth in Canada’s Overseas Goods and Services Exports, Based on Historical Growth
Data: Statistics Canada, Table 36-10-0014-01
Source: Global Affairs Canada, Office of the Chief Economist
Text version
| Canadian exports ($ millions) | 2011 | 2012 | 2013 | 2014 | 2015 | 2016 | 2017 | 2018 | 2019 | 2020 | 2021 | 2022 | 2023 | 2024 | 2025 |
| Historical exports to oversea markets | 167,431 | 166,442 | 165,925 | 175,437 | 176,874 | 181,422 | 194,048 | 210,448 | |||||||
| Oversea forecasted exports based on 2000 - 2017 Growth Rate (4.4%) | 194,048 | 202,522 | 211,367 | 220,598 | 230,231 | 240,286 | 250,780 | 261,732 | 273,162 | ||||||
| Oversea forecasted exports based on 2011 - 2017 Growth Rate (2.5%) | 194,048 | 198,879 | 203,829 | 208,904 | 214,104 | 219,434 | 224,896 | 230,495 | 236,233 | ||||||
| Oversea forecasted exports based on 2000 - 2008 Growth Rate (6.4%) | 194,048 | 206,526 | 219,806 | 233,941 | 248,984 | 264,994 | 282,034 | 300,170 | 319,472 | ||||||
| Oversea exports target | 291,072 |
5.2 Forecast scenarios
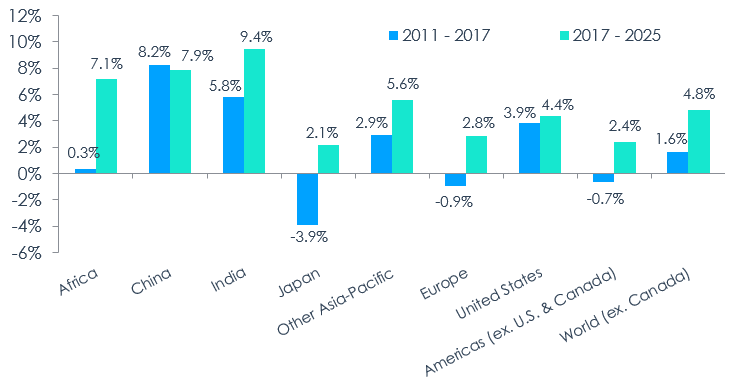
Despite the recent slowdown of the global economy, forecasts continue to predict stronger growthFootnote 5 between 2017 and 2025 than between 2011 and 2017. It is important to remember that the 2011-2017 period included the slow recovery from the global financial crisis, as well as specific crises in a number of European economies. Despite the current tensions, no forecast is currently predicting something on a similar scale in the coming years. Economic growth is expected to be stronger across most major regions and countries in the world (Figure 7). The U.S. is expected to continue experiencing solid growth, but economic growth in the rest of the world is expected to outpace that of the United States. China, the second most important country for Canadian exports, is expected to keep growing at a fast pace, but slower than in the 2011-2017 period. India is expected to be the fastest growing large economy between 2017 and 2025, at 9.4 percent per year. Other emerging regions such as Africa, the Americas (excluding the U.S. and Canada), and other Asia-Pacific countries are predicted to see significant improvement over recent growth rates. In addition, growth in Japan and Europe are expected to switch from negative to positive, further supporting overseas economic conditions.
Figure 7 - Nominal GDP Average Growth by Regions and Select Countries
Data: IHS Markit, Global Economic Forecast 2019, retrieved 2019-12-10
Source: Global Affairs Canada, Office of the Chief Economist
Text version
| Region or Country | Annual Nominal Economic Growth, 2011 - 2017 (%) | Annual Nominal Economic Growth, 2017 - 2025 (%) |
| Africa | 0.3 | 7.1 |
| China | 8.2 | 7.9 |
| India | 5.8 | 9.4 |
| Japan | -3.9 | 2.1 |
| Other Asia-Pacific | 2.9 | 5.6 |
| Europe | -0.9 | 2.8 |
| United States | 3.9 | 4.4 |
| Americas (excluding U.S. & Canada) | -0.7 | 2.4 |
| World (excluding Canada) | 1.6 | 4.8 |
Future global economic growth patterns have an important impact on the outlook for exports. While there are many sources of global economic growth forecasts, only a limited number of forecasts can be used in making comparisons with the $291 billion export target since they need to cover Canadian exports of goods and services until 2025. IHS Markit is one of the few forecasters that cover Canadian exports of both goods and services out to 2025.Footnote 6 According to IHS Markit, Canadian overseas exports are expected to reach $254 billion by 2025, growing 3.4 percent per year from 2017. This is $37 billion short of the stated target (Figure 8). The Conference Board of Canada’s Global Commerce Centre forecast was also examined; it points to a 4.8-percent annual growth rate for Canadian overseas exports, which would reach $283 billion by 2025, marginally missing the target by $7.8 billion. While the Conference Board’s forecast predicts that Canadian overseas exports will almost reach the desired target, the forecast is based on the economic conditions prevailing in March 2019. Rising trade tensions and downgrades to global economic outlook since March 2019 (IMF, 2019) mean that the Conference Board’s forecast is on the optimistic side. As previously mentioned, strong Canadian overseas exports growth in 2018 gave Canada a good start toward achieving the required target, but annual exports growth can be volatile, and a year of flat or negative growth could put Canada off the projected path required to reach the stated target.
Figure 8 - Forecast Scenarios for Growth in Canada’s Overseas Goods and Services Exports

Data: Statistics Canada, Table 36-10-0014-01; IHS Markit, Global Economic Forecast 2019 (retrieved 2019-12-10); Conference Board Forecast, March 2019.
Source: Global Affairs Canada, Office of the Chief Economist
Text version
| Canadian exports ($ millions) | 2011 | 2012 | 2013 | 2014 | 2015 | 2016 | 2017 | 2018 | 2019 | 2020 | 2021 | 2022 | 2023 | 2024 | 2025 |
| Historical exports to oversea markets | 167,431 | 166,442 | 165,925 | 175,437 | 176,874 | 181,422 | 194,048 | 210,448 | |||||||
| IHS oversea exports forecast | 210,448 | 216,231 | 221,413 | 225,231 | 230,888 | 238,681 | 246,716 | 254,302 | |||||||
| Conference Board oversea exports forecast | 203,262 | 212,039 | 223,897 | 235,823 | 247,673 | 260,142 | 271,369 | 283,249 | |||||||
| Oversea exports target | 291,072 |
5.3 Potential risks to the overseas exports target
While global economic conditions are forecasted to be more supportive between 2017 and 2025 than in the recent past, risks to the forecast exist. In this section, a few key risks will be identified and analyzed.
5.3.1 Economic conditions
The difference between U.S. nominal GDP growth and overseas nominal GDP growth will be the important factor for overseas export growth. If overseas growth continue to underperform U.S. growth, Canadian businesses are more likely to be drawn to the U.S. market, leaving overseas exports to underperform. If the inverse happens, Canadian businesses will be drawn to overseas markets, but strong business ties and familiarity with the U.S. can potentially mitigate some of the impact of overseas demand.
5.3.2 Geo-political and institutional risks
Strong legal systems, a well-developed financial system, democratic institutions, a market-based economy, along with historical ties to Canada, mean that geo-political risks are generally lower in developed markets such as the U.S. and the European Union. The opposite could be true for certain emerging overseas markets.
5.3.3 Trade disruption risks
Rising anti-trade sentiment have led to tensions among major world economies, many of which are Canada’s prime trading partners. It is difficult to predict the outcome of trade tensions, but potential negative impacts include disruptions to global value chains (GVC), the realignment of established supply chain systems, and the creation of competing trade blocs, which would harm Canadian exports to any trade bloc of which Canada is not a member. On the other hand, resolving the issues that led to rising tensions in the first place could create stronger relationships that would be beneficial to global trade.
6. Conclusion
In the Fall Economic Statement 2018, the Canadian government set a target of increasing by 50 percent overseas exports by 2025. This implied an annual growth of 5.2 percent between 2017 and 2025, so that overseas exports would reach $291 billion by 2025. Based on various scenarios, this target appears ambitious and will require sustained efforts from Canadian exporters. While forecasted economic conditions are more supportive than in recent years, Canadian exports will need to target economies with fast and accelerating growth to reach the stated goal. One year into this endeavour, strong Canadian overseas exports growth in 2018 gave Canada a good start toward reaching the required target, and the implied annual exports growth rate needed to attain the FES target is 4.7 percent for the period 2018 to 2025. However, annual trade can be volatile and a year of flat or negative growth could put Canada off the projected course required to reach its target. Primary risks to achieving the export goal include weaker than expected economic growth, geo-political and institutional instability, and trade tensions.
Navigating overseas markets can be more difficult than navigating the U.S. market for Canadian exporters due to a lower level of similarity in governance, institutions, culture, and business practices. To make a sustained effort toward reaching the stated target, Canadian exporters can enlist supports from various places, including from the Trade Commissioner Service, which has contacts and key business insights for more than 160 cities worldwide.
7. References
Baldwin, John, and Beiling Yan. 2015. “Trade and Productivity: Insights from Canadian Firm-Level Data.” Institute for Research on Public Policy Volume VI: Redesigning Canadian Trade Policies for New Global Realities. https://on-irpp.org/2JF9ZGR
Barnett, Russell, Karyne B. Charbonneau, and Guillaume Poulin-Bellisle. 2016. “A New Measure of the Canadian Effective Exchange Rate.” Bank of Canada Staff Discussion Paper 2016-1. https://www.bankofcanada.ca/2016/01/staff-discussion-paper-2016-1/
Conference Board of Canada. 2019. “What will Canada’s Trade Look Like in 2025?”
Government of Canada. 2018. Fall Economic Statement 2018.
IHS Markit. 2019. “Global Economic Forecast”. Retrieved on 2019-12-10
International Monetary Fund (IMF). 2019. “World Economic Outlook Chapter 1: Global Prospects and Policies.” World Economic Outlook, October 2019: Global Manufacturing Downturn, Rising Trade Barriers.
Oxford Economics. 2018. “Global Economic Databank.”
Statistics Canada. 2018. “Export-Dependent Employment in Canada, 2017.” Labour Force Survey (Customer Tabulations). https://www150.statcan.gc.ca/n1/pub/11-627-m/11-627-m2018037-eng.htm
8. Annex
Figure 9 - Merchandise Exports to Overseas Markets
Text version
| Merchandise Products | Share of 2017 exports (%) | Annual exports growth 2000 to 2017 (%) |
| Farm & food products | 17.9 | 7.0 |
| Energy products | 7.8 | 10.6 |
| Metal ores & non-metallic minerals | 9.7 | 5.9 |
| Metal & non-metallic mineral products | 17.5 | 10.8 |
| Chemical, plastic & rubber products | 3.6 | 4.2 |
| Forestry products | 9.0 | 0.0 |
| Machinery & equipment | 6.8 | 4.8 |
| Electronic equipment & parts | 5.4 | 1.3 |
| Motor vehicles & parts | 4.1 | 4.9 |
| Aircraft & other transportation & parts | 6.8 | 5.2 |
| Consumer goods | 11.5 | 6.5 |
Figure 10 - Services Exports to Overseas Markets

Text version
| Type of Services | Share of 2017 exports (%) | Annual exports growth 2000 to 2017 (%) |
| Travel | 37.1 | 6.5 |
| Transportation | 15.9 | 3.2 |
| Commercial | 44.7 | 5.3 |
| Government | 2.3 | 0.9 |
- Date Modified: