
The Link Between Air Services Liberalization and Canadian Trade
David BoileauFootnote 1
Mykyta Vesselovsky
Foreign Affairs and International Trade Canada
Abstract
The movement of people and goods by air between Canada and foreign countries is governed by bilateral Air Service Agreements (ASAs). In 2008, Canada had 76 of these agreements, varying in their degree of restrictiveness on intensity and patterns of air transportation. Economic theory predicts that liberalization of restrictions in a market will usually lead to greater competition and efficiency, with consequent increases in volume of services and decreases in price. Prior research has shown air traffic liberalization to lead to lower airfares, higher volumes of passenger (and cargo) traffic and other benefits.
Using a gravity model approach, we investigate the link between ASAs and Canadian trade. Our aim is to evaluate the potential effect of air traffic liberalization, either through the signing of new ASAs or the greater liberalization of existing agreements, on Canadian merchandise and service trade.
Our results show a strong link between air service agreements and Canadian trade. We show that the signing of an ASA has a positive and significant impact on Canadian merchandise trade, but we do not find a significant effect from further liberalization of these agreements. However, both the signing of ASAs and increasing their liberality have significant positive effects on services trade, especially in the case of commercial services. Thus under the new paradigm of trade in tasks, in which the movement of people and services is a crucial component, Canada would benefit not only from signing new ASAs, but also from liberalizing its existing ones.
I. Why Study Air Service Agreements? Some Background
Over the past several decades, air transportation not only has experienced significant growth in Canada and around the world, but has acquired a new importance. New aircraft technologies combined with gradual deregulation have greatly facilitated an increase in the global flow of people and goods, and thus contributed to globalization and the new “trade in tasks”. An important determinant of the intensity and patterns of air transportation are Air Service Agreements (ASA).Footnote 2 In collaboration with Transport Canada, the Chief Air Negotiator at Foreign Affairs and International Trade Canada leads the negotiation of ASAs with foreign countries, enabling and enhancing international air transportation for Canadian passengers and businesses. Transport Canada develops and implements Canada’s international air transport policy while the Canadian Transportation Agency is in charge of managing Canada’s air agreements. As of 2008, Canada had bilateral air agreements with 76 countries. This number has grown greatly in the last decade, with 7-10 agreements signed per year. What kind of agreements are they? Are they right for Canada? Do they contribute significantly to Canada’s commercial activities? These are the questions motivating this paper.
While our primary focus is the impact of these agreements on Canadian trade, it is very likely that greater movement of people and goods enabled by these agreements may bring other economic benefits to Canada that are not discussed in this paper. Our specific aim is to evaluate the potential effect of air traffic liberalization, either through the signing of new air service agreements (ASAs), or the greater liberalization of existing agreements, on Canadian merchandise and service trade.
Since WWII, air transport services have not been part of GATT negotiations and are currently excluded from WTO’s GATS. Consequently, international air traffic has been governed by the terms of air services agreements negotiated bilaterally. ASAs impose restrictions on the airlines that can operate between the two countries, their routes, pricing and freedoms of the air that they enjoy.
International air transport (passengers and cargo) has expanded rapidly over the past few decades, with 688 million international air passengers registered in 2005 and air cargo now accounting for over one-third of the value of world merchandise trade. Half of all air cargo is transported on passenger flights (OECD, 2000), implying a strong correlation between the two. Air traffic expansion (5 to 10 percent a year) has been fuelled by the decline in air transport costs. Hummels (2007) estimates that air transport costs went down 92 percent between 1955 and 2004. While some of this decline has been technology-based, a considerable part came from liberalization. Micco and Serebrisky (2006) estimate that the introduction of Open Skies Agreements (OSAs) in the United States between 1990 and 2003 has reduced nominal air cargo transport costs by 9 percent and increased by 7 percent the share of imports arriving by air. Overall, international air traffic remains heavily regulated, implying a considerable potential for gains from liberalization.
Share of Canadian Exports to non-U.S. Destinations (by Value), 2008
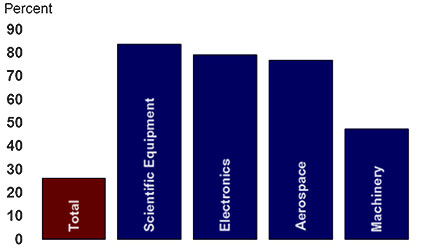
Figure Text Alternative
| Export | Share |
|---|---|
| Total | 26.17% |
| Scientific Equipment | 83.63% |
| Electronics | 78.97% |
| Aerospace | 76.73% |
| Machinery | 47.28% |
Data: Statistics Canada and Transport Canada
Source: Office of the Chief Economist
The impact of air services on trade can be separated into two effects, a direct effect and an indirect. The direct impact is through the transportation of merchandise trade as air cargo now accounts for over one-third of its global value. While the impact seems smaller in Canada with only 11 percent of Canadian exports and 14 percent of imports transported by air, taking out trade with the U.S. brings the Canadian air transportation shares to 26 percent of exports and 21 percent of imports. More importantly, for some commodities, the proportion transported by air is much higher. Higher value-added industries such as scientific equipment, electronics and aerospace see more than 70 percent of non-U.S. exports transported by air, and manufacturing in general more than 50 percent.
Air services have an indirect impact on trade by facilitating the movement of people. Allowing faster and easier travel of people between international destinations can be an important requirement for service trade, which may require the service provider to visit the customer in their destination country in order to provide a service (for example, engineering or construction services). With the greater role of global value chains and trade in tasks, many goods and services are now designed, produced and assembled across the globe, creating a large amount of trade in intermediate inputs within and between firms. Air service facilitates trade within global value chains by connecting the links in the chain at a reasonable cost – whether it be business meetings or transportation of intermediate goods.
The next section gives some background for the air transportation market and discusses the literature estimating its links to the rest of the economy and the benefits of liberalization. Section III sets out the methodology of the paper, section IV discusses the results and section V concludes.
II. Literature Review
Economic theory predicts that liberalization of restrictions in any market in most cases will lead to greater competition, with consequent increases in volume of operations and decreases in price. Even though the air services market is a lot more complex than an average market, these conclusions generally hold in the economic literature on the topic. In the long run, liberalization will also improve efficiency and stimulate development of new practices in the market; these will eventually bring additional benefits. Therefore, in the air services market, economists generally expect liberalization to lead to lower airfares and higher volumes of passenger (and cargo) traffic, followed by systemic increases in efficiency, possible technological spillovers and improved business practices that may lead to further improvement over time.
Liberalization impacts in this market can be divided into many categories, depending on the approach. Following Grancay (2009), we can identify four types of impacts: direct, indirect, induced and catalytic. Direct impacts are primarily air business-centered and include immediate changes in employment, total production etc. attributable to increased air traffic. Indirect impacts act along the whole supply chain of businesses performing the air service activities, which includes fuel suppliers, infrastructure contractors, airport shops, hotels etc. Induced impacts cover the increased spending through the multiplier effects, while catalytic impacts cover a wide variety of effects – change in travel patterns, expansion to new markets, labor market effects, increased productivity, structural effects etc.
The ATAG (2008) study showed that the estimate of all impacts for the total air transport contribution to global GDP in 2006 was 3.6 trillion USD, or 7.5 percent of the global GDP. Remarkably, the study found that the catalytic impacts were twice as high as all other impacts, and these were dominated by the catalytic impacts on trade (over 2 trillion, or over half of the total contribution). These results suggest that the air industry generates more value for trade than its own intrinsic worth, and suggest exploring their link directly.
The link between liberalization of a country’s ASAs and the price and volume of its air traffic flows has been well documented in the literature. Gonenc and Nicoletti (2000) and Doove et al. (2001) showed that restrictive ASAs are associated with higher passenger airfares, while Micco and Serebrisky (2006) shows that ASA liberalization increases the share of imports arriving by air. A presentation to the ICAO conference in 2003 stated that EU air market liberalization resulted in a 34 percent decline in real discount fares.
Kasarda et al. (2004) showed that the number of ASAs is positively related to the volume of air cargo. Achard (2009) demonstrated the positive impact of air traffic liberalization on air cargo flows. Piermartini and Rousova (2008) concluded that bilateral passenger traffic is significantly affected by ASA liberalization, with positive effects from the length of time that the ASA has been in operation. They also showed that combining several liberal provisions in an ASA has an increasingly positive and significant effect on passenger flows. In a similar vein, InterVISTAS-ga (2006) found that liberalization of the EU market has doubled the rate of growth in air traffic in the EU. The implied positive link of the volume of international air services to GDP has also been estimated directly: for example, by InterVISTAS (2006). InterVISTAS paper series on individual countries also demonstrate positive impacts of ASA liberalization on employment, economic growth, consumer surplus and tourism.
Other variables related to air traffic matter for trade as well. Hummels (2001) and Nordas (2006) found that transport time has a large and robust impact on the probability to export. Limao and Venables (2001) added actual transport costs (on top of distance) and found them significant for trade volumes. Kasarda (2005) found the impact of air services liberalization on investment.
Based on the above results, there is a consensus in the literature that ASA liberalization leads to lower prices and higher volumes of air traffic (both passenger and cargo), has positive impacts on trade, employment, tourism and GDP, and is welfare-improving for the economy as a whole.Footnote 3 Our analysis aims at extending the applicability of these results to Canada specifically, and to establish a direct link between the existence of an ASA, its liberality and the volumes of trade conducted by Canada with its partner countries.
III. Methodology and Data
To estimate the effect of ASA liberalization (either by signing new, more liberal ASAs or liberalizing older, more restrictive ASAs), we follow the gravity modelling approach. This is the most frequently used methodology in the literature on this topic and is a general workhorse in empirical analysis of international trade and other flows. It typically explains over 70 percent of variation in the data and is robust in its application to various countries, time periods and types of flows analyzed.
A gravity model explains flows (trade, investment etc.) between two countries by their economic size, transportation costs between them (usually proxied as distance, but may also include tariff and non-tariff barriers, language, logistics, etc.) and other variables that augment the basic framework of the model. Air liberalization variables identified in the literature can be used to augment the gravity model in this manner and their impact on the dependent variable can thus be estimated.
We estimate two separate gravity models, both of which will model total trade (exports + imports) between country i (Canada) and j as follows:
- lnTradeij = F (lnGDPi, lnGDPj, distij, LANGij, LLj, FTAij, WTOij, ASAij)
- lnTradeij = F (lnGDPi, lnGDPj, distij, LANGij, LLj, FTAij, WTOj, ALIij)
where GDPi and GDPj are countries’ total GDP, dist is the weighted distance between them, LANG is a common official language dummy, LL is a dummy variable indicating whether the country is landlocked, FTA is a dummy for the existence of a free trade agreement and WTO is a dummy representing membership in the World Trade Organization by Canada’s partner.
The first equation estimates the effect of having an air agreement on Canadian trade by assigning a dummy variable ASA the value of 1 if Canada has an air service agreement with country j and 0 where there is no existing agreement.
The second equation estimates the effect of greater liberalization of existing service air agreements, where ALI is one of the forms of the Air Liberalization Index that characterizes the ASA between the two countries on a scale of 0 to 50 (50 being the most liberal). This has been recently developed by the WTO and used in Piermartini and Rousova (2008), which gives a full description of how this index is constructed. Once these equations are estimated, the coefficients on ASA and ALI can be interpreted as effects of ASA liberalization on trade. Thus the impact of any hypothetical new ASAs or liberalization of existing ASAs on trade and investment can be assessed.
Data on Canada’s merchandise and services trade with all countries was obtained through Statistics Canada. For country GDP, nominal GDPs in USD were used, sourced from the IMF World Economic outlook database. All other gravity model data, such as weighted measures of distance, dummies for language etc. were compiled from datasets available at Centre d'Etudes Prospectives et d'Informations Internationales (CEPII).
Data for the air service liberalization variables were obtained and compiled by staff of the Office of the Chief Air Negotiator at Foreign Affairs, Trade and Development Canada. Both models look at data for the 1998-2008 period, taking data for every other year to let the trade figures adjust. Out of the 195 sample countries for which trade and other gravity model variables were obtained, 80 had an ASA with Canada as of 2008.
Obtaining values for the variable ALI was a more complex task. To assign an ALI value to a given ASA, we followed the QUASAR methodology set out by the WTO and described in Part Two of the “WTO Second Review of Air Transport Services”Footnote 4. Essentially, the ALI is calculated by looking at 7 key features of an ASA: grant of rights, designation, withholding, capacity, tariffs or pricing, statistics, and cooperative agreements. Details of each feature can be found in Piermartini and Rousova (2008).
The index weighting system for the standard ALI score is given in Table 1 below:
| Features | Variants | Points |
|---|---|---|
| 1. Grant of rights | ||
| a. Fifth freedom rights | Not granted | 0 |
| Granted | 6 | |
| b. Seventh freedom rights | Not granted | 0 |
| Granted | 6 | |
| c. Cabotage rights | Not granted | 0 |
| Granted | 6 | |
| 2. Designation | Single | 0 |
| Multiple | 4 | |
| 3. Withholding | Substantial ownership and effective control | 0 |
| Community of interest | 4 | |
| Principal place of business | 8 | |
| 4. Capacity | Predetermination | 0 |
| Other restrictive | 2 | |
| Bermuda I | 4 | |
| Other liberal | 6 | |
| Free determination | 8 | |
| 5. Tariffs | Dual approval | 0 |
| Country of origin | 3 | |
| Dual disapproval | 6 | |
| Zone pricing | 4 or 7 | |
| Free pricing | 8 | |
| 6. Statistics | Exchanged | 0 |
| Not exchanged | 1 | |
| 7. Cooperative arrangements | Not allowed | 0 |
| Allowed | 3 | |
| Maximum total ALI | 50 | |
Canadian ALI scores ranged from a low of 3 to a high of 34. The distribution of Canada’s 80 data pointsFootnote 5 is given in Figure 1 below, and is compared to the histogram found in Piermartini and Rousova (2008) which shows the ALI values for 2,299 worldwide ASAs. The distribution for Canadian ASAs is similar to the world sample, but differs in that none of the Canadian ASAs have an ALI score higher than 35, while in the world sample 15 percent of ALIs are in the 40-45 range. According to Piermartini and Rousova (2008), this is mainly due to the liberalization of air services between the EU members, for which the ALI score equals 43. Overall, Figure 1 shows that the world ASAs are a lot more variable than Canada’s – some more restrictive, and some more liberal. Overall, Canada‘s average score is similar to the world average.
Figure 1
ALI scores for Canadian ASAs vs. the World’s
World
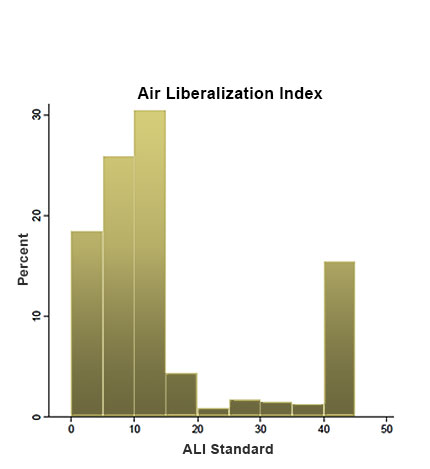
Source: Piermartini and Rousova (2008)
Canada

Source: Office of the Chief Economist
Figure 1 Text Alternative
World
- approximately 70% of ASAs present an ALI below 15
- 15% of ASAs have ALI above 40
Canada
- about 58% of ASAs present an ALI below 15
- no ASA present an ALI above 40
- highest is UK at 36
IV. Results
First, we investigate the effect of the presence of an air service agreement on Canadian trade. Table 2 presents the results of running (1) on both merchandise trade and service trade using OLS (Ordinary Least Squares), PPML (Poisson Pseudo-Maximum Likelihood) and demeaned (de-trended) GDP estimators, to correct for possible heterogeneity.
The results show that the existence of an air service agreement had a positive and significant impact on both merchandise and services trade. For services, all estimation techniques show a large positive impact, with an air agreement being almost as important as sharing a common language. This result would have one believe the signing of new air service agreements could have a significant positive impact on Canada service trade. Indeed, the coefficients under OLS imply that the existence of an ASA corresponds to [exp(0.422)-1], or 53 percent greater bilateral merchandise trade and more than double the value of services trade (exp(0.991)–1 = 1.69). The distance and GDP coefficients are negative and positive respectively, as expected, with the GDP coefficient close to the theoretical value of 1. While FTA and WTO dummies are included for completeness, their coefficients are notoriously unreliableFootnote 6 under this setup and require more advanced models to estimate properly.Footnote 7
| Merchandise Trade | Services Trade | |||||
|---|---|---|---|---|---|---|
| Variable | OLS | PPML | Demeaned GDP | OLS | PPML | Demeaned GDP |
| Dependent variable is the natural log of trade (trade under PPML). | ||||||
| ***, **, * denote 1, 5, and 10 percent significance level, respectively. | ||||||
| P-values in parentheses. | ||||||
| Log Distance | -0.762 (0.000)*** | -0.344 (0.000)*** | -0.761 (0.000)*** | -0.642 (0.000)*** | -0.953 (0.000)*** | -0.640 (0.000)*** |
| Log Partner GDP | 1.049 (0.000)*** | 0.948 (0.000)*** | 1.052 (0.000)*** | 0.632 (0.000)*** | 0.516 (0.000)*** | 0.638 (0.000)*** |
| Log Canadian GDP | 0.591 (0.001)*** | 0.273 (0.013)** | 0.431 (0.078)* | 0.139 (0.558) | 0.444 (0.000)*** | -0.561 (0.229) |
| Landlocked | -0.483 (0.000)*** | -0.362 (0.000)*** | -0.483 (0.000)*** | -0.001 (0.991) | 0.092 (0.536) | -0.100 (0.929) |
| Language | 0.280 (0.000)*** | 0.227 (0.005)*** | 0.285 (0.000)*** | 1.167 (0.000)*** | 0.992 (0.000)*** | 1.172 (0.000)*** |
| ASA | 0.422 (0.000)*** | 0.283 (0.021)** | 0.414 (0.000)*** | 0.991 (0.000)*** | 1.260 (0.000)*** | 1.026 (0.000)*** |
| ALI | 0.227 (0.034)** | 0.999 (0.000)*** | 0.222 (0.037)** | -0.083 (0.449) | -0.489 (0.003)** | -0.860 (0.423) |
| FTA | 0.367 (0.000)*** | -0.371 (0.029)** | 0.367 (0.000)*** | n.a. | n.a. | n.a. |
| Observations | 1,131 | 1,133 | 1,131 | 348 | 348 | 348 |
| R2 | 0.866 | / | 0.867 | 0.695 | / | 0.699 |
Our next question is to determine whether greater liberalization of existing air service agreements has a positive impact on Canadian trade. The above result shows that an ASA does seem to positively impact Canada’s bilateral trade with a country, particularly for services. However, this result says nothing about the details or the quality of the agreement in question. Since 1995, the U.S. has embarked on a new Open Skies approach, greatly liberalizing its air services market. Economic research indicates that air service market liberalization in recent years has lowered air transport costs for both passengers and cargo, as well as leading to larger air imports. Canada has adopted its own version of this policy and has been active in signing ASAs at a rapid pace recently – up to and exceeding 10 a year. These agreements have been more liberal than the ones in the past.
Hence the question: once an air service agreement is in force, could Canada increase its trade with a country by working to liberalize or make the agreement less restrictive on the airlines traveling between the two countries?
Limiting the sample to only those countries which have an ASA with Canada, we investigate the effect of increased liberalization of air service agreements on both Canadian merchandise trade and services trade. Table 3 shows the results, once again with three estimation methods.
| Merchandise Trade | Services Trade | |||||
|---|---|---|---|---|---|---|
| Variable | OLS | PPML | Demeaned GDP | OLS | PPML | Demeaned GDP |
| Dependent variable is the natural log of trade (trade under PPML). | ||||||
| ***, **, * denote 1, 5, and 10 percent significance level, respectively. | ||||||
| P-values in parentheses. | ||||||
| Log Distance | -0.434 (0.000)*** | -0.389 (0.000)*** | -0.440 (0.000)*** | -0.588 (0.000)*** | -0.918 (0.000)*** | -0.585 (0.000)*** |
| Log Partner GDP | 0.937 (0.000)*** | 0.972 (0.000)*** | 0.943 (0.000)*** | 0.588 (0.000)*** | 0.499 (0.000)*** | 0.592 (0.000)*** |
| Log Canadian GDP | 0.902 (0.000)*** | 0.557 (0.031)** | -1.440 (0.297) | -0.022 (0.938) | 0.153 (0.348) | 0.102 (0.962) |
| Landlocked | -0.431 (0.000)*** | -0.253 (0.008)*** | -0.440 (0.000)*** | -0.204 (0.049)** | -0.190 (0.219) | -0.213 (0.040)** |
| Language | 0.282 (0.000)*** | 0.215 (0.011)** | 0.293 (0.000)*** | 1.108 (0.000)*** | 0.982 (0.000)*** | 1.106 (0.000)*** |
| ASA | -0.005 (0.353) | -0.010 (0.068)* | -0.006 (0.232) | 0.039 (0.000)*** | 0.012 (0.033)** | 0.039 (0.000)*** |
| ALI | 0.645 (0.000)*** | 0.936 (0.000)*** | 0.636 (0.000)*** | -0.112 (0.941) | -0.472 (0.006)*** | -0.113 (0.412) |
| FTA | 0.263 (0.046)** | 0.260 (0.091)* | 0.260 (0.043)* | n.a. | n.a. | n.a. |
| Observations | 437 | 437 | 437 | 294 | 294 | 294 |
| R2 | 0.892 | / | 0.896 | 0.681 | / | 0.665 |
These results indicate, first of all, no significant effect of greater ASA liberalization on Canadian merchandise trade. However, there is a significant and positive effect on the services trade. The OLS coefficient of 0.039 (significant at 1 percent) implies that an increase in liberalization of the ALI by about 5 points would correspond to an increase Canada’s bilateral services trade with a particular partner by roughly 20 percent.
To add focus to the analysis above, we repeat it for Canada’s commercial services trade. Total services trade, used as the dependent variable above, includes various types of transactions: commercial services, travel, transportation services, government services. All of these sectors are important to the Canadian economy, and each may be impacted by air travel and thus ASA through different channels. For example, travel services (expenditures by foreigners in Canada and by Canadians abroad) would be directly affected by the amount of people (both business travellers and tourists) traveling between Canada and foreign countries, which is directly impacted by ASAs, since these agreements allow easier flight access to and from Canada. Transportation, on the other hand, would see the influence of ASAs through greater amount of airline services offered, which is a form of transportation services.
However, in our view it is of greater interest to isolate and measure the impact of greater air liberalization on commercial services trade. These are not directly related to the flow of tourism, or the increase in air services themselves. As in the case of merchandise trade, we are interested in the link between the greater mobility of people between Canada and other countries, and increased trade. We therefore repeat our analysis using commercial servicesFootnote 8 alone as our dependent variable, to see if ASA and further liberalization have an impact on these services, taking out the effect on travel and transportation.
Table 4 shows that both the existence of an ASA and its further liberalization (the ALI index) both have positive and significant impacts. This reinforces our results for services and indicates that signing new ASA or further liberalization of existing ASAs is not just increasing Canadian services trade through the tourism and transport components. On the contrary, the ALI coefficient for the commercial services (0.053 under OLS) is stronger than for services in total and indicates that commercial service trade rises about 27 percent for every 5-point increase in ALI index. Meanwhile, the existence of the ASA itself increases the commercial service trade by a factor of [exp(0.991)-1] = 2.69 with a particular country.
| Equation 1 (ASA) | Equation 2 (ALI) | |||||
|---|---|---|---|---|---|---|
| Variable | OLS | PPML | Demeaned GDP | OLS | PPML | Demeaned GDP |
| Dependent variable is the natural log of trade (trade under PPML). | ||||||
| ***, **, * denote 1, 5, and 10 percent significance level, respectively. | ||||||
| P-values in parentheses. | ||||||
| Log Distance | -1.004 (0.000)*** | -1.538 (0.000)*** | -1.002 (0.000)*** | -0.941 (0.000)*** | -1.472 (0.000)*** | -0.937 (0.000)*** |
| Log Partner GDP | 0.640 (0.000)*** | 0.443 (0.000)*** | 0.648 (0.000)*** | 0.586 (0.000)*** | 0.421 (0.000)*** | 0.592 (0.000)*** |
| Log Canadian GDP | -0.362 (0.247) | 0.518 (0.000)*** | -1.024 (0.054)* | -0.628 (0.071)* | 0.009 (0.965) | 0.511 (0.850) |
| Landlocked | 0.374 (0.106) | 0.405 (0.047)** | 0.361 (0.111) | 0.105 (0.576) | 0.252 (0.250) | 0.092 (0.624) |
| Language | 1.305 (0.000)*** | 1.092 (0.000)*** | 1.306 (0.000)*** | 1.163 (0.000)*** | 1.059 (0.000)*** | 1.158 (0.000)*** |
| ASA | 0.991 (0.000)*** | 1.592 (0.000)*** | 1.021 (0.000)*** | n.a. | n.a. | n.a. |
| ALI | n.a. | n.a. | n.a. | 0.053 (0.000)*** | 0.019 (0.009)*** | 0.053 (0.000)*** |
| FTA | -0.370 (0.033)** | -1.399 (0.000)*** | -0.375 (0.023) | -0.418 (0.020) | -1.350 (0.000)*** | -0.421 (0.017)** |
| Observations | 344 | 344 | 344 | 290 | 290 | 290 |
| R2 | 0.633 | / | 0.638 | 0.613 | / | 0.618 |
While the methodology employed by this study is sound, following Piermartini and Rousova (2008) among others, a valid methodological objection could be raised against this process. In its narrower aspect, it would take the following form: the study essentially treats the partner selection process as random. In reality, does not Canada base its ASA choice on some of the factors included in the regression – proximity, size of trade – thereby making the selection process non-random and the results biased? The wider version of the same objection would be as follows: there is significant heterogeneity in the sample, and in fact countries with ASAs who already trade a lot with Canada are biasing the results in favour of ASAs. To eliminate this effect (and all variation between countries), the remedy would be to run a fixed effects estimation (effectively discarding all the countries with ASA prior to the period under scrutiny and basing the conclusions only on those countries that signed or liberalized their ASA during the 1998-2008 period). How do we meet that critique?
It is quite true that Canada’s air agreements, although numerous, are not entered into randomly. But the number of considerations that are taken into account by the decision-makers is far beyond the number of variables in our sample. Whether it is tourism, investment, or hub status - these form no part of our explanatory model. This is not to say that the model is flawed, because what we are interested in is the impact of air agreements and what is not modeled is their selection process. Essentially, however, this is a concern about endogeneity rather than randomness. We observe that the variables of our model are not unduly correlated with the selection criteria: the most recent ASA negotiations in the sample were conducted with the Dominican Republic, Panama, Philippines and Barbados, so it does not look like proximity and trade size were the main decisive factors. Nevertheless, we run formal tests and apply the suggested remedies to the endogeneity problem in order to minimize its possible influence on the results.
The best solution to the heterogeneity problem is, of course, to eliminate all differences that may be peculiar to the particular countries, and analyze only the effects that air agreements have on the trade with the same country over time. This is accomplished by applying the fixed-effects estimation technique. While this method addresses the issue in question well, it creates several other problems. First of all, most of the collected information inherent in the full sample of countries surveyed is simply thrown away. Secondly, since the study’s main interest is the liberalization of air agreements, an agreement needs to have changed over the ten-year period in question to be part of the new sample. This reduces our available observations by about two-thirds: from 437 to 148 for merchandise trade and from 294 to 114 for services trade. As a consequence, distance and GDP coefficients are affected considerably, sometimes changing signs (indicating that the reduced sample may not be very representative of the population), and the ALI effects on merchandise and services trade become insignificant. Nevertheless, the presence of an ASA is still positive and significant for both.Footnote 9 It is apparent that the size of this sample is inadequate to answer the research question in an econometrically perfect way as it sacrifices too much information, and so the insignificance of the ALI under the fixed-effects estimation does not affect our main conclusions.
In another attempt to explore the meaning of the results, we test the causation link between the dependent variable (trade) and ASA/ALI variables. While our main hypothesis is that ASA and ALI influence trade, an argument often used in theory of trade agreements is that not only trade agreements generate trade, but high levels of trade also lead to a trade agreement. The resulting endogeneity is also likely to be present in our case, though probably to a lesser extent. Although differenced estimation (or demeaned GDP technique) accounts for this endogeneity and produces an unbiased estimate, the question is still of interest. A Granger causality test shows a double feedback loop between ASA and merchandise trade (i.e. merchandise trade does lead to an ASA, and an ASA increases merchandise trade), but no causation either way for ALI and merchandise trade (not surprising since these two were not related statistically). Meanwhile, a double feedback loop also exists between ALI and services trade – notably, ALI increases services trade with a lag of a couple of years while any increase in services trade is causing an increase in liberalization.
V. Conclusions and Future Work
Our results show a strong link between air service agreements and Canadian trade. Strong benefits accrue to both merchandise and services trade from the signing of an air service agreement, particularly for services. Over the period of study, Canada had 53 percent greater merchandise trade, 169 percent greater services trade and 269 percent higher commercial services trade with those countries with which Canada had an ASA than those it did not.
Once an ASA is signed by Canada, its level of liberality cannot be shown to have a significant impact on the merchandise trade with the signatory country. But the impact of the ASA’s liberality (measured by the ALI index) on services trade, and in particular on commercial services, comes out strong and positive under all models. Services trade is 20 percent higher for every 5-point increase in the liberality index, and commercial services trade 27 percent greater for every 5-point increase.
These results show that the recent movement towards unrestricted air agreements by Canada and many other countries is justified. It coincides with the greater role of services trade, in particular commercial services, and rewards the liberalizing countries with a considerable increase in these types of trade.
To extend these results, it may be useful to look at more specific commodity and trade data. In the case of merchandise trade, many resource-related goods are not shipped by air, such as oil, resources, and agriculture goods. Eliminating these goods may show a stronger link between air liberalization and merchandise trade.
Finally, there may be a link between ASAs, ALI and investment flows, which could be another spur to the recent ASA liberalization, and could be explored in a separate study.
References
Achard (2009), “The Regulation of International Air Cargo Services”, Master Thesis, GEM, Sciences Po.
Air Transport Action Group (ATAG) (2008), “The Economic and Social Benefits or Air Transport 2008.”, 26 pp..
Baier and Bergstrand (2005), “Do Free Trade Agreements Actually Increase Members’ International Trade?”, FRB of Atlanta, working paper 2005-3, 25 pp..
Doove et al. (2001), “Price Effects of Regulation: International Air Passenger Transport, Telecommunications and Electricity Supply”, Productivity Commission Staff Research Paper, AusInfo, Canberra.
Geloso Grosso and Shepherd (2009), “Liberalizing Air Cargo Services in APEC”, GEM working paper.
Gonenc and Nicoletti (2000), “Regulation, Market Structure and Performance in Air Passenger Transport”, OECD, Paris.
Grancay (2009), “The Economic Impacts of Air Transport Liberalization”, MPRA Paper #16590.
InterVISTAS (2006), “Measuring the Economic Rate of Return on Investment in Aviation”.
InterVISTAS-ga (2006), “The Economic Impact of Air Service Liberalization”.
Hummels (2001), “Time as Trade Barrier”, mimeo.
Hummels (2007), “Transportation costs and international trade in the second era of globalization”, JEP, 21/3, pp. 131-54.
IATA/OEF (2008), “The Economic and Social Benefits of Air Transport”, report for ATAG.
Kasarda et al. (2004), “Air Cargo: Engine of Economic Development”, TIACA study.
Kasarda et al. (2005), “The Impact of the Air Cargo Industry on the Global Economy”, TIACA study.
Limao and Venables (2001), “Infrastructure, Geographical Disadvantage, Transport Costs and Trade”, World Bank Economic Review, 15, pp. 451-79.
Micco and Serebrisky (2006), “Competition Regimes and Air Transport Costs: The Effects of Open Skies Agreements”, JIE, 20, pp. 25-51.
Nordas (2006), “Time and Logistics as a Trade Barrier”, OECD Trade Policy Working Paper #35.
OECD (2000), “OECD Workshop on Principles for the Liberalization of Air Cargo Transportation”.
Piermartini and Rousova (2008), “Liberalization of Air Transport Services and Passenger Traffic”, WTO Staff Working Paper.
Appendix A
Examples of Canada’s bilateral trade with partner countries before and after signing an ASA.
Canada-Russia Bilateral Trade

Figure Text Alternative
| Year | Billions of Dollars |
|---|---|
| 1995 | .71 |
| 1996 | .78 |
| 1997 | 1.00 |
| 1998 | 1.02 |
| 1999 | .79 |
| 2000 | .87 |
| 2001 | .65 |
| 2002 | .62 |
| 2003 | 1.14 |
| 2004 | 1.80 |
| 2005 | 2.29 |
| 2006 | 2.67 |
| 2007 | 2.63 |
| 2008 | 3.41 |
| 2009 | 2.42 |
| 2010 | 2.83 |
| 2011 | 2.78 |
| 2012 | 2.65 |
- ASA signed in 2001
- ALI = 19
Data: Statistics Canada
Source: Office of the Chief Economist
Canada-Vietnam Bilateral Trade

Figure Text Alternative
| Year | Billions of Dollars |
|---|---|
| 1995 | .11 |
| 1996 | .15 |
| 1997 | .20 |
| 1998 | .24 |
| 1999 | .24 |
| 2000 | .27 |
| 2001 | .30 |
| 2002 | .35 |
| 2003 | .42 |
| 2004 | .56 |
| 2005 | .76 |
| 2006 | .86 |
| 2007 | 1.05 |
| 2008 | 1.27 |
| 2009 | 1.27 |
| 2010 | 1.44 |
| 2011 | 1.67 |
| 2012 | 1.99 |
- ASA signed in 2003
- ALI = 13
Data: Statistics Canada
Source: Office of the Chief Economist
Appendix B
Examples of Canada’s bilateral trade with partner countries before and after liberalization of an existing ASA.
Canada-Italy Bilateral Trade

Figure Text Alternative
| Year | Billions of Dollars |
|---|---|
| 1995 | 5.11 |
| 1996 | 4.09 |
| 1997 | 4.61 |
| 1998 | 4.97 |
| 1999 | 5.07 |
| 2000 | 5.41 |
| 2001 | 5.68 |
| 2002 | 5.93 |
| 2003 | 6.35 |
| 2004 | 6.32 |
| 2005 | 6.52 |
| 2006 | 6.81 |
| 2007 | 7.63 |
| 2008 | 7.45 |
| 2009 | 6.22 |
| 2010 | 6.58 |
| 2011 | 7.08 |
| 2012 | 6.93 |
- ASA first signed in 1962
- ALI = 10
- Further liberalization in 2002
- ALI = 27
Data: Statistics Canada
Source: Office of the Chief Economist
Canada-UK Bilateral Trade

Figure Text Alternative
| Year | Billions of Dollars |
|---|---|
| 1995 | 9.37 |
| 1996 | 9.95 |
| 1997 | 10.37 |
| 1998 | 10.73 |
| 1999 | 12.93 |
| 2000 | 18.77 |
| 2001 | 16.78 |
| 2002 | 14.19 |
| 2003 | 15.31 |
| 2004 | 17.40 |
| 2005 | 18.67 |
| 2006 | 21.01 |
| 2007 | 24.26 |
| 2008 | 25.55 |
| 2009 | 21.44 |
| 2010 | 27.08 |
| 2011 | 29.12 |
| 2012 | 27.30 |
- ASA first signed in 1988
- ALI = 10
- Further liberalization in 2006
- ALI = 36
Data: Statistics Canada
Source: Office of the Chief Economist
Footnotes
- Footnote 1
Contact: David.Boileau@international.gc.ca
- Footnote 2
Also commonly known as Air Transport Agreements
- Footnote 3
These results have been shown to hold for developed and upper-middle-income developing countries; some of these gains may not apply to lower-income developing countries.
- Footnote 4
WTO Second Review of Air Transport Services, Methodological Notes and Possible Refinements
- Footnote 5
For the purpose of this study, Canada’s ASA with the U.K., Bermuda, British Virgin Islands, Cayman Islands, and Turks and Caicos islands is counted as 5 separate observations although the 5 countries are all covered under the Canada–UK ASA. Thus Canada’s 76 ASAs in 2008 result in 80 data points.
- Footnote 6
While instrumental variable (IV) techniques could be employed to mitigate this, Baier and Bergstrand (2005) conclude that for cross-sectional data, IV estimation is not a reliable method for assessing the endogeneity bias of the FTA dummy.
- Footnote 7
While fixed effects would greatly enhance the model, they cannot be implemented under the existing data constraints.
- Footnote 8
Commercial services include a wide variety of services including ICT, construction, insurance, financial, management, legal, R&D, architectural, among many others. See Statistics Canada, CANSIM Table 376-0033 for a full breakdown of Commercial Services.
- Footnote 9
The results of the fixed-effects regression were omitted to save space and can be provided upon request.
- Date Modified: