
Archived information
Information identified as archived is provided for reference, research or recordkeeping purposes. It is not subject to the Government of Canada Web Standards and has not been altered or updated since it was archived. Please contact us to request a format other than those available.
Economic Impact of Canada’s Potential Participation in the Trans-Pacific Partnership Agreement
Office of the Chief Economist
1. Introduction
The Trans-Pacific Partnership Agreement (TPP) is the most significant regional trade agreement that Canada has negotiated since the North American Free Trade Agreement (NAFTA) concluded nearly two decades ago. The twelve countries in the TPP form one of the largest trade areas in the world, accounting for nearly 40 percent of global Gross Domestic Products (GDP). For Canada, the TPP countries as a group would be Canada’s largest trading partner, with more than 70 percent of Canada’s trade and investment flowing through the TPP region. Three of Canada’s top 5 trading partners are located in the TPP area (the US, Mexico and Japan). Moreover, the TPP region includes many partners in the dynamic Asia-pacific region, a region which, for several decades, has been the driving force of global economic growth.
Canada already has free trade agreements with several TPP members including the US and Mexico under the NAFTA, as well as Chile and Peru under the Canada-Chile and Canada-Peru FTAs. The TPP Agreement establishes new FTAs with seven Asian-Pacific countries—Australia, Brunei Darussalam, Japan, Malaysia, New Zealand, Singapore, and Vietnam. Canada’s bilateral trade with these seven partners, including both goods and services, is substantial, at approximately $50 billion annually, and greater than Canada’s current trade with its third largest trading partner—Mexico. The bulk of Canada’s trade with these members is accounted for by trade with Japan—the third largest economy in the world.
This study assesses the potential economic impact of the TPP Agreement on Canada and other members in terms of income gains and new trade and investment opportunities based on the final negotiated outcomes of the TPP Agreement, which was concluded in Atlanta, GA in October 2015. It highlights the projected economic impact that Canada faces if it chooses to be a party to the Agreement, as well as the potential economic impact if Canada opts out of the Agreement, and the 11 other TPP countries are part of the Agreement.
The assessment was carried out using a dynamic computable general equilibrium model to address several liberalization measures under the TPP Agreement: tariff reduction or tariff elimination; services trade and investment liberalization; the establishment of TPP rules of origin in the automotive and textile sectors; and market access under Canada’s supply-management regime.
2. Benefits and Costs of the TPP Agreement
Joining the TPP would provide a net advantage to Canada resulting from increased market access and greater regional economic integration with Asia-Pacific countries. Should Canada choose to be a party to the TPP Agreement, this is projected to boost Canada’s GDP by a permanent 0.127 percent above baseline performance, generating GDP gains of $4.3 billion (US$3.3 billion)Note de bas de page 1 in the longer term (by 2040).
Several factors shape Canada’s overall economic gains under the TPP Agreement:
Among the TPP’s central benefits to Canada is a guarantee of preferential market access to the seven new FTA partner countries. These new partner countries jointly represent new trade opportunities for Canadian exporters, as the Agreement puts Canada in an advantaged position relative to countries that do not have FTAs with these trading partners, and ensures a level playing field with respect to other TPP competitors in these markets.
Canada has overall lower levels of tariff protection than most of its TPP partner countries.Footnote 2 Hence, holding other conditions constant, liberalization under the TPP should provide a net advantage for Canada. The TPP Agreement would provide Canadian exports with tariff savings in the seven new FTA partner countries of about $428 million per year, with the majority of savings coming from Japan, Vietnam, and Australia.
As a result of liberalization, Canadian exports to the new FTA countries would increase by US$2.2 billion. The most significant new export opportunities exist in Japan, where Canadian exports are expected to increase by US$1.1 billion with exports of pork, beef, and wood products leading the way. Canada is also expected to see an increase in exports to Australia, Vietnam, and Malaysia. The majority of these export gains come from new opportunities for machinery and equipment and transport equipment exports to Australia and Malaysia, as well as exports of food and automotive products to Vietnam.
Imports from the new FTA partner countries would also increase by US$3.6 billion, led by automotive products from Japan and labour-intensive products such as textile and apparel products from Vietnam. However, the increase in imports of automotive products from Japan under the TPP Agreement would have little effect on Canadian automotive production as the increased imports would be offset by a decline in imports from NAFTA countries due to an erosion of NAFTA preferences in Canada.
Canada’s economic gains also depend on the expected implications for Canada’s trade with its largest trading partner—the US—under the TPP Agreement. There are three critical issues that would potentially influence Canada’s existing economic ties with the US under the TPP Agreement:
NAFTA Preferences. Canada already has preferential market access to the US and Mexico under NAFTA. Liberalization of the US and Mexican markets for other TPP members would erode the preferences that Canada currently enjoys under the NAFTA, resulting in a displacement of Canada’s exports to the US and Mexico. The erosion of Canada’s preferences in the US market would be partially offset by newly created preferences in the new FTA countries under the TPP Agreement; however, due to the size and importance of the US market for Canada’s trade, gains from new FTA members might not be significant enough to offset the losses in the US market. The US’ NAFTA-plus commitments under the TPP (i.e., in sugar and services) help to offset these losses.
Similarly, liberalization of Canada’s trade with new FTA partners under the TPP would displace US and Mexican exports to Canada. As a result, Canada’s bilateral trade with existing FTA partner countries is expected to decline under the TPP Agreement. Net Canadian exports to the existing FTA partner countries would drop by US$1.5 billion, largely due to an erosion of NAFTA preferences in the US and Mexico, while imports from these partner countries also decline by US$4.3 billion.
The sector that will be affected most by the erosion of NAFTA preferences is the automotive sector. With more than 80 percent of Canadian automotive production exported to the US, Canadian automotive production will experience a decline. These losses will occur regardless of whether or not Canada is a party to the TPP. Overall, Canadian exports of automotive products to the US are projected to decline by US$3.6 billion, or a 4.7 percent decline in total Canadian automotive product exports to the US.
NAFTA Rules. In order to be eligible for tariff preferences under a regional trade agreement, goods need to satisfy the applicable rules of origin, which set out how much production must be undertaken in a region in order for a good to be considered “originating”. This is to ensure that the preferential tariff treatment accrues to member countries only. Under NAFTA, the rules of origin threshold for preferential treatment for assembled vehicles is 62.5 percent, while under the TPP the threshold is 45 percent.
This means that, under the TPP, automakers have the possibility to source a greater proportion of auto parts from countries outside of the Agreement than is currently the case under NAFTA. The ability to source parts to a moderately greater extent from non-TPP countries under TPP rules is expected to translate into efficiency gains (i.e. costs savings) for Canadian automotive producers, but, on balance, would result in losses of approximately 2 percent in both production and investment in the automotive industry as a whole. This is primarily driven by reduced US demand for Canadian automotive parts as US automotive producers are able to source more parts from non-TPP members, thereby displacing Canadian exports to the US.
New Commitments. Relative to NAFTA, US commitments under the TPP for sugar and services will provide new opportunities beyond NAFTA to expand Canadian exports to the US market. A key sector benefiting from the new US commitments is professional services, and overall Canadian services exports to the US are expected to increase by US$2.3 billion. Similarly, exports of sugar products would increase by US$44 million.
3. Costs of not joining TPP
According to our modelling results, should Canada choose to remain outside the TPP Agreement, and all other current TPP members are parties to it, this is projected to lead to GDP losses of $5.3 billion (US$ 4.2 billion).
First, Canadian exporters would lose out on opportunities to benefit from enhanced market access to the seven new FTA partner countries under the TPP. This would put Canada in a disadvantaged position relative to other TPP competitors in these markets. In particular, the cost of losing export opportunities for agricultural products to Japan would be substantial. In 2015, Canada was second only to the US as a supplier of pork products to the Japanese market, and was the third most important supplier of beef products to Japan, behind Australia and the US. If Canada opts to remain outside the TPP Agreement, and the US and Australia are part of it, Canada would not only lose its opportunity to further expand its pork and beef exports to Japan, but would also lose market shares to Australia and the US. In this scenario, Canadian beef exports to Japan are projected to fall by more than 66 percent, and pork exports to Japan would drop by 13 percent.
Second, there would be an erosion of Canada’s NAFTA preferences in the US and Mexican markets. This erosion will occur regardless of whether or not Canada chooses to be a party to the TPP Agreement.
Third, should Canada opt to be outside of the TPP, while the US and Mexico are part of it, production and investment losses in the Canadian automotive sector would be even greater. This is because vehicle producers in Canada exporting to their main market in the US would need to meet NAFTA’s 62.5 percent rule of origin, comprised of US, Canadian and Mexican content, while automotive producers in the US and Mexico would only need to meet a 45-percent content threshold, made up of input from all TPP countries. Under this scenario, there would be a disincentive for US automotive producers to source from Canadian auto parts suppliers, as this could jeopardize their ability to satisfy the TPP rules of origin. This may also affect Canada’s ability to retain existing auto production capacity, and its ability to attract new investment in Canada. Under this scenario, Canadian automotive production and investment would both decline by 4 percent.
4. Conclusions
Economic analysis conducted by the Office of the Chief Economist at Global Affairs Canada suggests that choosing to join the TPP Agreement would generate long-term GDP gains for Canada of $4.3 billion (US$3.3 billion). These projected gains are driven primarily by preferential access to the TPP markets with which Canada does not already have an FTA. On the other hand, if Canada chooses not to be a party to the TPP Agreement, while all other 11 TPP members are part of it, resulting in GDP losses would total an estimated $5.3 billion (US$ 4.2 billion). This is the result of anticipated preference erosion in existing FTA markets, particularly the US and Mexico, which would occur regardless of whether Canada were a party to the Agreement, and losses that, in the alternative, would be offset by gains flowing from preferential access to other TPP countries.
Technical Background
1. The Modelling and Data Frameworks
The economic impact assessment of the TPP Agreement is based on simulations with a dynamic computable general equilibrium (CGE) model of global trade. This model follows the structure of the Global Trade Analysis Project (GTAP) model developed and supported by Purdue University.Footnote 3 The GTAP model and other versions of the GTAP model family are used widely by many governments, academics, and research institutes around the world to conduct assessments of potential economic impacts of trade liberalization initiatives.
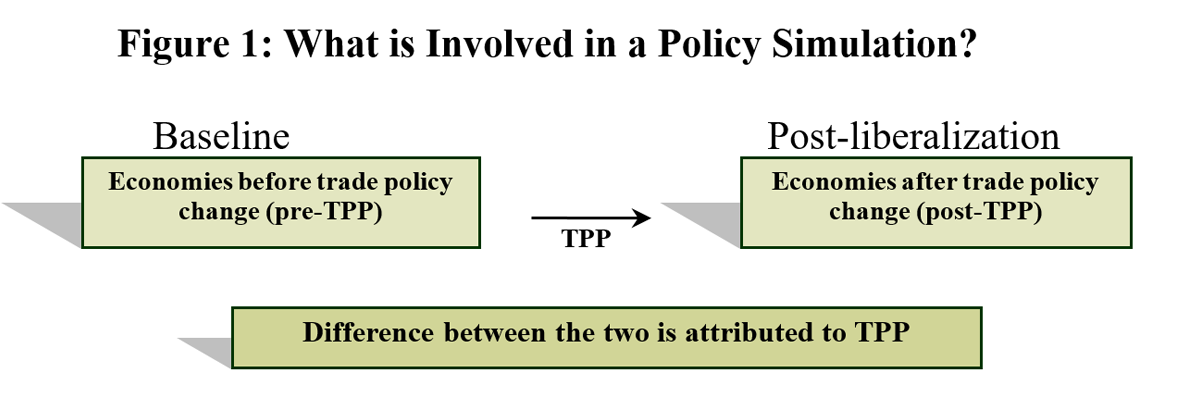
To simulate the economic impact of the TPP Agreement, this study compares the economic performance of all TPP members between a baseline scenario (prior to implementation of the TPP) and a post-liberalization scenario (following implementation of the TPP). The baseline scenario was developed to simulate the evolution of the global economy to 2040 in the absence of the TPP Agreement, based on the projected macroeconomic benchmarks and demographic changes provided by the International Monetary Fund and other international organizations. The baseline scenario incorporates the existing tariff schedules under most-favoured-nation (MFN) treatment along with all bilateral free trade agreements among TPP members as well as any unilateral commitments made by members over the past decades. This tariff updating is important because any failure to take into account the existing commitments could significantly inflate the potential gains from the TPP. The post-liberalization scenario models the impacts of the TPP on Canada and the other TPP members, as well as on non-TPP members. The net effect of the Agreement can thus be quantified as the difference between the baseline and post-liberalization scenario expressed in terms of changes in GDP, exports, and imports. This approach ensures that all other macroeconomic forces impacting on the economy such as macroeconomic fluctuations, employment changes, exchange rate shifts, and technological developments stay the same for both baseline and the post-liberalization scenario, thus isolating the effects of the TPP.
Sources: Office of the Chief Economist, Global Affairs Canada
Text Vesion
Figure 1: What is Involved in a Policy Simulation?
Baseline
Economies before trade policy change (pre-TPP)
TPP
Post-liberalization
Economies after trade policy change (post-TPP)
Difference between the two is attributed to TPP
To determine the economic consequences of Canada either choosing to participate in the TPP Agreement or not, this study considers two post-liberalization scenarios:
- Canada is party to the TPP Agreement; and
- Canada is not party to the TPP Agreement, while the other 11 TPP members are part of the Agreement.
The data used for this modelling exercise is based on the GTAP database version 9, which benchmarks all bilateral trade flows, trade protection and domestic support to 2011. However, to better reflect the present day environment, tariff data were updated to reflect current levels of protection in all TPP members. This was done because, since 2011, there have been many bilateral FTA arrangements concluded and implemented among TPP members, such as the Japan-Australia FTA, as well as certain unilateral liberalization initiatives undertaken by some TPP members, including Canada. Thus, by contemporizing tariff protection among TPP members since 2011, we are able to exclude their effects from those arising from the TPP.
For the purpose of this study, the global economy is disaggregated into 57 sectors and 19 regions/economies (See Table 1). In addition to the 12 TPP countries, China, Indonesia, South Korea, Taiwan, Thailand, and the European Union (EU) are separately identified, along with an aggregation for the rest of the world.
Finally, as a note of caution, the modelling results should be considered in the context of both the advantages and limitations of the CGE model being used. The CGE model can reflect only the expansion of trade in products already traded in a given bilateral trading relationship, and cannot predict the creation of trade in new product areas. This limitation is particularly important when the existing trade relationship is fairly narrow. Hence, the assessment can be expected to underestimate the gains from liberalization.
2. Modelling TPP liberalization measures
The TPP Agreement is a 21st century comprehensive trade agreement, encompassing a broader range of trade policy issues than any of Canada’s previous trade agreements. It sets new international standards on issues such as digital trade, intellectual property rights, state-owned enterprises, non-tariff barriers, regulatory coherence, labour and environment. Some, but not all, of these issues can be treated in the model. Thus, in addition to tariff reduction and tariff elimination, this study models the effects of services trade and investment liberalization, the establishment of TPP rules of origin in the automotive and textile sectors, and new TPP market access under Canada’s supply-management regime. Due to the limitation of the model, the study does not include the analysis of the impact of liberalization and enhanced economic cooperation in other areas such as digital trade, intellectual property rights, government procurement, state-owned enterprises, regulatory coherence, labour and environment. As such, there could be some under- or over-estimation of the size of TPP gains for Canada and other TPP members.
Table 1: Data Aggregation (Sectors and Regions/Economies)
| TPP members | Non TPP members | |||
|---|---|---|---|---|
| Australia | Brunei | Canada | China | Indonesia |
| Chile | Japan | Malaysia | South Korea | Taiwan |
| Mexico | New Zealand | Peru | Thailand | EU |
| Singapore | USA | Vietnam | Rest of the world | |
| Agri-food | Manufacturing | Services | ||
|---|---|---|---|---|
| Sources: Office of the Chief Economist, Global Affairs Canada | ||||
| Paddy rice | Wheat | Forestry | Fishing | Electricity |
| Cereal grains | Vegetables, fruit, nuts | Coal | Oil | Gas manufacture and distribution |
| Oil seeds | Sugar cane and beet | Gas | Minerals | Water |
| Plant-based fibers | Crops | Beverages & tobacco | Textiles | Construction |
| Bovine cattle and sheep | Animal products | Wearing apparel | Leather products | Trade |
| Raw milk | Wool, silk-worm cocoons | Wood products | Paper and publishing | Land transport |
| Bovine meat products | Meat products | Petroleum and coal | Chemical, rubber, plastic | Water transport |
| Vegetable oils and fats | Dairy products | Mineral products | Ferrous metals | Air transport |
| Processed rice | Sugar | Metals | Metal products | Communications |
| Food products | Motor vehicles & parts | Transport equipment | Financial services | |
| Electronic equipment | Machinery and equipment | Insurance | ||
| Other manufactures | Business services | |||
| Recreational services | ||||
| Public Administration | ||||
| Dwellings | ||||
Tariff reductions and eliminations with new FTA countries
The TPP tariff commitments comprise more than 100,000 tariff lines and more than 200 pages of tariff-rate quotas (TRQs) commitments for agricultural products. These tariff lines and TRQs were carefully formulated to fit within the GTAP sector framework, and all of these data points were incorporated into our assessment.
The analysis of TPP tariff commitments in this study is focused on the seven new FTA countries which currently do not have FTAs with Canada, as the bulk of new tariff elimination or tariff reductions are concentrated in these countries. The commitments by the new FTA countries represent Canada’s central benefits under the TPP Agreement.
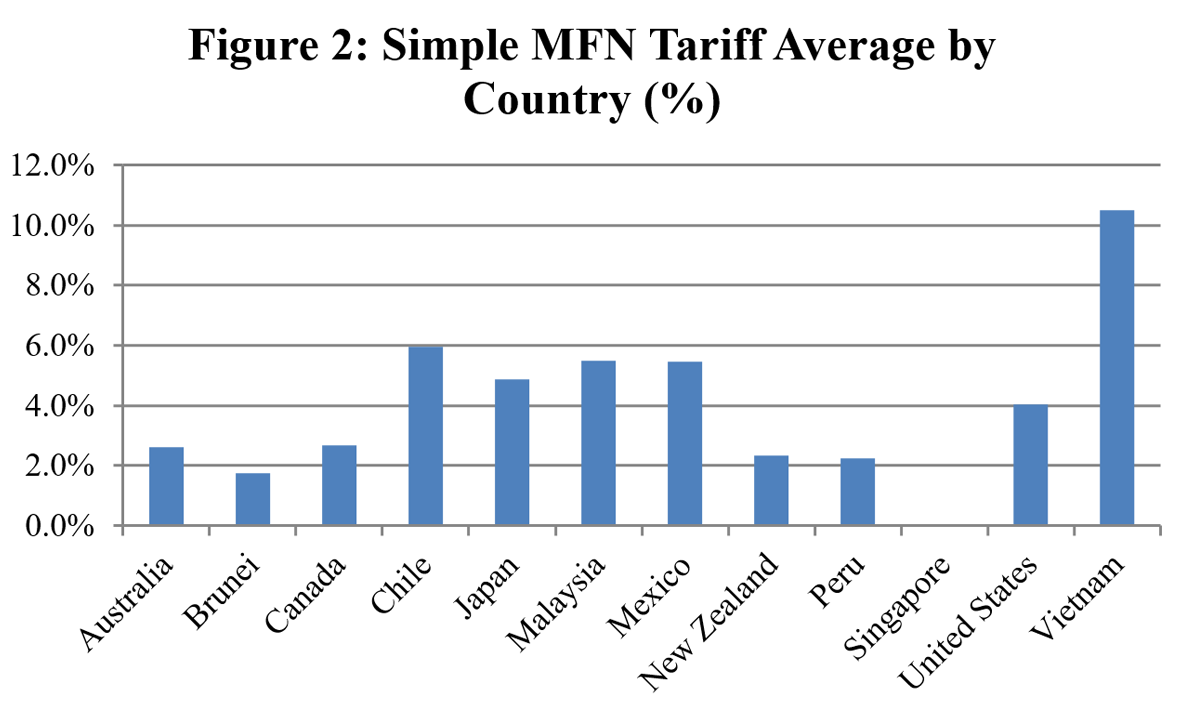
Canada has overall lower levels of tariff protection than most of its TPP partner countries (see Figure 2). Hence, holding other conditions constant, liberalization under the TPP should provide a net advantage for Canada. While tariffs are already low on average for most TPP countries, there is still considerable room for liberalization for Canada’s trade with the seven new FTA countries and for liberalization of some sensitive agricultural products in all TPP countries. For instance, Vietnam’s simple averaged applied tariff is 10.6 percent, and Japan’s tariffs on fresh/chilled and frozen beef are 38.5 percent.
Sources: World Trade Organization.
Text Vesion
Figure 2: Simple MFN Tariff Average by Country (%)
- Australia 2.6%
- Brunei 1.7%
- Canada 2.7%
- Chile 6.0%
- Japan 4.9%
- Malaysia 5.5%
- Mexico 5.5%
- New Zealand 2.4%
- Peru 2.2%
- Singapore 0.0%
- United States 4.0%
- Vietnam 10.5%
Liberalization of barriers to trade results in a loss of state revenues, which are transferred to consumers and producers but, more importantly, reduces economic inefficiency (deadweight losses) resulting from market distortion, giving rise to greater economic gains. For Canadian exports that benefit from enhanced market access to the new seven FTA partner markets, the TPP Agreement would provide estimated tariff savings of $428 million per year with bulk of the savings coming from exports to Japan ($338 million), Australia ($47 million), and Vietnam ($25 million) (See Figure 3). These figures are an estimate of tariff savings accruing to importers of Canadian exports as a result of the TPP. This estimate was calculated by applying TPP tariff outcomes (on the basis of full implementation of the Agreement) to current Canadian trade. This methodology does not take into account the dynamic effect, i.e., the expected increase in exports over time as a result of improved market access, and therefore represents a conservative estimate.
These tariff savings give Canadian exports an extra cost advantage relative to those that are not party to the TPP Agreement, and the TPP tariff outcomes generally provide a level playing field with respect to other TPP competitors in these markets. In particular, Canadian exports to Japan are expected to see $167 million in tariff savings on wheat and barley exports, $51 million of savings on pork products, $21 million of savings on beef, and $32 million of savings on wood products.
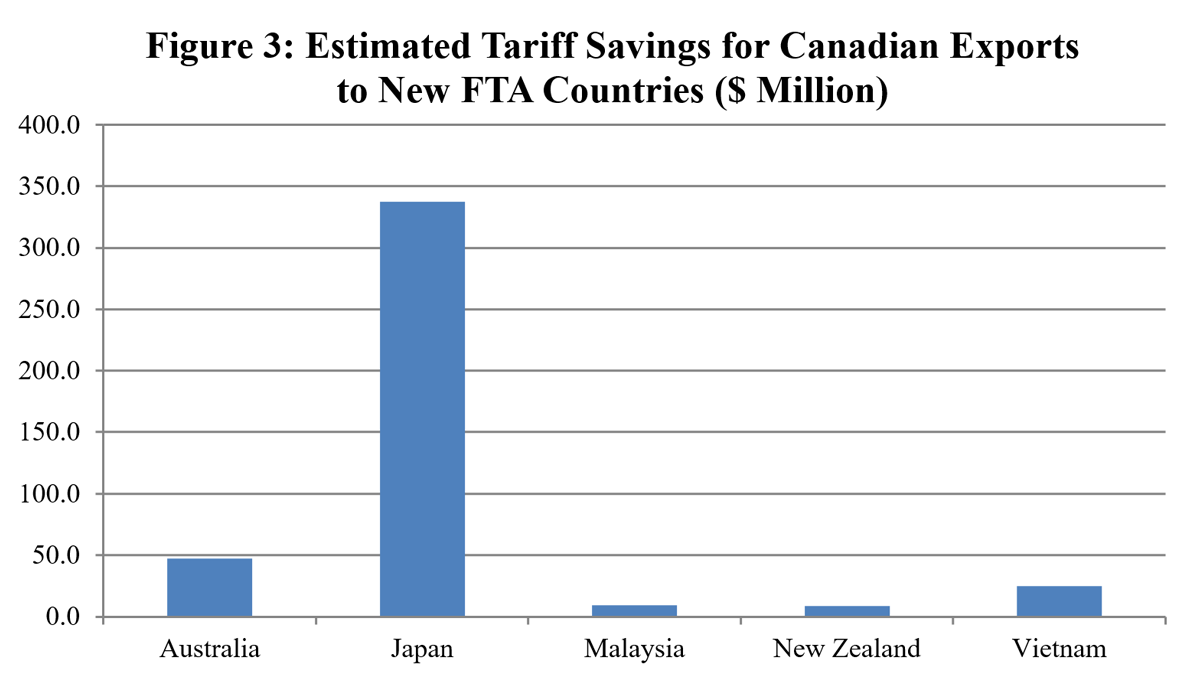
Sources: Global Affairs Canada. Singapore is excluded from the calculation as Singapore is a free-port country, as is Brunei given that projected tariff savings are minimal.
Text Vesion
Figure 3: Estimated Tariff Savings for Canadian Exports to New FTA Countries ($ Million)
- Australia 46.9
- Japan 337.6
- Malaysia 9.4
- New Zealand 8.6
- Vietnam 25.1
Finally, for some countries and some sectors, TPP outcomes could be less “favourable” compared to the existing bilateral tariff preferences under existing FTAs. For these sectors, the best bilateral outcomes were used to replace the TPP outcomes, because in the real business world, businesses are allowed to choose the best tariff treatment available to them to maximize their commercial interest. In other words, for those sectors, we assume that there would be no negative effect from the TPP.
Tariff reductions and eliminations with existing FTA countries
Canada already has the NAFTA free trade agreement with the US and Mexico, as well as FTAs with Chile and Peru. Liberalization in the US and these other existing FTA partners to other TPP members erodes the relative degree of preferences accorded to Canada under present FTAs. This is expected to result in a displacement of Canadian exports to the US and to the other FTA partners. This displacement effect in the US market could be significant due to the size and importance of the US market for Canada’s trade. While the erosion of Canadian preferences in the US market would be partially offset by the newly created preferences in the new FTA countries, it is likely that the gains from new FTA members would not be significant enough to completely offset the losses in the US market. The US’ NAFTA-plus commitments under the TPP (i.e., in sugar and services) help to offset these losses.
Similarly, liberalization of Canada’s trade with other new FTA partners will displace imports from the US and other existing FTA partner countries in Canada. As a result, Canada’s bilateral trade with the NAFTA and existing FTA partners is expected to decline under the TPP Agreement.
Liberalization of services trade and investment
The TPP Agreement takes a broad approach to cross-border trade and investment in services, with services covered unless specifically excluded or listed in a country’s schedule of non-conforming measures (i.e., a negative list approach). Measures include enhanced obligations to secure current and future levels of liberalization in the services sector. Moreover, the Agreement ensures that commitments by TPP members are locked-in based on their current domestic regime and therefore cannot become more restrictive.
This study focuses on evaluating the locking-in, or binding effect, of services commitments. The extent of service commitments is assessed by comparing the actual TPP offers in services against commitments under the WTO General Agreement on Trade in Services (GATS) in 1995, or the best bilateral offers. This comparison provides an assessment on the extent of commitments for each sector by each country in relative terms. To quantify the economy-wide effect of these commitments, we associate these commitments to potential savings in trade and investment costs in services, which reflect the transaction costs involved in international trade and investment in services.
Overall, quantifying the effect of services commitments and market access is much more challenging than is the case for goods. The literature on the measurement of services commitments and their implications for trade and investment cost saving is still evolving. While a comprehensive dataset is available for tariff barriers for goods trade, a similar database on trade and investment costs in services does not exist. Moreover, given the fact that barriers to services trade and investment are typically part and parcel of broader regulatory frameworks governing the delivery of services, both the size of trade and investment costs in services and the extent to which liberalizing measures under the Agreement can reduce these costs have to be measured indirectly through econometric analysis. For this study, the estimates on the size of trade cost in services for TPP countries are drawn from the existing econometric workFootnote 4.
Economic gains of tariff elimination or reductions are modelled as allocative efficiency gains stemming from reallocation of productive resources across sectors caused by changes in tariffs. In contrast, modelling of economic gains of cost savings in services trade and investment is less straightforward. In the context of the TPP Agreement, the gains from these cost savings are interpreted as enhancements to regulatory certainty and transparency, which contribute directly to productive efficiency gains, i.e., a direct productivity enhancement. In other words, economic gains in services are modelled as direct productive efficiency gains resulting from replacing the previously-scheduled obligations with the new TPP obligations.
Rules of origin
In a regional trade agreement like the TPP, rules of origin ensure that a certain share of the production of a finished product is performed within the free trade area. Only products that meet the rules of origin requirement are considered as “originating” within the free trade area and, therefore, are eligible for preferential tariff treatment under the free trade agreement. The aim of this policy measure is to provide an incentive to local producers to source parts and labour from within the free trade area, thereby ensuring that both production and the benefits of the preferential tariff treatment accrue primarily to member countries.
Under the TPP Agreement, two rules of origin issues have been examined:
- Automotive Products: The rules of origin required for receiving NAFTA preferential treatment for assembled vehicles is 62.5 percent, while under the TPP this requirement is 45 percent for assembled vehicles, and 30-45 percent for certain categories of auto parts. Some stakeholders have claimed that the lower originating content threshold under the TPP may lead North American automotive makers to source from more efficient sources, including from non-TPP countries. To capture this effect, we assume that both Canada and Mexico double their current levels of imports of automotive parts from non-TPP sources (from 12 to 24 percent of total parts imports from TPP countries)Footnote 5, and that the US increases its imports of automotive parts from non-TPP countries by 50 percent (from 40 to 60 percent of total parts imports from TPP countries), as the US already sources a significantly higher proportion of auto parts from non-TPP countries relative to Canada and Mexico. This would translate into efficiency gains (i.e. costs savings) for Canadian automotive producers, but, on balance, will result in losses of production and investment in the Canadian automotive and automotive parts industry.
The TPP Agreement comprises a broader membership than Canada’s previous FTAs, including the NAFTA, which means a broader region from which to “accumulate” (or gather) originating materials. This widens the definition of originating products and encourages greater economic integration among member countries. It allows NAFTA countries, including Canada, to expand sourcing partnerships beyond NAFTA members to include other (non-NAFTA) TPP members. This could potentially make Canadian automotive parts more attractive in the TPP region as well. To capture this effect, we assume 2 percent efficiency gainsFootnote 6resulting from increased imports of automotive parts from new FTA TPP partner countries such as Japan, Malaysia, and Vietnam, but we assume no additional cumulative gains among NAFTA countries, as NAFTA countries already operate under a regional trade agreement.
Textiles and Apparel. The TPP Agreement includes “yarn forward” rules of origin for textile and apparel products. These rules require that production of specified yarns and fabrics used in textile and apparel production, as well as associated cutting and sewing, must occur in the TPP member countries in order for a product to be eligible for preferential treatment under the Agreement. This may disrupt Vietnam’s existing supply chains with non-TPP countries such as China and the EU as Vietnam imports a large amount of yarns and fabrics from these countries. However, it will likely encourage Vietnam to increase its domestic yarn and fabric production, or shift its supply chains to TPP members (e.g., by importing greater quantities of yarn and/or fabric from TPP countries). A notable flexibility to the “yarn-forward” rule is the “short supply” list, which allows the use of certain yarns and fabrics that are not produced in commercial quantities in TPP countries to be sourced from non-members, somewhat mitigating the impact of the “yarn forward” rules of origin. To reflect the TPP’s “yarn forward” rules and address the expected implications for Vietnam’s supply chains, we assume a hypothetical increase in Vietnam’s tariffs on textile products from non-TPP countries, to the extent that imports from non-TPP countries are reduced by 50 percent. While the increase in Vietnam’s textile tariffs would have negative consequences for Vietnam’s economic welfare, the losses in economic welfare are offset by an increase in foreign direct investment in this sector.
This newly-created investment incentive of the “yarn forward” rules of origin is expected to provide an additional boost to Vietnam’s economic development. This results in a net effect of “yarn forward” rules of origin that is welfare-improving, in the sense that Vietnam will continue to engage the most efficient producers in the world through direct investment in Vietnam.
New TPP market access in Canada’s supply-managed products
Canada has offered limited new access for supply-managed dairy, poultry and egg s products in the form of tariff rate quotas above existing commitment levels in the WTO and NAFTA. This access amounts to a low percentage of Canada’s dairy, poultry and egg production. In the case of dairy products, with the majority of the additional milk and butter import quotas directed to value-added processing, and assuming that the current Canadian supply management system will be strictly preserved (i.e., the market prices stay the same as they were before the implementation of the TPP Agreement), the net effect of the increase in dairy import quotas would be neutral. There could be some losses in Canadian dairy production, and subsequently losses in economic welfare from producers’ perspective, but these losses could be offset by gains elsewhere in the sector benefiting from imported dairy products.
3. Benefits and Costs of Joining the TPP Agreement
Joining the TPP would provide a net advantage to Canada resulting from increased market access and greater regional economic integration with Asia-Pacific countries. The TPP Agreement is projected to boost Canada’s GDP by a permanent 0.127 percent above baseline, generating GDP gains of $4.3 billion (US$3.3 billion) in the longer term (by 2040).
New Trade Opportunities with New FTA Partner Countries
Canadian exports to new FTA partner countries under the TPP would expand by US$2.2 billion, benefiting from newly-created preferences in the countries with which Canada currently does not already have FTAs, in particular Japan, Australia, Vietnam, and Malaysia. Among these markets, the most noticeable gain is with Japan. The sectors that show the greatest potential for increases in Canadian exports to Japan include pork, beef, and wood products. Canada is also expected to see increased exports to Australia, Vietnam, and Malaysia. The majority of the gains in these markets are for machinery and equipment to Australia and Malaysia, as well as food and automotive products to Vietnam.
Imports from the new FTA partner countries would also rise by US$3.6 billion. Increased imports of automotive and chemical products from Japan and labour-intensive products such as textile, apparel and leather products from Vietnam lead the overall increases in imports from new FTA countries.
Trade with Existing FTA Partner Countries
The export gains in the new FTA partner countries will be partially offset by a decline in exports to existing FTA partners of US$1.5 billion, largely due to an erosion of NAFTA preferences in the US and Mexico
Benefiting from the new US commitments in professional services and land transport services, Canadian exports of these services to the US are expected to increase by US$2.3 billion and US$275 million, respectively. In other sectors where preference erosions are not expected, Canada is expected to see positive export gains in the US market driven by TPP-induced income growth in the US. For instance, Canadian exports of energy-related products and some agricultural products to the US are projected to grow even though there are no new additional market commitments from the US in these sectors. Canadian exports of sugar products could increase by US$43.7 million, due to new US market access concessions in the sector.
Other than the sectors above, Canada’s exports to NAFTA partner countries, particularly to the US market, are expected to decline reflecting an erosion of Canada’s NAFTA preferences, with automotive products bearing the most noticeable effect. With more than 80 percent of Canadian auto production shipped to the US, the eventual removal of US tariffs in the auto sector and expected increased US imports of Japanese automotive products would have a negative repercussion on Canadian automotive exports to the US. This would happen over time as US auto tariffs will remain unchanged for 15 years and only be fully eliminated after 25 years. These losses will occur regardless of whether or not Canada is a party to the TPP. Further, the increased sourcing of automotive parts from non-TPP countries by the US automotive producers that may be possible under the TPP rules of origin could further dampen Canada’s exports of automotive products to the US. As a result, Canadian production of automotive products and investment is expected to decline by 2 percent as more auto parts sourced from non-TPP members by US automotive producers displace Canadian exports to the US.
Similarly, liberalization of Canada’s trade with other new FTA partners will displace the US and other existing FTA partner countries in Canadian imports. Canada’s imports from existing FTA partner countries are expected to decline by US$4.3 billion, led by falling imports of automotive products from the NAFTA countries. At the same time, the TPP rules of origin may also allow Canada to increase sourcing of automotive parts from non-TPP countries by an estimated US$1.8 billion. The increased imports from non-TPP countries, along with increased Japanese imports of automotive products partially offset the decline in imports of automotive products from NAFTA countries, resulting in a net decrease in imports of automotive products from the world of US$1.1 billion. In other words, increased imports of automotive products from Japan and from non-TPP sources under the TPP rules would have little effect on Canadian automotive production as these increases would be offset by declines in imports from NAFTA countries due to an erosion of NAFTA preferences in Canada.
Further, the broader membership under the TPP allows NAFTA countries, including Canada, to expand their sourcing partnerships beyond NAFTA members to other TPP members. This is expected to encourage greater economic integration between TPP member countries and could affect the sourcing decisions of North American automotive producers. However, overall, we found that the macroeconomic effect of this liberalization measure on the overall economy is limited.
New TPP market access in Canada’s supply-managed products
Canada has offered increased access for supply-managed dairy, poultry and eggs products in the form of tariff rate quotas above existing commitment levels in the WTO and NAFTA. In the case of dairy products, assuming that the current Canadian supply management system is strictly preserved, i.e., the market prices would stay the same as they were before the implementation of the TPP Agreement, the net effect of an increase in dairy import quotas on the Canadian dairy sector would be neutral. Canadian imports of dairy products from TPP countries, mainly from the US, would increase by US$500 million. After deducting the displacing effect for imports from the rest of the world, mainly dairy imports from the EU, the net increase in imports of dairy products from the world would be approximately US$358 million.
4. Costs of not joining TPP
If Canada chooses to remain outside the TPP Agreement, this would present several risks to Canada’s economic well-being, which could lead to total GDP losses of approximately $5.3 billion (US$ 4.2 billion).
First of all, Canadian exporters would lose on opportunities to benefit from enhanced market access to seven potential new FTA partner countries. This would put Canada in a disadvantaged position relative to other TPP members in those markets. In particular, the cost of losing export opportunities in agricultural products to Japan would be substantial. Should Canada remain outside the TPP, Canadian beef exports to Japan could fall by more than 66 percent and pork exports could drop by 13 percent, and Canada would lose share in Japanese import markets.
Additionally, the erosion of Canada’s NAFTA preferences in the US and Mexican markets, which will occur regardless of whether or not Canada chooses to be a party to the TPP.
Finally, should Canada opt not to be part of the TPP, while the US and Mexico are part of it, production and investment losses in the Canadian automotive sector would be even greater. This is because vehicle producers in Canada exporting to their main market in the US would need to meet a 62.5-percent rule of origin, comprised of US, Canadian and Mexican content, while producers in the US and Mexico would only need to meet a 45-percent content threshold, made up of inputs from all TPP countries. Under this scenario, there would be a disincentive for US automotive producers to source from Canadian suppliers, as this could jeopardize their ability to satisfy the TPP rules of origin and benefit from preferential market access. This would also likely affect Canada’s ability to retain existing auto production capacity, and the ability to attract new automotive investment in Canada. Under this scenario, Canadian automotive production and investment are both expected to decline by 4 percent.
Footnotes
- Footnote 1
The conversion into the Canadian dollar is based on the annual average exchange rate in 2015, which is 1.2787 per US dollar according to Bank of Canada.
- Footnote 2
Source: World Trade Organization.
- Footnote 3
- Footnote 4
J. Francois, B. Hoekman and J. Woerz (2007) “Does Gravity Apply to Non-Tangibles: Gravity Estimates of Trade and FDI Openness in Services.”
- Footnote 5
The calculation of share of NAFTA countries’ auto parts imports from non-TPP countries relative to imports from TPP countries is based on HS codes from 8706 to 8708. Non-TPP countries include Thailand, Taiwan, China and Indonesia.
- Footnote 6
The calculation of share of NAFTA countries’ auto parts imports from non-TPP countries relative to imports from TPP countries is based on HS codes from 8706 to 8708. Non-TPP countries include Thailand, Taiwan, China and Indonesia.
If you have questions, please contact us: TPP-PTP.consultations@international.gc.ca
- Date Modified: