
Quarterly economic and trade report – Q1 2023
Highlights
- Global economic growth accelerated to 3.4% in the first quarter, up from 1.4% in Q4 2022. The International Monetary Fund forecasts global GDP growth to slow to 2.8% in 2023, dragged down by advanced economies while emerging markets are expected to maintain 3.9% growth.
- After stagnating in the last quarter of 2022, Canada’s real GDP growth accelerated to 3.1% in Q1, mainly supported by net trade and household spending.
- Economic growth was widespread in Canada with 16 out of 20 industries posting positive performance in Q1, especially in services-producing industries, while goods-producing industries only edged up 0.1% on average.
- On the trade front, Canada’s total exports declined for the third consecutive quarter, mainly due to goods exports contracting by 0.5%, while services exports posted modest growth of 1.1%.
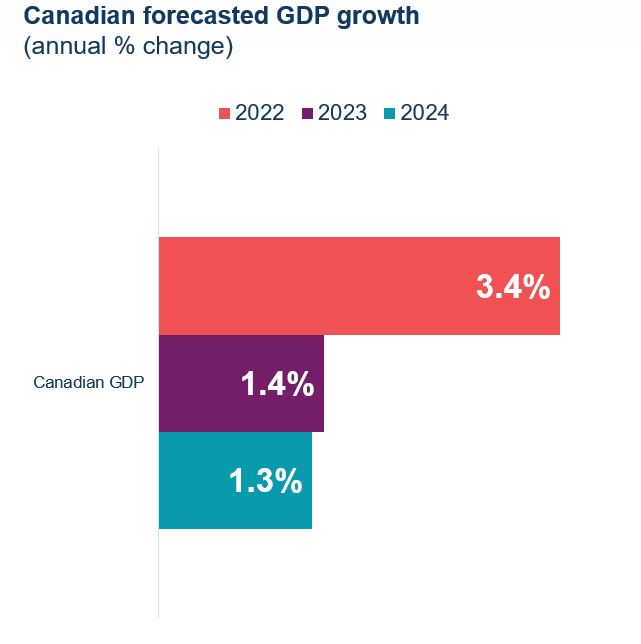
- The Bank of Canada expects the Canadian economy to expand by 1.4% in 2023, down 2 percentage points from the year prior, due to high inflation and tight financial conditions.
Table 1: Highlights – First Quarter 2023
| % change, Q1 2023 vs Q4 2022 | % change, YTD 2023 | |
|---|---|---|
| Global real GDP* | 3.4 | 2.3 |
| Global merchandise trade volume | -0.9 | -1.2 |
| Canadian real GDP* | 3.1 | 2.2 |
| Canadian exports (goods & services) | -0.2 | 7.3 |
| Canadian imports (goods & services) | 0.4 | 11.2 |
Notes: *Throughout the report, GDP is quarterly changes at annualized rates.
Source: Oxford Economics, Netherland Bureau for Economic Analysis, Statistics Canada.
Global Economic Growth accelerated at the start of 2023
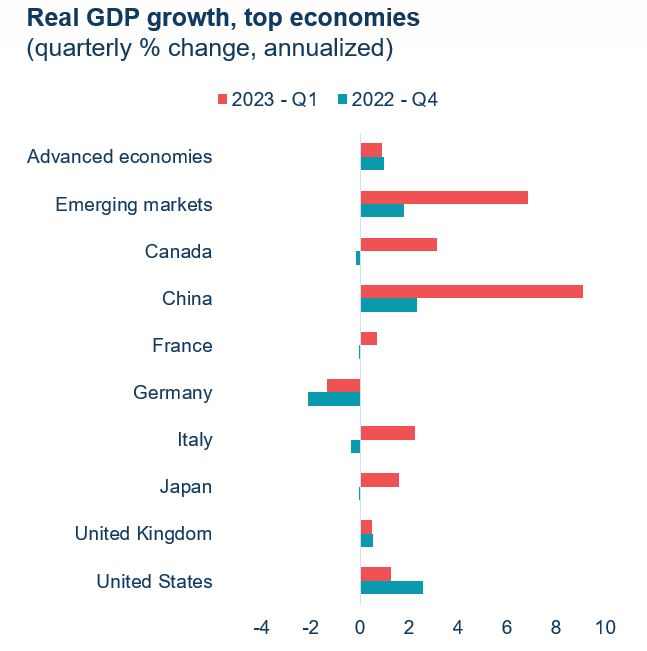
After growing by 1.4% in the last quarter of 2022, global economic growth picked up in the first quarter of 2023, increasing by 3.4%. The expansion was driven by emerging markets, which posted 6.9% growth compared to only 0.9% for advanced economies.
The U.S. economy cooled, rising by only 1.3% in Q1 2023 (from 2.6% in Q4 2022). A large drag from inventories offset solid growth in consumer spending, exports, and government expenditures. Meanwhile, the Euro Area showed significant divergence across the region: Italy and Spain posted robust growth, supported by a strong tourism season. France expanded moderately thanks to net trade and services spending, while Germany was in a technical recession over the winter given the drag from the energy crisis.
China led growth in emerging markets, rising by 9.1% in Q1. Household consumption supported economic activities, but the consumer-led growth is expected to lose momentum as the post-lockdown momentum wanes. Moreover, there is uneven recovery across sectors as China’s services sectors surged, while agriculture, manufacturing and construction sectors softened.
Text version
| Real GDP growth, top economies (quarterly % change, annualized) | 2022 - Q4 | 2023 - Q1 |
|---|---|---|
| Advanced economies | 0.99 | 0.91 |
| Emerging markets | 1.80 | 6.85 |
| Canada | -0.15 | 3.15 |
| China | 2.34 | 9.09 |
| France | -0.06 | 0.68 |
| Germany | -2.13 | -1.33 |
| Italy | -0.38 | 2.26 |
| Japan | -0.05 | 1.58 |
| United Kingdom | 0.52 | 0.50 |
| United States | 2.57 | 1.27 |
Sources: Oxford Economics, Statistics Canada. Seasonally adjusted.
Retrieved on 2023-06-08.
Trade continued to decline while production rebounded
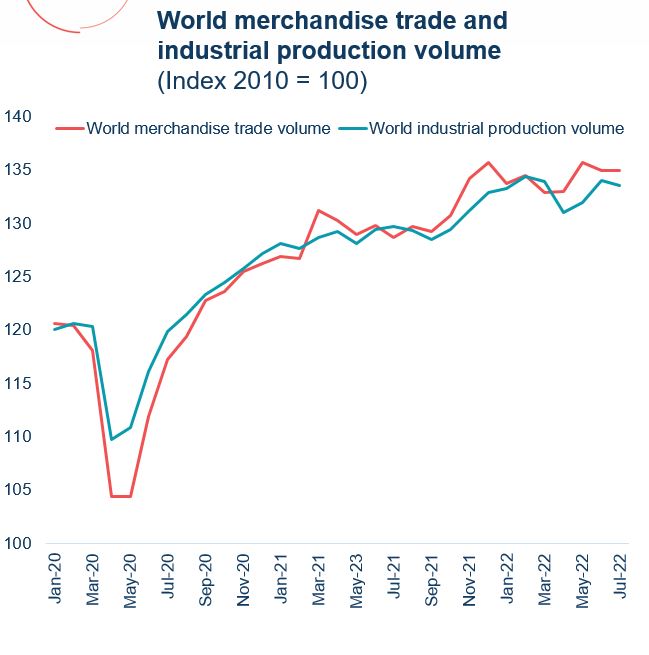
World merchandise trade volumes contracted for a second consecutive quarter in Q1 2023, edging down by 0.9% following a modest decline in the last quarter of 2022. The contraction was mainly due to lower merchandise import volumes (-1.7%), while merchandise export volumes remained virtually unchanged.
Export volumes in advanced economies decreased by 1.4% in Q1, mainly as a result of a significant decline in the United Kingdom (-12.9%). Export volumes from Japan and the Euro Area also contracted. In contrast, export volumes from the U.S. recovered by 2.9% in Q1. Emerging markets witnessed an increase in export volumes, growing by 2.7% in Q1, primarily led by China and emerging markets in Eastern Europe. Import volumes fell in both advanced economies and emerging markets.
After a minor decline in the prior quarter, world industrial production volumes rebounded by 1.1% in Q1 2023. The gains were mainly due to increases in emerging markets (2.6%), especially in China (3.9%), while industrial production volumes for advanced economies declined by 0.5%.
Text version
| World merchandise trade and industrial production volume (Index 2010 = 100) | World merchandise trade volume | World industrial production volume |
|---|---|---|
| Jan-20 | 120.6 | 120.0 |
| Feb-20 | 120.5 | 120.6 |
| Mar-20 | 118.1 | 120.3 |
| Apr-20 | 104.4 | 109.8 |
| May-20 | 104.4 | 110.9 |
| Jun-20 | 111.9 | 116.1 |
| Jul-20 | 117.2 | 119.8 |
| Aug-20 | 119.4 | 121.5 |
| Sep-20 | 122.8 | 123.3 |
| Oct-20 | 123.6 | 124.4 |
| Nov-20 | 125.5 | 125.7 |
| Dec-20 | 126.3 | 127.1 |
| Jan-21 | 126.9 | 128.1 |
| Feb-21 | 126.7 | 127.7 |
| Mar-21 | 131.2 | 128.7 |
| Avr-21 | 130.2 | 129.2 |
| May-23 | 128.9 | 128.1 |
| Jun-21 | 129.8 | 129.4 |
| Jul-21 | 128.7 | 129.7 |
| Aug-21 | 129.7 | 129.3 |
| Sep-21 | 129.2 | 128.4 |
| Oct-21 | 130.8 | 129.5 |
| Nov-21 | 134.2 | 131.2 |
| Dec-21 | 135.7 | 132.8 |
| Jan-22 | 133.8 | 133.3 |
| Feb-22 | 134.5 | 134.4 |
| Mar-22 | 132.9 | 133.9 |
| Apr-22 | 132.9 | 131.0 |
| May-22 | 135.7 | 132.0 |
| Jun-22 | 134.9 | 134.0 |
| Jul-22 | 134.9 | 133.5 |
| Aug-22 | 136.4 | 134.4 |
| Sep-22 | 136.6 | 134.6 |
| Oct-22 | 135.4 | 133.3 |
| Nov-22 | 132.7 | 133.2 |
| Dec-22 | 131.8 | 133.0 |
| Jan-23 | 132.2 | 133.9 |
| Feb-23 | 131.1 | 135.1 |
| Mar-23 | 133.1 | 135.0 |
Source: Netherland Bureau for Economic Analysis, retrieved on 2023-05-29
Growth is expected to slow in advanced economies
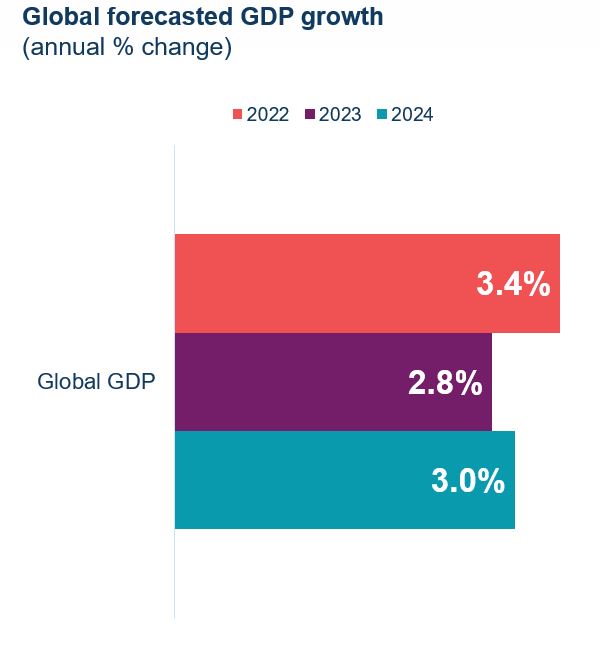
As economies around the world struggle with persistent high inflation, financial sector turmoil, and the ongoing effects of Russia’s invasion, the International Monetary Fund (IMF) projects global GDP growth to slow from 3.4% in 2022 to 2.8% in 2023, eventually stabilizing at 3.0% in 2024. Advanced economies are expected to experience a significant slowdown in growth (1.3% in 2023). In contrast, emerging markets are expected to maintain 3.9% growth.
Amongst advanced economies, U.S. economic growth is expected to decrease from 2.1% in 2022 to 1.6% in 2023 on increasingly tight financial conditions. The ongoing conflict between Russia and Ukraine will continue to have repercussions on Europe's growth, causing a slowdown in the Euro Area to 0.8%. Additionally, the United Kingdom’s economy is expected to shrink by 0.3%.
In emerging markets, growth in emerging Asia is expected to rise, supported by China’s lifting of its zero-COVID policy late last year. China’s economic growth is expected to reach 5.2% in 2023, up 2.2 percentage points from the year prior. However, growth in other large economies in the region such as India, Indonesia, Malaysia, and Vietnam is expected to slow. Similarly, growth in Latin American and the Caribbean and Middle East and Central Asia is expected to decline in 2023.
Text version
| Column1 | 2022 | 2023 | 2024 |
|---|---|---|---|
| Global forecasted GDP growth (annual % change) | 3.4 | 2.8 | 3.0 |
Source: IMF WEO, April 2023, retrieved on 2023-05-23.
Economic Activities picked up in the first quarter for Canada
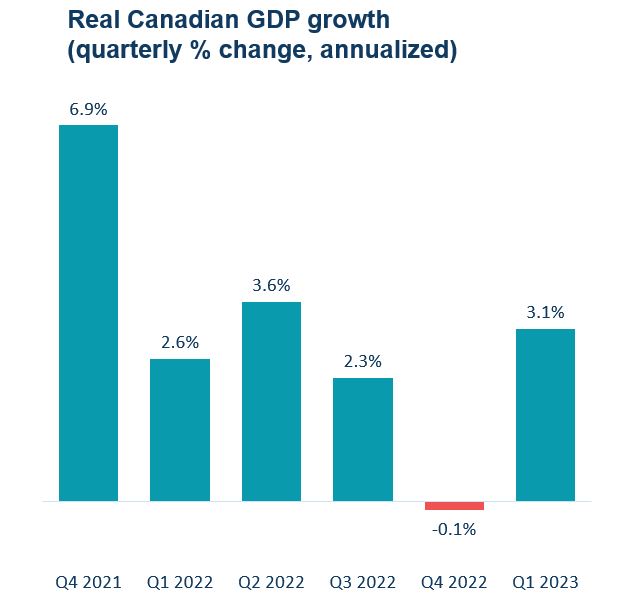
Canada’s real GDP rose 3.1% (annualized) in the first quarter of 2023, after posting almost no change in the previous quarter. Growth in net trade and household spending outweighed slower inventory accumulations as well as declines in housing investment and business investment in machinery and equipment.
Net trade improved in Q1 as growth in exports (2.4%) outpaced imports (0.2%). Moreover, after two-quarters of muted growth, consumption accelerated to 0.9% in Q1 and increased for household spending on both goods and services.
On the other hand, inventory accumulation slowed in the first quarter leading to downward pressure on economic growth. Declines were observed in farm inventories as well as in the stock of durable goods.
Finally, widespread declines in new construction, renovations, and ownership transfer costs drove down housing investment, and business investment in machinery and equipment posted its third consecutive quarterly decline.
Text version
| Q4 2021 | Q1 2022 | Q2 2022 | Q3 2022 | Q4 2022 | Q1 2023 | |
|---|---|---|---|---|---|---|
| GDP growth (%) | 6.9 | 2.6 | 3.6 | 2.3 | -0.1 | 3.1 |
Source: Statistics Canada Table 36-10-0104-01, retrieved on 2023-05-31.
Service-producing industries supported growth in Q1
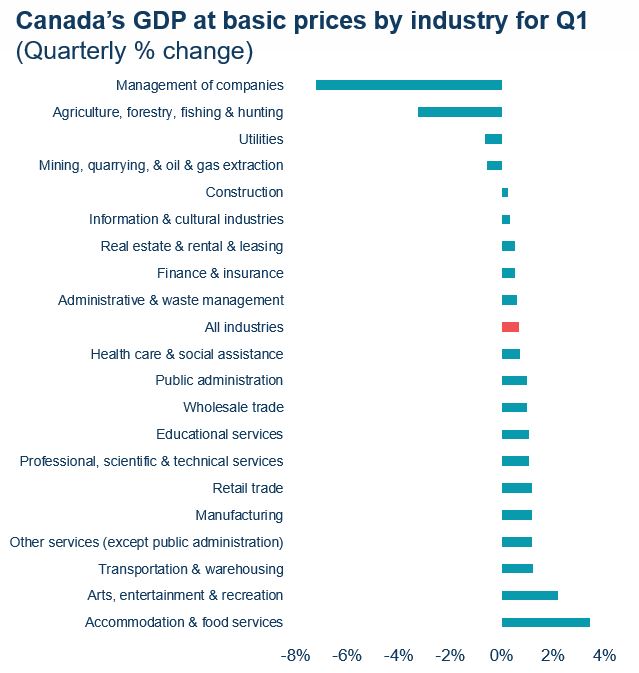
Economic growth was primarily supported by service-producing industries, rising for the 7th consecutive quarter (0.9%), while goods-producing industries only edged up 0.1%. Overall,16 of 20 industries posted gains.
Public sectors (educational services, health care and social assistance, and public administration) were the largest contributors to overall growth for the third consecutive quarter. Other large contributors from service-producing industries included professional, scientific & technical services (mainly computer systems design and related services), accommodation & food services, and real estate & rental & leasing.
The manufacturing industry led the increase in goods-producing industries in the first quarter. Machinery and transportation equipment manufacturing were the main contributors to the sector’s growth, as exports of passenger vehicles rose in the quarter. Construction was the only other goods-producing industry to expand in Q1, supported by a 10th consecutive quarterly increase in engineering and other construction.
Text version
| Quarterly % GDP growth in Q1 | |
|---|---|
| Accommodation & food services | 3.4% |
| Arts, entertainment & recreation | 2.2% |
| Transportation & warehousing | 1.2% |
| Other services (except public administration) | 1.2% |
| Manufacturing | 1.2% |
| Retail trade | 1.2% |
| Professional, scientific & technical services | 1.1% |
| Educational services | 1.1% |
| Wholesale trade | 1.0% |
| Public administration | 1.0% |
| Health care & social assistance | 0.7% |
| All industries | 0.7% |
| Administrative & waste management | 0.6% |
| Finance & insurance | 0.5% |
| Real estate & rental & leasing | 0.5% |
| Information & cultural industries | 0.3% |
| Construction | 0.3% |
| Mining, quarrying, & oil & gas extraction | -0.6% |
| Utilities | -0.7% |
| Agriculture, forestry, fishing & hunting | -3.3% |
| Management of companies | -7.2% |
Source: Statistics Canada Table 36-10-0449-01. Retrieved on 2023-05-31.
Goods exports edged down in Q1 while services exports posted modest growth
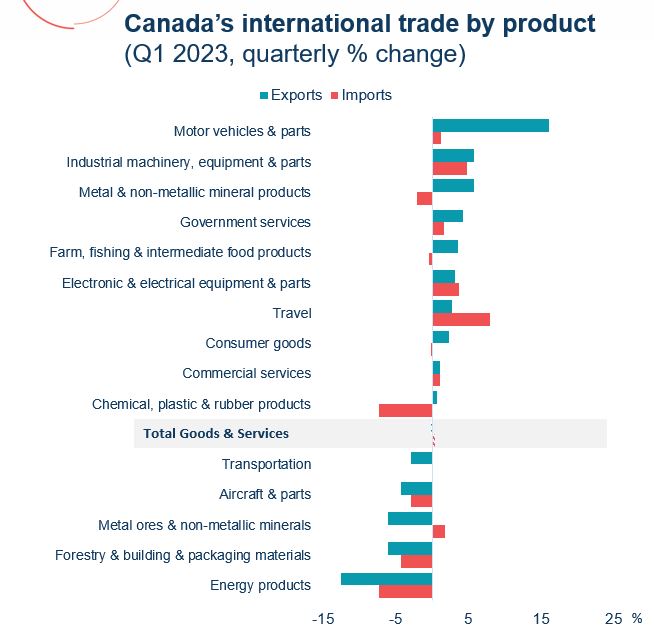
Goods and services exports declined for the third consecutive quarter, edging down by 0.2% in Q1 of 2023. Seven of 11 goods export categories expanded. While strong growth was recorded in exports of motor vehicles and parts, industrial machinery, equipment and parts, and metal and non-metallic mineral products, they were offset by another large contraction in energy exports due to falling prices. On the services front, 3 out of the 4 services categories improved in Q1, with transportation services being the only category that recorded a decline.
Conversely, goods and services imports rose by 0.4% in Q1. Although there were widespread declines in goods imports with contractions in 7 of 11 goods categories, the overall value of goods imports largely held steady in Q1. Contractions in chemical, plastic and rubber products, energy products, and forestry and building and packaging materials were almost entirely offset by gains in industrial machinery, equipment and parts and electronic and electrical equipment and parts. Services imports were up in all four categories.
Text version
| Quarterly % growth in Q1 | Exports | Imports |
|---|---|---|
| Motor vehicles & parts | 16.1 | 1.3 |
| Industrial machinery, equipment & parts | 5.8 | 4.8 |
| Metal & non-metallic mineral products | 5.8 | -2.1 |
| Government services | 4.3 | 1.6 |
| Farm, fishing & intermediate food products | 3.6 | -0.4 |
| Electronic & electrical equipment & parts | 3.2 | 3.7 |
| Travel | 2.8 | 7.9 |
| Consumer goods | 2.4 | 0.0 |
| Commercial services | 1.2 | 1.1 |
| Chemical, plastic & rubber products | 0.7 | -7.3 |
| Total Goods & Services | -0.2 | 0.4 |
| Transportation | -2.8 | 0.1 |
| Aircraft & parts | -4.3 | -2.9 |
| Metal ores & non-metallic minerals | -6.1 | 1.8 |
| Forestry & building & packaging materials | -6.1 | -4.3 |
| Energy products | -12.6 | -7.3 |
Sources: Statistics Canada Table 36-10-0019-01 & Table 36-10-0021-01.
Balance of payments basis, seasonally adjusted. Retrieved on 2023-06-08.
Lower exports to the EU and the U.S. in Q1
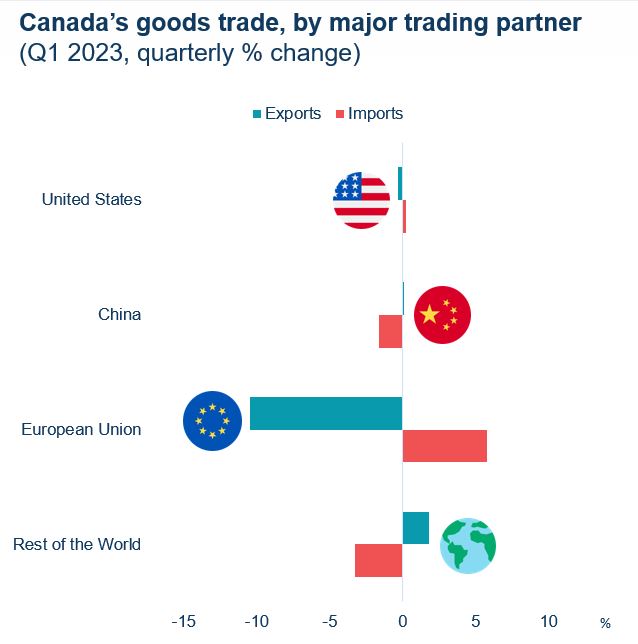
In the first quarter of 2023, Canadian goods exports and imports were down by 0.5% and 0.1%, respectively.
Exports to the European Union declined (-10.5%) for the first time since Q2 2021, with significant contractions in exports to Italy and Spain due to tighter financial conditions and weaker demand. Goods exports to the U.S. fell for the third consecutive quarter, edging down by 0.3% in Q1, as prices for energy and forestry products continued to decline. On the other hand, goods exports to the rest of the world climbed by 1.8%, mainly to Brazil and the United Kingdom.
The opposite was true for imports. Higher shipments from the EU (5.8%, mainly Germany and Italy) largely offset lower imports from China (-1.6%) and the rest of the world (-3.2%). Goods imports from the United States also rose by 0.2%.
Text version
| Quarterly % growth in Q4 | Exports | Imports |
|---|---|---|
| United States | -0.3 | 0.2 |
| China | 0.0 | -1.6 |
| European Union | -10.5 | 5.8 |
| Rest of the world | 1.8 | -3.2 |
Source: Statistics Canada Table 36-10-0023-01, balance of payments basis, seasonally adjusted. European Union does not include the United Kingdom.
Services Trade continues to Recover
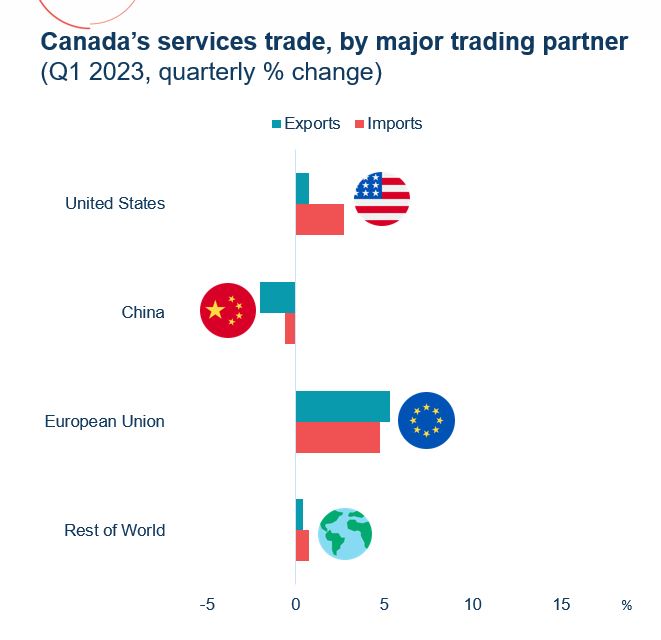
Services trade continued to recover from the pandemic, posting its 11th consecutive quarterly increase in Q1 and reaching 12.3% above Q4 2019 level (pre-pandemic). In Q1, Services exports advanced by 1.1%, while imports were up 2.4%.
Growth in services export was mainly driven by increased exports to the European Union, the United States, and Japan. However, these gains were partially offset by lower exports to India, the United Kingdom, and China. On the import side, total services imports rose mainly due to the 2.7% growth from the United States.
Travel services was a significant contributor to the quarterly growth, especially for imports as both business and personal travel expenses have more than doubled since the first quarter of 2022. The number of travellers entering or returning to Canada also increased by 5.8% in Q1. However, despite having been rising since Q2 2021, overall travel services still remain 9.2% below the pre-pandemic level recorded in Q4 2019.
Text version
| Quarterly % growth in Q4 | Exports | Imports |
|---|---|---|
| United States | 0.8 | 2.7 |
| China | -2.0 | -0.6 |
| European Union | 5.3 | 4.7 |
| Rest of the world | 0.4 | 0.8 |
Source: Statistics Canada Table 12-10-0157-01, balance of payments basis, seasonally adjusted. European Union does not include the United Kingdom.
Canada’s economic growth is expected to slow down in 2023
According to the Bank of Canada's April 2023 Monetary Policy Report, the pace of economic growth in Canada is projected to slow significantly in 2023 and 2024.
Thanks to a bounce back in Q1, the Bank’s annual forecast for Canada improved slightly from January. But an economic slowdown in 2023 is almost inevitable, as high inflation and tight financial conditions continues to be a drag on economic activities. In fact, some private forecasters are more pessimistic and expect the lagged impact of tighter financial conditions to fully hit the economy in the second half of this year, resulting in a small contraction for 2023.
Inflation remains a concern despite having declined from recent peaks. At the end of Q1 2023, inflation fell to 4.3% in March, the lowest since August 2021, as higher mortgage interest costs were offset by a decline in energy prices. However, the ongoing excess demand in the economy and a still-tight labour market continue to exert upward pressure on domestic prices and inflation rose marginally in April. Nonetheless, the Bank expects inflation to come down as goods prices return to normal, but services prices are likely to remain elevated due to strong demand as households try to make up for missed opportunities during the pandemic.
Text version
| Column1 | 2022 | 2023 | 2024 |
|---|---|---|---|
| Canadian forecasted GDP growth (%) | 3.4% | 1.4% | 1.3% |
Source: Bank of Canada, Monetary Policy Report, April 2023.
Special Focus on Export volumes recovery Driven by a price effect
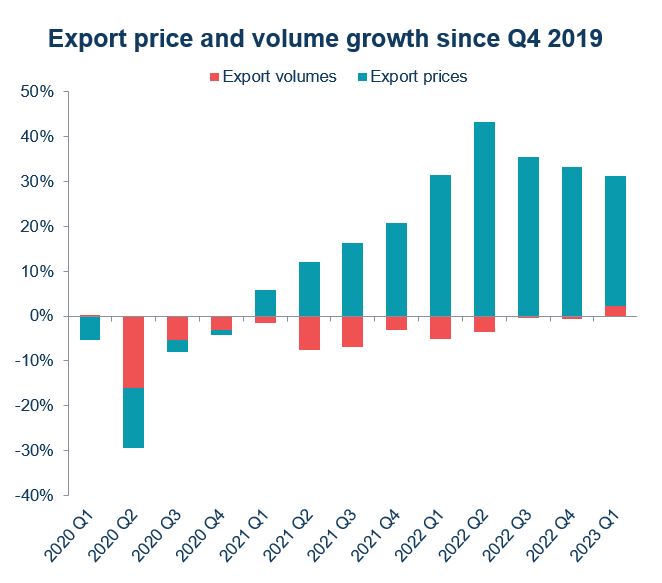
In the two years since the onset of the COVID-19 pandemic, Canadian goods exports have recorded spectacular recovery, surpassing the pre-pandemic level by the end of Q1 2021 and reaching 32% above the pre-pandemic level in Q1 2023. However, the recovery was mostly driven by prices, specifically elevated prices for commodities such as crude oil and lumber. In fact, Q1 2023 was the first quarter since the start of the pandemic that export volumes made a positive contribution to overall export growth, along with the higher prices.
Compared to Q4 2019 (pre-pandemic), goods export volumes increased in 6 of 11 product sectors in Q1 2023. Farm, fishing and intermediate food products posted the fastest growth, followed by consumer goods, metal ores and non-metallic minerals, and industrial machinery, equipment and parts. These gains were partially offset by volume declines in aircraft and other transportation equipment and parts, metal and non-metallic mineral products, and motor vehicles and parts.
It is also worth noting that although energy products contributed the most to the growth in Canada’s exports in value terms since Q4 2019, it was entirely due to a price effect as energy export volumes stayed virtually unchanged over this period.
Text version
| Date | Export volumes | Export prices |
|---|---|---|
| 2020 Q1 | 0.1% | -5.3% |
| 2020 Q2 | -16.1% | -13.3% |
| 2020 Q3 | -5.4% | -2.6% |
| 2020 Q4 | -3.0% | -1.1% |
| 2021 Q1 | -1.6% | 5.9% |
| 2021 Q2 | -7.5% | 12.1% |
| 2021 Q3 | -6.8% | 16.2% |
| 2021 Q4 | -3.0% | 20.7% |
| 2022 Q1 | -5.1% | 31.5% |
| 2022 Q2 | -3.5% | 43.4% |
| 2022 Q3 | -0.5% | 35.5% |
| 2022 Q4 | -0.6% | 33.3% |
| 2023 Q1 | 2.2% | 29.0% |
Source: Statistics Canada Table 12-10-0125-01, balance of payments basis, seasonally adjusted; retrieved on 2023-06-09
Annex: Tables
Table 1: Canadian trade by industry sector ($ millions)
| Exports | Imports | |||||
|---|---|---|---|---|---|---|
| Q1 – 2023 | Q/Q % | Y/Y % | Q1 – 2023 | Q/Q % | Y/Y % | |
| Goods | 193,680 | -0.5 | 5.6 | 192,388 | -0.1 | 9.7 |
| Resource products | 113,260 | -4.7 | -1.2 | 63,208 | -4.3 | 2.1 |
| Energy products | 42,170 | -12.6 | -14.6 | 12,458 | -7.3 | 16.5 |
| Non-resource products | 75,145 | 6.4 | 17.5 | 121,696 | 1.7 | 14.1 |
| Industrial machinery & equipment | 12,798 | 5.8 | 23.7 | 23,662 | 4.8 | 25.2 |
| Electronic machinery & equipment | 8,624 | 3.2 | 15.8 | 21,979 | 3.7 | 8.0 |
| Motor vehicles and parts | 23,947 | 16.1 | 26.5 | 31,321 | 1.3 | 25.6 |
| Aircraft & other transportation equipment | 6,796 | -4.3 | 25.6 | 5,988 | -2.9 | 13.8 |
| Consumer goods | 22,980 | 2.4 | 5.4 | 38,746 | 0.0 | 4.1 |
| Services | 43,261 | 1.1 | 15.3 | 47,946 | 2.4 | 17.7 |
| Travel | 9,650 | 2.8 | 58.0 | 10,539 | 7.9 | 113.9 |
| Transportation | 4,879 | -2.8 | 16.7 | 9,002 | 0.1 | 8.4 |
| Commercial | 28,342 | 1.2 | 5.5 | 27,954 | 1.1 | 3.3 |
| Government | 390 | 4.3 | 7.1 | 451 | 1.6 | 4.4 |
| Total Goods and Services | 236,941 | -0.2 | 7.3 | 240,334 | 0.4 | 11.2 |
Note: “Q/Q %” is the change from the previous quarter; “Y/Y %” is yearly change.
Source: Statistics Canada Table 36-10-0019-01 & 36-10-0021-01. Balance of payments basis, seasonally adjusted.
Table 2: Canadian goods trade by trading partner ($ millions)
| Exports | Imports | |||||
|---|---|---|---|---|---|---|
| Q1 – 2023 | Q/Q % | Y/Y % | Q1 – 2023 | Q/Q % | Y/Y % | |
| United States | 145,636 | -0.3 | 3.3 | 121,562 | 0.2 | 12.3 |
| Mexico | 2,448 | -8.8 | 0.8 | 6,886 | 11.7 | 25.3 |
| European Union | 8,693 | -10.5 | 3.8 | 18,612 | 5.8 | 17.0 |
| France | 1,146 | 6.6 | 28.8 | 1,597 | 7.4 | 18.1 |
| Germany | 1,882 | -2.4 | 13.2 | 5,204 | 3.8 | 27.6 |
| United Kingdom | 4,450 | 8.0 | -18.2 | 2,507 | 6.9 | 4.3 |
| India | 1,092 | -40.0 | -5.5 | 1,419 | -14.1 | 3.4 |
| China | 9,030 | 0.0 | 43.7 | 16,076 | -1.6 | -5.9 |
| Japan | 4,570 | 3.6 | 0.6 | 3,132 | 4.9 | 10.0 |
| South Korea | 1,673 | -12.6 | -29.4 | 2,719 | 1.6 | 1.4 |
| Rest of the world | 16,088 | 8.4 | 36.9 | 19,475 | -9.5 | 1.1 |
| Total Goods Trade | 193,680 | -0.5 | 5.6 | 192,388 | -0.1 | 9.7 |
Note: “Q/Q %” is the change from the previous quarter; “Y/Y %” is yearly change.
Source: Statistics Canada Table 36-10-0023-01. Balance of payments basis, seasonally adjusted.
Table 3: Canadian services trade by trading partner ($ millions)
| Exports | Imports | |||||
|---|---|---|---|---|---|---|
| Q1 – 2023 | Q/Q % | Y/Y % | Q1 – 2023 | Q/Q % | Y/Y % | |
| United States | 23,125 | 0.8 | 14.1 | 28,035 | 2.7 | 21.8 |
| Mexico | 529 | 3.7 | 25.1 | 689 | -7.4 | 61.4 |
| European Union | 5,323 | 5.3 | 19.6 | 6,142 | 4.7 | 17.3 |
| France | 1300 | 4.5 | 15.9 | 929 | -0.9 | 14.0 |
| Germany | 894 | 4.8 | 19.8 | 1,027 | -1.6 | 11.3 |
| United Kingdom | 2,002 | -2.3 | 7.2 | 2,399 | 0.0 | 8.5 |
| India | 1,575 | -3.5 | 18.0 | 769 | 1.9 | 14.8 |
| China | 2,035 | -2.0 | 19.3 | 1,012 | -0.6 | 1.4 |
| Japan | 634 | 14.6 | 31.8 | 747 | -1.3 | 11.3 |
| South Korea | 449 | 9.2 | 37.3 | 157 | 0.6 | 14.6 |
| Rest of the world | 7,589 | 0.3 | 14.1 | 7,996 | 1.9 | 8.7 |
| Total Services Trade | 43,261 | 1.1 | 15.3 | 47,946 | 2.4 | 17.7 |
Note: “Q/Q %” is the change from the previous quarter; “Y/Y %” is yearly change.
Source: Statistics Canada, Table 12-10-0157-01. Balance of payments basis, seasonally unadjusted.
- Date Modified: