
An overview of Canada-EU trade performance under CETA
Second Canada-EU CETA Joint Committee Meeting
March 25, 2021
CETA Three Years on an Overview of Canada-EU Trade Performance
Key Messages:
- Trade in goods grew steadily and significantly between 2016 and 2019, experienced a decline in 2020, and has already started to recover.
- Despite the huge challenges brought on by COVID-19, CETA continues to work as intended. Bilateral merchandise trade in 2020 was still 12.5% higher than the pre-CETA level in 2016.
- Trade in services experienced a steady growth from 2016 to 2019.
- Preference utilization rates have continued to improve, amidst the pandemic, for both parties.
- As vaccine roll-outs continue, overall trade is expected to pick up post-COVID 19.
1. Background
The Canada-European Union (EU) Comprehensive Economic and Trade Agreement (CETA or Agreement) is a comprehensive agreement that covers virtually all sectors and aspects of Canada-EU trade. The Agreement provisionally entered into force on September 21, 2017, and has eliminated or reduced barriers to trade, established and strengthened the trade rules that govern bilateral trade.
This report reviews the two partners’ trade performance three years after CETA provisionally came into effect. In particular, it compares trade performance in year 2016 (pre-CETA provisional application) with year 2019 (post-CETA provisional application and pre-COVID 19 pandemic). Where available, 2020 trade data has been included to provide a complete overview.
2. Trade Expansion under CETAFootnote 1
In spite of the challenges brought by COVID-19, CETA is working as intended. It has encouraged greater trade between Canada and the EU. Before the pandemic swept across the world in 2020, total merchandise trade between Canada and the EU reached a record high of €66.8 billion in 2019, equivalent to a 27.0% increase compared to the level in 2016, the year before CETA provisionally came into effect (Figure 1). Over the same period, Canada’s trade with the world grew only by 13.7% while the EU’s trade with the world grew by 17.4%. Moreover, since the implementation of CETA, the annual average growth rate of Canada-EU bilateral trade has increased from 4.4% during the period of 2011-2016 to almost the double of 7.9% in 2018-19.
Figure 1: Canada-EU Goods Trade, 2010-2020, in €billion

Text version
| Canadian goods exports to the EU | EU goods exports to Canada | |
|---|---|---|
| 2010 | 14.7 | 27.3 |
| 2011 | 16.8 | 30.4 |
| 2012 | 16.2 | 32.7 |
| 2013 | 16.2 | 32.7 |
| 2014 | 16.4 | 33.2 |
| 2015 | 16 | 36.8 |
| 2016 | 16.7 | 35.9 |
| 2017 | 18.2 | 39.3 |
| 2018 | 19.7 | 42.2 |
| 2019 | 20.9 | 45.9 |
| 2020 | 20.1 | 39.1 |
Source: Eurostat, Statistics Canada
Looking at changes in bilateral goods trade, Figure 2 shows that Canada’s pre-CETA goods exports to the EU increased by 25.0%, to reach €20.9 billion in 2019, while the corresponding figure for the increase in EU pre-CETA goods exports to Canada was 28.0%, which resulted in a value of exports of almost €46 billion in 2019. Annex A contains additional details on bilateral goods trade.
As trade in goods continued to advance bilaterally under CETA, EU products made inroads into the Canadian market through expanding its market share in Canada’s total imports from 9.9% in 2016 to 11.3% in 2019. The EU was the 2nd most important partner to Canada in merchandise trade, following the United States. Similarly, Canada’s share in the EU market also improved, up from 1.0% of total EU imports from the world in 2016 to 1.2% in 2020, a noticeable improvement considering the size of the EU’s total imports. Canada has steadily increased its importance in EU trade and has become the EU’s 11th most important trading partner.
COVID-19 has had an immediate and strong impact on Canada-EU bilateral trade and their respective trade with the world. Canada-EU bilateral trade in goods dropped 11.4% to €59.2 billion in 2020 compared to 2019. Nevertheless, Canada-EU bilateral trade in goods in 2020 was still 12.5% higher than the pre-CETA level in 2016.
Figure 2: Growth in Canada-EU Goods Trade, in €billion

Text version
| Canadian goods exports to the EU | EU goods exports to Canada | |
|---|---|---|
| 2016 | 16.7 | 35.9 |
| 2019 | 20.9 | 45.9 |
| 2020 | 20.1 | 39.1 |
Source: Eurostat, Statistics Canada
CETA also facilitated greater trade diversification as it encouraged more firms exporting to the market of the FTA partners. In 2019, as many as 8,291 Canadian merchandise exporters were active in the EU market, representing an increase of 6.9% or more than 500 firms compared to 2016Footnote 2. Similarly, around 66,000 EU firms exported to Canada in 2018 compared to 61,000 in 2016; and nearly 49,000 EU firms imported from Canada in 2018, representing an increase of 5.0% compared to 2016Footnote 3.
3. Sector Performance
Agricultural productsFootnote 4 represent 9.3% of total bilateral trade between Canada and the EU. Trade in these products was 14.8% higher in 2019 compared to the pre-CETA level in 2016. EU exports of agricultural products accounted for much of this growth. At the same time, Canadian exports of oil seeds, fish and seafood products to the EU also increased significantly. For non-agricultural products, the post-CETA growth was remarkable, up 28.2% compared to the pre-CETA level in 2016 (Table 1).
| Sector | 2016 | 2019 | 2020 | Growth 2016-2019 (%) | Growth 2016-2020 (%) |
|---|---|---|---|---|---|
| Total Canada-EU Trade | |||||
| Agricultural products | 5,399 | 6,200 | 7,274 | 14.8 | 34.7 |
| Non-agricultural products | 47,167 | 60,470 | 51,884 | 28.2 | 10.0 |
| Machinery | 9,204 | 11,864 | 9,769 | 28.9 | 6.1 |
| Pharmaceutical products | 4,790 | 6,845 | 6,899 | 42.9 | 44.0 |
| Ores, slag and ash | 1,766 | 3,483 | 3,625 | 97.2 | 105.3 |
| Mineral fuelsFootnote 5 | 2,912 | 4,219 | 2,100 | 44.9 | -27.9< |
| Motor vehicles and parts | 5,187 | 6,025 | 4,363 | 16.2 | -15.9 |
Source: Eurostat, Statistics Canada.
At the sector level, the largest increases by absolute value in total Canada-EU trade in goods have taken place in machinery (HS Chapter 84), pharmaceutical products (HS Chapter 30), ores, slag and ash (HS Chapter 26), mineral fuels (HS Chapter 27) and motor vehicles and parts (HS Chapter 87). These five chapters together accounted for 48.7% of the total Canada-EU bilateral trade in 2019 (Table 2).
These most traded sectors continued to grow in 2020 compared to 2016, except for mineral fuels and motor vehicles and parts.
| Sector | 2016 | 2019 | 2020 | Growth 2016-2019 (%) | Growth 2016-2020 (%) |
|---|---|---|---|---|---|
| Canadian Exports to the EU | |||||
| Agri-products | 2,207 | 2,364 | 3,377 | 7.1 | 53.0 |
| Non-agri products | 14,475 | 18,538 | 16,672 | 28.1 | 15.2 |
| Ores, slag and ash | 1,701 | 3,400 | 3,514 | 99.8 | 106.6 |
| Mineral fuelsFootnote 6 | 1,025 | 2,064 | 1,130 | 101.3 | 10.2 |
| Pharmaceutical products | 969 | 1,482 | 1,579 | 52.9 | 63.0 |
| Machinery | 2,194 | 2,616 | 1,940 | 19.2 | -11.6 |
| Precious stones & metals | 1,052 | 1,345 | 1,603 | 27.8 | 52.4 |
| EU Exports to Canada | |||||
| Agri-products | 3,192 | 3,836 | 3,897 | 20.2 | 22.1 |
| Non-agri products | 32,692 | 41,932 | 35,212 | 28.3 | 7.7 |
| Machinery | 7,010 | 9,248 | 7,829 | 31.9 | 11.7 |
| Pharmaceutical products | 3,820 | 5,362 | 5,320 | 40.4 | 39.3 |
| Aircrafts and parts | 621 | 1,500 | 886 | 141.4 | 42.7 |
| Motor vehicles and parts | 4,740 | 5,597 | 4,041 | 18.1 | -14.7 |
| Organic chemicals | 1,080 | 1,906 | 1,724 | 76.5 | 59.6 |
Source: Eurostat, Statistics Canada.
CETA eliminates most duties in agricultural trade, but for some products, the Agreement provides for tariff rate quotas (TRQs). This is the case for EU cheese exports to Canada and for Canadian exports to the EU of products such as beef and veal, pork and sweet corn. Table 3 shows that, for EU exports of cheese to Canada, the TRQ is well used. However, the opposite holds true for Canadian exports under TRQs of beef and veal, pork and sweet corn.
| Importer | Product | TRQ (tonnes) | TRQ Used (tonnes) | Quota Utilisation Rate (%) |
|---|---|---|---|---|
| Canada | Cheese | 11,800 | 11,109 | 94.1 |
| EU | Beef and veal* | 34,720 | 1,091 | 3.1 |
| EU | Pork | 55,549 | 0 | 0 |
| EU | Sweet corn | 5,333 | 222 | 4.2 |
Source: European Commission and Global Affairs Canada.
*Fresh and frozen
4.Trade in Environmental Goods
Growing concerns of climate change in both Canada and the EU have given rise to an increase in trade in environmental goodsFootnote 7. Total bilateral trade in environmental goods grew 17.2% from €6.1 billion in 2016 to €7.1 billion in 2019. Canadian exports of environmental goods reached €1.6 billion in 2019, up 23.0% from €1.3 billion in 2016. Similarly, EU exports of environmental goods to Canada grew 15.8% from €4.8 billion in 2016 to €5.5 billion in 2019. Figure 3 below shows increases in trade in certain categories of environmental good: pipes and tubes for recycling purposes (HS Chapters 39 and 40), prefabricated building structures (HS Chapter 73), energy-efficient machinery (HS Chapters 84 and 85), and measuring equipment for pollution levels (HS Chapter 90).
Figure 3: Trade in Environmental Goods, in €million

Text version
| 2016 | 2019 | 2020 | |
|---|---|---|---|
| Pipes and tubes for recycling purposes | 413 | 526 | 486 |
| Prefabricated building structures | 287 | 442 | 398 |
| Energy-efficient machinery | 4,311 | 4,940 | 4,108 |
| Measuring equipment for pollution levels | 1,046 | 1,243 | 1,128 |
Source: Eurostat, Statistics Canada
All these goods experienced the post-CETA growth in 2019 compared to their pre-CETA level. Even under the siege of COVID-19, the trading levels remained high compared to pre-CETA except for energy-efficient machinery that suffered a larger setback in 2020.
5. Services Trade
Canada-EU trade in services has increased impressively over the past decade. From 2010 to 2019Footnote 8, both Canadian exports of services to the EU and EU exports of services to Canada have experienced substantial growth (Figure 4). Comparing 2016 and 2019, total Canada-EU services trade has increased by 39.0%; specifically, Canadian services exports to EU increased by 36.6% and EU services exports to Canada increased by 40.6%. Annex B includes more details on annual trade performance in services between Canada and the EU.
Figure 4: Canada-EU Services Trade, 2010-2019, in €billion

Text version
| Canadian services exports to the EU | EU services exports to Canada | |
|---|---|---|
| 2010 | 8.2 | 10.5 |
| 2011 | 8.1 | 11.1 |
| 2012 | 9.7 | 12.3 |
| 2013 | 9.8 | 13.4 |
| 2014 | 9 | 12.5 |
| 2015 | 10.5 | 14.6 |
| 2016 | 10.1 | 15.5 |
| 2017 | 11.3 | 17 |
| 2018 | 15 | 19.2 |
| 2019 | 13.8 | 21.8 |
Source : Eurostat
For Canadian services exports to the EU, the three main categories “other business services”, transportation and travel services together accounted for around 70.0% of the total in 2019. Between 2016 and 2019, “other business services” increased 43.0% from € 2.8 billion to €4.0 billion, transport services went up 21.8% from €2.4 billion to €2.9 billion, and travel services increased 34.5% from €2.2 billion to €2.9 billion (Figure 5). As regards EU’s services exports to Canada over the same period, EU exports of commercial services to Canada increased 34.6% from €2.8 billion to €3.8 billion, transportation services increased 31.7% from €3.3 billion to €4.3 billion, and EU exports of travel services had increased 43.7% from €3.7 billion to €5.3 billion (Figure 6).
Figure 5: Canadian Services Exports to EU, 2016 and 2019, in €billion
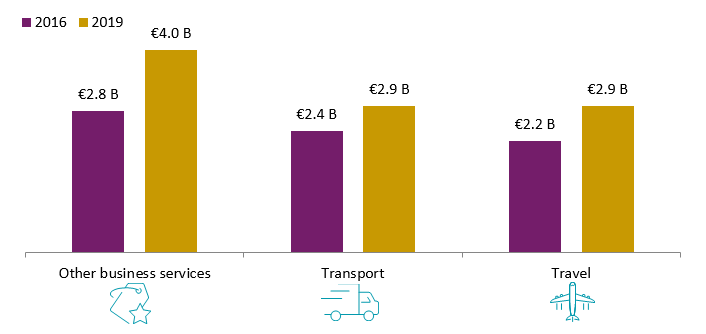
Text version
| 2016 | 2019 | |
|---|---|---|
| Other business services | 2.8 | 4.0 |
| Transport | 2.4 | 2.9 |
| Travel | 2.2 | 2.9 |
Source: Eurostat
Figure 6: EU Services Exports to Canada, 2016 and 2019, in €billion
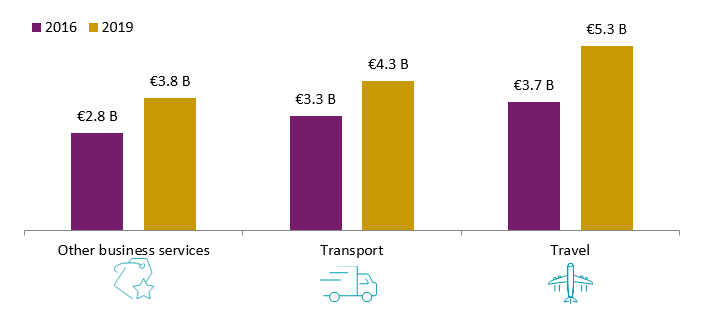
Text version
| 2016 | 2019 | |
|---|---|---|
| Other business services | 2.8 | 3.8 |
| Transport | 3.3 | 4.3 |
| Travel | 3.7 | 5.3 |
Source: Eurostat
6. Dutiable and Duty-free Trade under CETA
Canada-EU goods trade comprises duty-free trade and dutiable trade. The latter is subject to Most Favoured Nation (MFN) duties, which were removed under CETA (or exempted from CETA commitments). Approximately €3.4 billion or 22.0% of total Canadian merchandise exports to the EU were dutiable in 2019. Compared to 2016, Canadian dutiable exports to the EU grew by 26.5% to reach €4.2 billion in 2019 (Figure 7)Footnote 9. Canadian dutiable exports grew in 18 of the EU member states from 2016 to 2019. Machinery, aluminum, fish and seafood, mineral fuels and rubber products led the growth in Canadian dutiable exports to the EU. These five categories made up as much as 47.4% of total Canadian exports of dutiable products to the EU in 2019.
From the EU perspective, only about 24.2% of total EU merchandise exports to Canada were dutiable, and they grew 14.0% compared to 2016 to reach €11.1 billion in 2019. EU dutiable exports to Canada grew in all except three member states from 2016 to 2019. EU exports of beverages and spirits, cosmetics preparations, leather goods, motor vehicles and precious stones and metals increased the most of all dutiable products, and made up about 58.2% in total EU dutiable exports to Canada in 2019.
Figure 7: Dutiable Trade, in €billion

Text version
| Canada exports to EU | EU exports to Canada | |
|---|---|---|
| 2016 | 3.4 | 9.7 |
| 2019 | 4.2 | 11.1 |
| 2020 | 4.1 | 9.1 |
Source: Eurostat, Statistics Canada
In 2019, duty-free products accounted for 78.0% of all Canadian goods exports to the EU and 75.8% of EU goods exports to Canada, respectively. Canadian duty-free exports to the EU rose by 26.2%, from €11.8 billion in 2016 to €14.9 billion in 2019, while EU duty-free exports to Canada grew by 32.6 %, from €25.8 billion to €34.2 billion over the same period (Figure 8).
Ores, pharmaceutical products, mineral fuels, precious stones and metals, and medical instrument led the growth of Canadian exports of duty-free products to the EU from 2016 to 2019. These five categories made up 55.4% of total Canadian exports of duty-free products to the EU in 2019.
Top EU duty-free exports to Canada were machinery, pharmaceutical products, aircrafts and parts, organic chemicals and motor vehicles. These products made up 56.5% of the total EU duty-free exports to Canada (Figure 8).
In 2020, there had been noticeable decrease in Canada-EU trade in goods. Canadian exports of dutiable goods to the EU declined slightly from €4.2 billion in 2019 to €4.1 billion in 2020. Similarly, for duty-free goods, Canadian exports to the EU fell by approximately €0.1 billion to €14.8 billion in 2020. On the other hand, EU exports to Canada experienced larger declines in 2020 compared to 2019; with dutiable exports decreased from €11.1 billion in 2019 to €9.1 billion in 2020; and duty-free exports decreased from €34.2 billion in 2019 to €29.6 billion in 2020.
Figure 8: Duty-free Trade, in €billion

Text version
| Canada exports to EU | EU exports to Canada | |
|---|---|---|
| 2016 | 11.8 | 25.8 |
| 2019 | 14.9 | 34.2 |
| 2020 | 14.8 | 29.6 |
Source: Eurostat, Statistics Canada
7. Progressing utilization of CETA preferences
The preference utilization rate (PUR) indicates the extent to which exports that are eligible for CETA preferences actually claim these preferences when they enter the FTA partner countries. In Figure 9 below, the PUR is defined as the value of imports that claimed preferential treatment divided by the value of imports that are covered by CETA or eligible for CETA preferences. Products that do not claim or qualify for CETA preferences - for instance, because they fail to meet rules of origin requirements - have to pay the normal MFN duties. Customs data that record imports claiming CETA preference are obtained through regular data exchanges between Canada and the EU.
Figure 9: Goods Covered by CETA Preferences, an Overview

Text version
Total Imports
Dutiable Imports
Duty-free Imports (MFN-0)
Excluded from CETA
Covered by CETA
MFN Treatment
Preferential Treatment
MFN-0 Treatment
Source: Office of the Chief Economist, Global Affairs Canada and the European Commission.
Recent data show the level of utilization continues to improve in both directions of trade as the CETA tariff phase-out continues. As of January 1, 2021, only a small number of the EU tariffs (approximately 103 lines) and Canadian tariffs (about 22 lines) had yet to be reduced under CETA. In addition to the immediate reduction of tariffs on approximately 98% of all EU tariff lines that took place on the date of provisional application, tariffs phase-outs will continue until 2024 when Canada will have duty-free access to the EU on about 99% of all EU tariff lines.
About 57% of Canadian merchandise exports to the EU that were eligible for CETA preferences actually claimed CETA preferences in 2020, a noticeable improvement from 51.9% in 2018. The utilization rate of CETA preferences of EU goods exports to Canada improved significantly, up from 38.4% in 2018 to 55.5% in 2020 (Figure 10).
Figure 10: Utilization of CETA preferences, 2018 to 2020Footnote 10
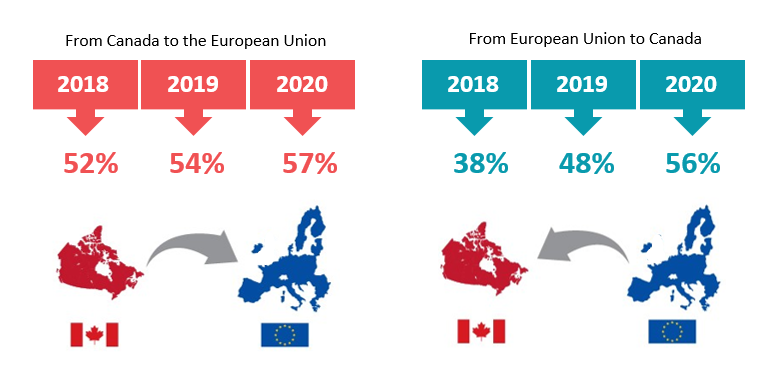
Text version
| From Canada to European Union | From European Union to Canada | |
|---|---|---|
| 2018 | 52% | 38% |
| 2019 | 54% | 48% |
| 2020 | 57% | 56% |
Source: Eurostat, Statistics Canada
While overall PURs of Canadian and EU exports under CETA improved, PURs between Canada and different EU member states varied. PURs for some EU member states’ exports to Canada remains rather low; particularly in some larger EU member states; for example, the PUR for German exports to Canada was 40.7% and for Spanish was 35.9% in 2019. Annex C includes detailed PURs information.
At the product level, high PURs could be found in Canadian exports of sugar and confectionery, cocoa and preparations and of the fish and seafood sectors; while PURs were reported lower in the sectors like aircrafts and parts or organic chemicals. Even within the same sector, the PURs vary substantially. For instance, the PURs for Canadian exports to the EU of motor vehicles and parts ranged from 7.3% for Finland and 18.0% for Belgium to 53.8% for Germany in 2020.Footnote 11
For EU exports to Canada, the PURs for exports from different EU member states ranged widely from 20.5% for Luxembourg to 95.9% for Cyprus in 2020. Meat, fruits and nuts, cocoa and preparations, and preparations of cereals were sectors with high PURs; while nickel, cereals, aircrafts and parts, and pharmaceutical products have low PURs. Similar to Canadian exports to the EU, PURs vary substantially even within the same sector. For instance, the PURs for EU exports to Canada of motor vehicles and parts ranged from 0.2% for Hungary and 19.3% for Germany to 78.5% for Belgium.Footnote 12
Annex
| Year | Canadian Exports to the EU | EU Exports to Canada | Total Trade |
|---|---|---|---|
| 2010 | 14.7 | 27.3 | 42.0 |
| 2011 | 16.8 | 30.4 | 47.2 |
| 2012 | 16.2 | 32.7 | 48.9 |
| 2013 | 16.2 | 32.7 | 48.9 |
| 2014 | 16.4 | 33.2 | 49.6 |
| 2015 | 16.0 | 36.8 | 52.8 |
| 2016 | 16.7 | 35.9 | 52.6 |
| 2017 | 18.2 | 39.3 | 57.5 |
| 2018 | 19.7 | 42.2 | 61.9 |
| 2019 | 20.9 | 45.9 | 66.8 |
| 2020 | 20.1 | 39.1 | 59.2 |
Source: Eurostat, Statistics Canada
| Year | Canadian Exports to the EU | EU Exports to Canada | Total Trade |
|---|---|---|---|
| 2010 | 8.2 | 10.5 | 18.7 |
| 2011 | 8.1 | 11.1 | 19.2 |
| 2012 | 9.7 | 12.3 | 22.0 |
| 2013 | 9.8 | 13.4 | 23.2 |
| 2014 | 9.0 | 12.5 | 21.5 |
| 2015 | 10.5 | 14.6 | 25.1 |
| 2016 | 10.1 | 15.5 | 25.6 |
| 2017 | 11.3 | 17.0 | 28.3 |
| 2018 | 15.0 | 19.2 | 34.2 |
| 2019 | 13.8 | 21.8 | 35.6 |
Source: Eurostat
| Member State | Goods Trade (Imports + Exports) | Growth (€million) | Growth (%) | |
|---|---|---|---|---|
| 2016 | 2019 | (2016-2019) | (2016-2019) | |
| Austria | 1,346 | 1,725 | 379 | 28.2 |
| Belgium | 4,002 | 6,421 | 2,419 | 60.4 |
| Bulgaria | 143 | 208 | 65 | 45.5 |
| Croatia | 50 | 68 | 18 | 36.0 |
| Cyprus | 9 | 15 | 6 | 66.7 |
| Czechia | 500 | 848 | 348 | 69.6 |
| Denmark | 943 | 1,255 | 312 | 33.1 |
| Estonia | 154 | 132 | -22 | -14.3 |
| Finland | 964 | 1,290 | 326 | 33.8 |
| France | 6,365 | 8,530 | 2,165 | 34.0 |
| Germany | 15,035 | 17,610 | 2,575 | 17.1 |
| Greece | 220 | 269 | 49 | 22.3 |
| Hungary | 493 | 696 | 203 | 41.2 |
| Ireland | 1,822 | 2,558 | 736 | 40.4 |
| Italy | 6,613 | 8,084 | 1,471 | 22.2 |
| Latvia | 77 | 630 | 553 | 718.2 |
| Lithuania | 275 | 196 | -79 | -28.7 |
| Luxembourg | 315 | 209 | -106 | -33.7 |
| Malta | 640 | 104 | -536 | -83.8 |
| Netherlands | 4,396 | 6,055 | 1,659 | 37.7 |
| Poland | 1,507 | 1,779 | 272 | 18.0 |
| Portugal | 545 | 571 | 26 | 4.8 |
| Romania | 430 | 385 | -45 | -10.5 |
| Slovakia | 426 | 573 | 147 | 34.5 |
| Slovenia | 222 | 257 | 35 | 15.8 |
| Spain | 2,813 | 3,763 | 950 | 33.8 |
| Sweden | 1,841 | 1,913 | 72 | 3.9 |
| Total - EU27 | 52,146 | 66,144 | 13,998 | 26.8 |
Source: Eurostat, Statistics Canada
| EU Exports to Canada | Canadian Exports to the EU | |
|---|---|---|
| Austria | 36.4 | 48.1 |
| Belgium | 60.9 | 74.8 |
| Bulgaria | 52.6 | 57.2 |
| Croatia | 39.3 | 22.0 |
| Cyprus | 42.7 | 95.9 |
| Czechia | 55.7 | 66.7 |
| Denmark | 86.5 | 72.1 |
| Estonia | 64.0 | 73.5 |
| Finland | 65.8 | 70.0 |
| France | 63.4 | 65.6 |
| Germany | 40.7 | 32.8 |
| Greece | 59.8 | 67.8 |
| Hungary | 49.6 | 21.2 |
| Ireland | 76.5 | 76.7 |
| Italy | 59.7 | 69.1 |
| Latvia | 57.3 | 29.1 |
| Lithuania | 10.6 | 47.3 |
| Luxembourg | 49.7 | 20.5 |
| Malta | 1.9 | 62.2 |
| Netherlands | 78.2 | 53.8 |
| Poland | 55.1 | 58.9 |
| Portugal | 63.7 | 73.6 |
| Romania | 36.7 | 72.5 |
| Slovakia | 54.6 | 30.7 |
| Slovenia | 51.5 | 67.3 |
| Spain | 35.9 | 72.6 |
| Sweden | 51.7 | 75.5 |
| Total- EU27 | 56.8 | 55.5 |
Source: Eurostat, Statistics Canada.
- Date Modified: