
Navigating new currents: What Canada’s State of Trade 2026 report tells us

How is Canada doing in an unpredictable global economy?
Every year, the Office of the Chief Economist at Global Affairs Canada looks at how Canada is doing in global trade: what we’re buying and selling, where we’re doing business and how global changes are affecting our economy.
The State of Trade 2026 report explains key global trends from the past year, including higher tariffs, changes in global trade and the rapid growth of artificial intelligence (AI). Most importantly, it shows how these changes affect Canadians.
Here are key findings from this year’s report and what they could mean for Canada’s economy.
A changing world economy
Global trade faced major challenges last year. The highest U.S. tariffs since the 1970s and retaliatory measures meant that an estimated 11% of all world merchandise trade was affected by tariffs.
Despite these challenges, global trade continued to grow. The main engine? A global boom in AI. Demand for AI-enabling goods, such as computer chips and semiconductors, grew rapidly to make up nearly 17% of all global merchandise trade, as estimated by the World Trade Organization. While direct trade between the United States and China slowed down, new trading links across Asia, Europe and Latin America helped keep the global economy resilient.
Services are Canada’s hidden export powerhouse
When most people think of Canadian trade, they think of physical goods such as cars, oil or wheat, but services are an increasingly important part of Canada’s trade.
During the last 15 years, Canadian service exports nearly tripled, reaching a record $240 billion in 2025. Today, services make up almost a quarter of all Canadian exports. From tech consulting and financial services to international education and travel, services have proven far more resilient to global tariffs and supply chain disruptions than physical goods. Even better, service exports are naturally well-diversified, with nearly half sold outside the United States.
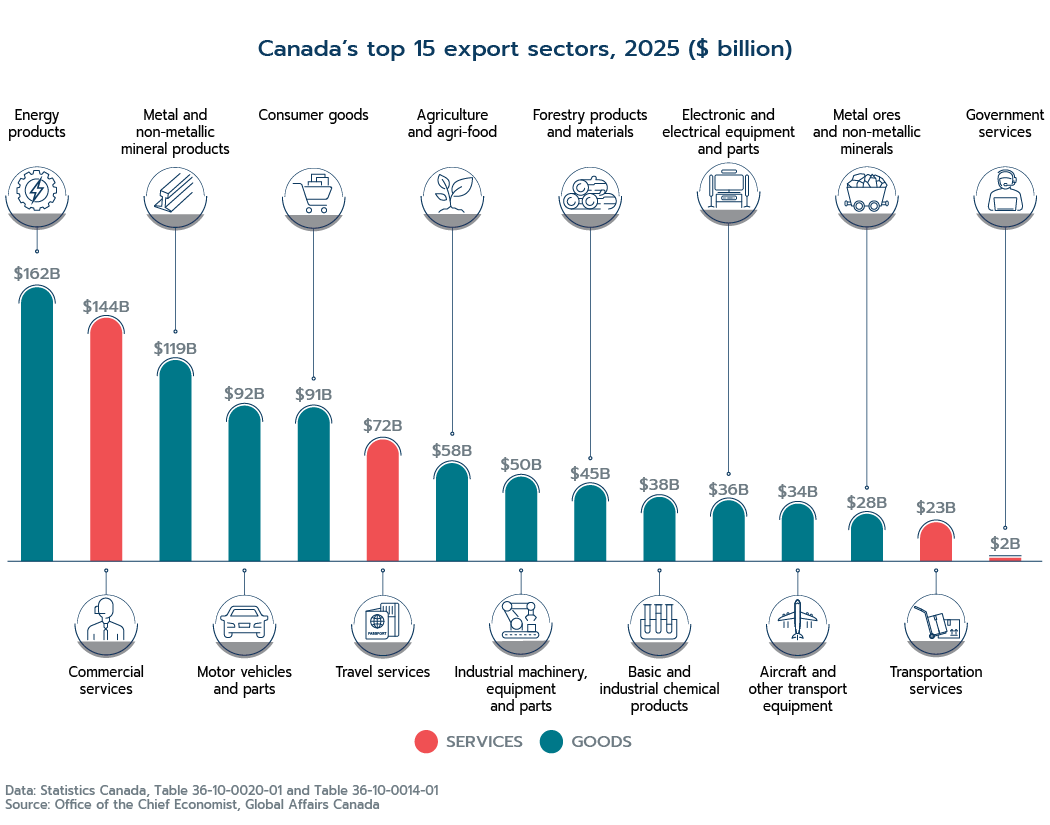
Commercial services at $144 billion sit near the top of Canada’s export mix, second only to energy products at $162 billion and outranking motor vehicles at $92 billion and agri-food at $58 billion.
Text version
Goods and services categories | Canada’s 2025 export value ($ billion) |
|---|---|
Energy products | $162B |
Commercial services | $144B |
Metal and non-metallic mineral products | $119B |
Motor vehicles and parts | $92B |
Consumer goods | $91B |
Travel services | $72B |
Agriculture and agri-food | $58B |
Industrial machinery, equipment and parts | $50B |
Forestry products and materials | $45B |
Basic and industrial chemical products | $38B |
Electronic and electrical equipment and parts | $36B |
Aircraft and other transport equipment | $34B |
Metal ores and non-metallic minerals | $28B |
Transportation services | $23B |
Government services | $2B |
Data: Statistics Canada, Table 36-10-0020-01 and Table 36-10-0014-01. | |
Services are far more stable during economic downturns because they do not face border stops, shipping delays or physical tariffs. What makes Canadian services succeed on the world stage? The report points to three main pillars:
- Skilled talent - Canada’s highly educated workforce drives innovation
- Digital tools - Fast Internet speed and secure networks allow seamless remote work
- Strong rules - Clear regulations and trade treaties keep cross-border business smooth and safe
Global investors continue to choose Canada
Foreign direct investment in Canada reached $93 billion in 2025—the highest level in more than a decade.
Even though the world economy is uncertain, foreign investors keep choosing Canada. Why? We have a highly educated workforce, strong digital infrastructure and stable business environment. It makes Canada an attractive place to invest. That investment can help Canadian businesses grow and create jobs and opportunities for Canadians.
Canada’s flows of foreign direct investment ($ billion)
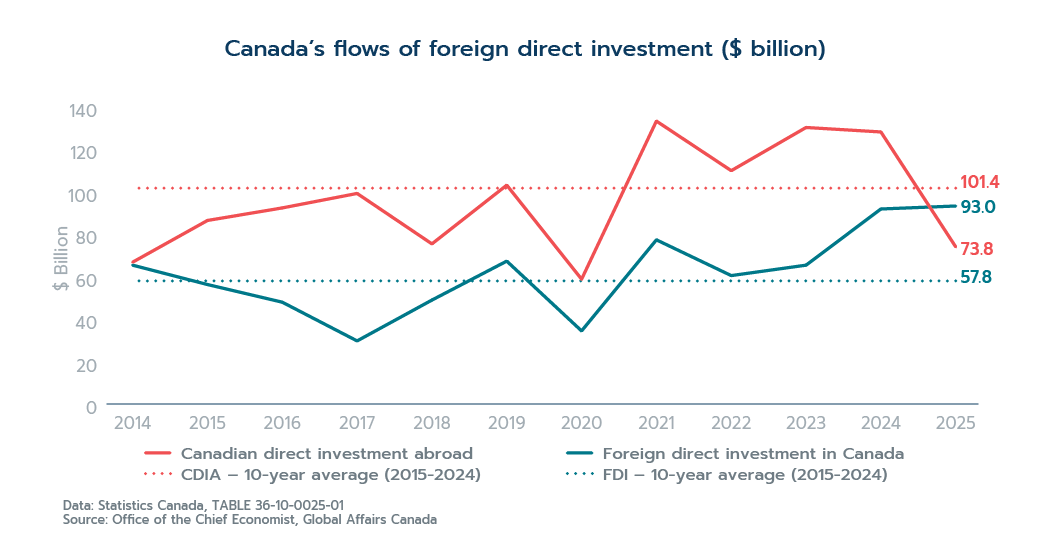
Foreign direct investment in Canada rebounded sharply to $93.0 billion in 2025, well above its 10-year average of $57.8 billion.
Text version
Year | Canadian direct investment abroad ($ billion) | Foreign direct investment in Canada ($ billion) |
|---|---|---|
2014 | $66.6B | $65.2B |
2015 | $86.2B | $56.1B |
2016 | $92.1B | $47.8B |
2017 | $98.9B | $29.6B |
2018 | $75.2B | $48.8B |
2019 | $102.8B | $67.1B |
2020 | $58.6B | $34.3B |
2021 | $132.9B | $77.1B |
2022 | $109.6B | $60.3B |
2023 | $129.9B | $65.2B |
2024 | $127.8B | $91.6B |
2025 | $73.8B | $93.0B |
Data: Statistics Canada, Table 36-10-0025-01. | ||
Canada is selling more to the world
The United States remains Canada’s largest trading partner, but new U.S. tariffs and policy changes made it harder for Canadian exports to grow in that market in 2025.
The result? It’s trade diversification in action.
Canadian businesses actively pivoted to new opportunities across Europe, the Indo-Pacific and the United Kingdom. Exports to non-U.S. markets rose by 11.1%, pushing the non-U.S. share of Canadian exports to its highest level since 1981. Driven by demand for key commodities such as gold, crude oil, aluminum and canola, Canadian resources helped steady our trade balance during turbulent times.
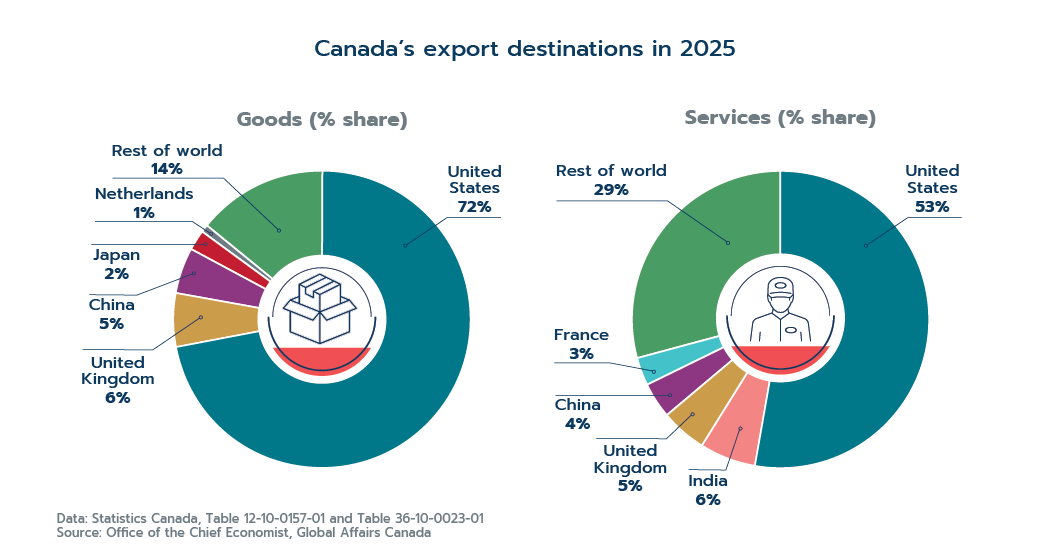
Although 72% of Canadian goods go to the U.S., service exports are significantly more diversified, with nearly half (47%) going to non-U.S. markets such as India, the United Kingdom, China and France.
Text version
Destination | Share of type (%) |
|---|---|
Goods | |
United States | 72% |
United Kingdom | 6% |
China | 5% |
Japan | 2% |
Netherlands | 1% |
Rest of world | 14% |
Services | |
United States | 53% |
India | 6% |
United Kingdom | 5% |
China | 4% |
France | 3% |
Rest of world | 29% |
Data: Statistics Canada, Table 12-10-0157-01 and Table 36-10-0023-01. | |
What’s next for Canadian trade?
Global trade remains unpredictable, but Canada’s economy showed resilience in 2025. By selling more Canadian goods and services (including increasing high-tech services) to more markets around the world, Canada is creating new opportunities for Canadian businesses and workers—and reducing our reliance on any one market.
Want to dive deeper into the data, charts and analysis? Read the full State of Trade 2026 report to see how Canadian commerce is evolving.
- Date modified:
