
Canadian direct investment in developing countries: a descriptive analysis
Marie-Eve Yergeau
2019-07-29
Summary
Increasing foreign direct investment (FDI) in developing countries can play an important role in achieving Sustainable Development Goals. In this context, a descriptive analysis of Canadian direct investment abroad (CDIA), by revenue level and by geographic region of recipient countries, was carried out.
Key Points
- Canadian direct investment is directed more towards developed countries (92%) than to developing countries (8%)
- Canadian direct investment directed towards middle income countries is more diversified than that directed to low income countries
- Compared to other G7 countries, Canada directs a large share of its foreign direct investment to Central and South America, but a relatively small amount to Asia and Africa
Table of contents
1. Introduction
Foreign direct investment (FDI) in developing countries is on the rise. Between 2000 and 2017, global FDI flows to developing countries increased from US$232 billion to US$671 billion. The acceleration in inward FDI growth is also faster in developing countries than in developed countries, so much so that between 2000 and 2017, the share of global FDI flows to developing countries jumped from 17% to 47% (UNCTAD, 2019). Multinationals are therefore increasingly taking an interest in developing economies, seeing investment opportunities there.
Since the mid-1990s, FDI has become the main source of external financing in developing countries and is now more than twice as high as official development assistance (Farla, de Crombrugghe and Verspagen, 2016). In the scientific literature, studies tend to show a positive correlation between FDI inflows and economic growth. In addition, it appears that FDI flows in developing countries are likely to stimulate domestic investment, create job opportunities, integrate local firms into global markets, increase wages, productivity and exports, and result in a transfer of technology, knowledge and management skills (see, for example, de Mello, 1997; Hirshhorn, 2015; Farla, de Crombrugghe and Verspagen, 2016; Rostami, Kalbfleisch and Xu, 2016; Pineli, Narula and Belderbos, 2019). However, mixed empirical results suggest that the benefits generated by FDI inflows depend on a number of factors, including the level of human capital and development of the financial system in the recipient country. That said, developing a strategy that fosters private investment in developing countries is an integral part of the international agenda to achieve the Sustainable Development Goals (SDGs). Indeed, FDI growth in the sustainable energy, infrastructure and transportation, and information and communication technology sectors is considered urgent and necessary for SDG achievement (United Nations, 2019).
In this context, the main donor countries of official development assistance are looking for ways to combine official assistance with other financing sources, including private investment (OECD, 2018a). Canada is no exception. For example, the Canadian government announced a major investment in 2018 to promote innovative financing in developing countries, including blended financingFootnote 1. In addition, the opening in 2018 of FinDev Canada, which aims to provide entrepreneurs in developing countries with easier access to financing, is reflective of Canada’s involvement in the search for strategies to increase Canadian private investment in developing countries.
At present, Canadian direct investment abroad (CDIA) in developing countries is fairly low. In 2018, the share of CDIA stock in low and middle income countriesFootnote 2 was just 8%Footnote 3. This means that more than 90% of stock is in developed countries. To inform the discussion on the development of a strategy to stimulate Canadian investment in developing countries, this report presents a descriptive analysis of CDIA by income level and geographic area of recipient countries.
2. Methodological Considerations
The data used in this report are derived from two different sources: first, the global inward FDI stock series for the period 1980-2017, published by UNCTAD, and second, the CDIA stock series for the period 2011-2018, where available, or 2013-2018, published by Statistics Canada. In some cases, data disaggregated by country are not available because of confidentiality concerns. Therefore, the information presented for individual countries reflects available information only.
To conduct a disaggregated analysis by the recipient country’s income level, the World Bank classification is used. Every year, the World Bank produces a classification of countries according to four different income levels: (1) low income, (2) lower middle income, (3) upper middle income, and (4) high income. The thresholds are reviewed annually to take account of certain factors affecting the standard of living, such as income and population growth, inflation, and exchange rate fluctuations. For example, in 2018, countries were classified based on the thresholds shown in Table 1.
Table 1 – Country classification according to annual per capita income, in US$, 2018
Classification | Per capita income (US$) |
Low income | $995 or less |
Lower middle income | Between $996 and $3,895 |
Upper middle income | Between $3,896 and $12,055 |
High income | $12,056 or more |
Last, the variable of interest is the inward FDI stock measured on an annual basis. Inward FDI stocks measure the total level of foreign investment at a given time, in a given country. Therefore, changes in inward FDI stock, from one year to another, represent the value of transnational financial transactions recorded during the year, plus other changes, including those in prices and exchange rates (OECD, 2018b). It is noteworthy that data availability prevents us from presenting information on FDI flows. For more methodological information on the data used in the statistics presented, see UNCTAD (2017) and Statistics Canada (2018)
3. Trends in Global Foreign Direct Investment
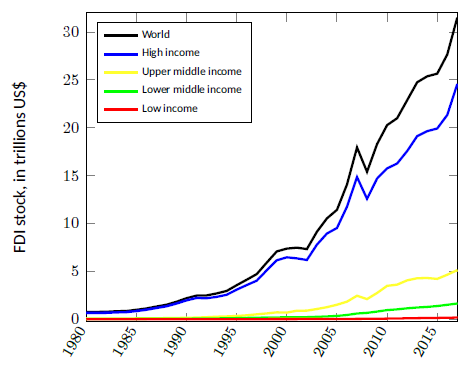
Since 1980, global inward FDI stock has been trending upwards, increasing from close to US$1 trillion in 1980 to more than US$30 trillion in 2017. As shown in Figure 1, , this growth took place mainly in high income countries. Inward stock in low and middle income countries, meanwhile, remains fairly low.
As of the early 2000s, an acceleration has been observed in the growth of FDI stock in both lower and upper middle income countries. This latter group of countries notably includes China and Brazil, which ranked in the top 10countries receiving the most FDI in the world in 2017 (UNCTAD, 2018).
Inward FDI stock is also increasing more quickly in low and middle income countries than in high income countries. Figure 2 shows that between 2000 and 2017, the share of global FDI stock in low and middle income countries increased, whereas that in high income countries decreased. This observation is consistent with the fact that a slowdown, or even a decline, in inward FDI flows has been noted in high income countries in recent years, but not in low and middle income countries. According to UNCTAD (2018), lower FDI flows in high income countries are the result of a number of factors, including growth in asset light overseas operationsFootnote 4and declining returns on investment over the past five years. Tax cuts and low labour costs could also be behind the upward trends observed in low and middle income countries.
Figure 1 – Global FDI stock, 1980-2017
Text version
| Year | World | High income | Upper middle income | Lower middle income | Low income |
| 1980 | 0.70 | 0.604 | 0.068 | 0.025 | 0.003 |
| 1981 | 0.75 | 0.644 | 0.073 | 0.028 | 0.004 |
| 1982 | 0.78 | 0.669 | 0.079 | 0.031 | 0.0045 |
| 1983 | 0.84 | 0.715 | 0.084 | 0.033 | 0.0044 |
| 1984 | 0.86 | 0.741 | 0.085 | 0.034 | 0.0045 |
| 1985 | 0.99 | 0.85 | 0.092 | 0.039 | 0.0045 |
| 1986 | 1.13 | 0.987 | 0.1 | 0.042 | 0.0045 |
| 1987 | 1.33 | 1.172 | 0.111 | 0.047 | 0.0046 |
| 1988 | 1.52 | 1.35 | 0.12 | 0.05 | 0.005 |
| 1989 | 1.83 | 1.636 | 0.136 | 0.055 | 0.0058 |
| 1990 | 2.20 | 1.973 | 0.155 | 0.061 | 0.0064 |
| 1991 | 2.47 | 2.22 | 0.176 | 0.068 | 0.0067 |
| 1992 | 2.49 | 2.196 | 0.216 | 0.076 | 0.0069 |
| 1993 | 2.70 | 2.338 | 0.267 | 0.087 | 0.0069 |
| 1994 | 2.96 | 2.557 | 0.299 | 0.1 | 0.0073 |
| 1995 | 3.56 | 3.094 | 0.344 | 0.119 | 0.0082 |
| 1996 | 4.13 | 3.571 | 0.413 | 0.141 | 0.0086 |
| 1997 | 4.72 | 4.033 | 0.516 | 0.162 | 0.01 |
| 1998 | 5.92 | 5.117 | 0.608 | 0.18 | 0.0125 |
| 1999 | 7.09 | 6.16 | 0.723 | 0.192 | 0.0129 |
| 2000 | 7.38 | 6.472 | 0.693 | 0.202 | 0.0144 |
| 2001 | 7.48 | 6.362 | 0.894 | 0.203 | 0.0159 |
| 2002 | 7.33 | 6.191 | 0.902 | 0.22 | 0.019 |
| 2003 | 9.40 | 7.793 | 1.07 | 0.255 | 0.0223 |
| 2004 | 10.54 | 8.955 | 1.263 | 0.294 | 0.0257 |
| 2005 | 11.43 | 9.534 | 1.517 | 0.348 | 0.028 |
| 2006 | 14.08 | 11.76 | 1.839 | 0.446 | 0.032 |
| 2007 | 17.95 | 14.855 | 2.456 | 0.6 | 0.04 |
| 2008 | 15.40 | 12.58 | 2.109 | 0.669 | 0.0446 |
| 2009 | 18.30 | 14.7 | 2.743 | 0.804 | 0.0546 |
| 2010 | 20.28 | 15.76 | 3.49 | 0.956 | 0.068 |
| 2011 | 21.00 | 16.27 | 3.616 | 1.035 | 0.081 |
| 2012 | 22.88 | 17.57 | 4.064 | 1.144 | 0.1 |
| 2013 | 24.76 | 19.13 | 4.286 | 1.228 | 0.116 |
| 2014 | 25.38 | 19.65 | 4.309 | 1.29 | 0.129 |
| 2015 | 25.66 | 19.93 | 4.218 | 1.381 | 0.141 |
| 2016 | 27.66 | 21.34 | 4.651 | 1.511 | 0.16 |
| 2017 | 31.52 | 24.57 | 5.133 | 1.645 | 0.178 |
Therefore, while global FDI is still directed to developed countries for the most part, developing countries have seen steady growth in investment in the past few years. The sections that follow look at whether these same trends have been noted in CDIA.
4. Canadian Direct Investment Abroad: Outlook Based on the Income Level of the Recipient Country
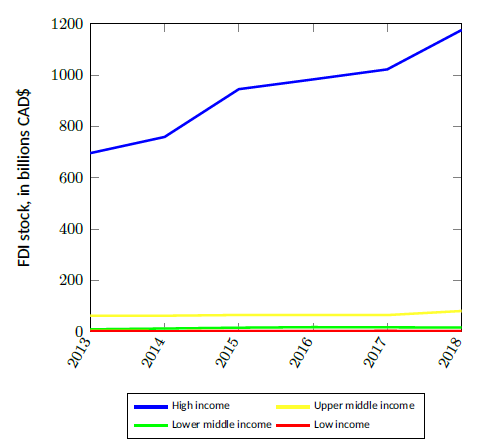
Canada is no exception to the global trend when it comes to the destination of its investment. In 2018, the stock of Canadian investment abroad was CAN$1,289 billion. Figure 3 indicates that CDIA stock is directed overwhelmingly to high income countries, with 91% of CDIA allocated to this group of countries in 2018. Investment to high income countries is also on an upward trend, with 69% growth in stock between 2013 and 2018. This result is due largely to investment to the United States, which accounted for 46% of Canada’s total FDI in 2018.
To look at the trends observed in low and middle income countries in greater detail, Figure 4 excludes high income countries. Figure 6 also excludes upper middle income countries. It appears that Canada invests more in middle income countries (upper, then lower) than in low income countries. Between 2011 and 2018, the stock of Canadian investment rose 85% in upper middle income countries, 82% in lower middle income countries, and 40% in low income countries. The next sections will examine the trends in CDIA stock by income level and geographic area of the recipient country.
Figure 2 - Share of global inward FDI stock by income level

Text version
| Incomelevel | 2000 Share of inward FDI stock | 2017 Share of inward FDI stock |
|---|---|---|
| High | 0.88 | 0.78 |
| Upper middle | 0.09 | 0.16 |
| Lower middle | 0.03 | 0.05 |
| Low | 0.002 | 0.006 |
Figure 3 - Inward FDI stock from Canada, 2013-2018
Text version
| Year | High income | Upper middle income | Lower middle income | Low income |
|---|---|---|---|---|
| 2013 | 696 | 62.9 | 9.9 | 3.4 |
| 2014 | 759 | 62.8 | 13 | 2.6 |
| 2015 | 945 | 65.7 | 16.2 | 3.2 |
| 2016 | 983 | 65.3 | 18.4 | 3.5 |
| 2017 | 1022 | 65.3 | 17.6 | 3.8 |
| 2018 | 1175 | 81.2 | 17 | 3.4 |
Figure 4 - Inward FDI stock from Canada, 2011-2018

Text version
FDI stock, in billions CAD$
| Upper middle income | Lower middle income | Low income |
|---|---|---|
| 44.7 | 9.4 | 2.4 |
| 48 | 8.3 | 2.6 |
| 62.9 | 9.9 | 3.5 |
| 62.8 | 13 | 2.7 |
| 65.7 | 16.2 | 3.2 |
| 69.5 | 16.9 | 3.3 |
| 77.7 | 16.1 | 3.2 |
| 82.6 | 17 | 3.4 |
4.1 Canadian investment in upper middle income countries
In 2018, the stock of Canadian investment in upper middle income countries was CAN$83 billion, accounting for 6% of the total stock of Canadian investment abroad. The largest recipients of Canadian investment were Mexico (CAN$22 billion), Peru (CAN$14 billion), Brazil (CAN$14 billion) and China (CAN$13 billion). These four countries had more than 75% of the stock of Canadian investment abroad in upper middle income countries in 2018.
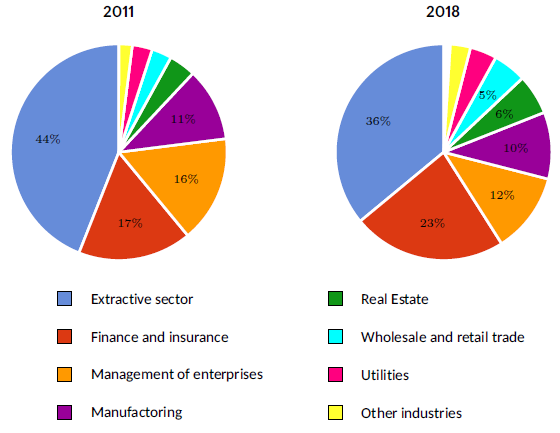
In terms of sectors (Figure 5), , mining, oil and gas extraction represented more than a third of the stock of Canadian investment in upper middle income countries in 2018, followed by finance and insurance, which represented close to a quarter. Management of companies and enterprises, and manufacturing received 12% and 10% of investment, respectively. Between 2011 and 2018, investment growth in the finance and insurance sector was faster than in the extractive sector. The share of investment directed to the extractive sector fell 8 percentage points, whereas that directed to the finance and insurance sector rose 6 percentage points. In nominal terms, the stock of investment in the extractive sector nonetheless increased by more than CAN$10 billion to CAN$30 billion from CAN$19.8 billion. In the finance and insurance sector, the stock was up from CAN$7.4 billion to CAN$19 billion, an increase of more than CAN$11 billion.
4.2 Canadian investment in lower middle income countries
In lower middle income countries, the stock of Canadian investment in 2018 was CAN$17 billion, or 1.3% of the total stock of Canadian investment abroad. Although significant growth has been recorded since 2011 (82%), the stock remains relatively low compared with the upper middle income country group. Among lower middle income countries, those with the highest stock of Canadian investment in 2018 were Mongolia (CAN$6 billion), Indonesia (CAN$3 billion), India (CAN$2.3 billion) and the Philippines (CAN$2.1 billion). These countries had more than 80% of the Canadian direct investment directed to lower middle income countries.
Figure 5 - Distribution of outward CDIA in upper middle income countries, by industry
Text version
Distribution of outward CDIA in upper middle income countries, by industry, 2011
| Sector | Share, in % |
|---|---|
| Extractive sector | 44 |
| Finance and insurance | 17 |
| Management of enterprises | 16 |
| Manufacturing | 11 |
| Real estate | 4 |
| Wholesale and retail trade | 3 |
| Utilities | 3 |
| Other industries | 2 |
Distribution of outward CDIA in upper middle income countries, by industry, 2018
| Sector | Share, in % |
|---|---|
| Extractive sector | 36 |
| Finance and insurance | 23 |
| Management of enterprises | 12 |
| Manufacturing | 10 |
| Real estate | 6 |
| Wholesale and retail trade | 5 |
| Utilities | 4 |
| Other industries | 3 |
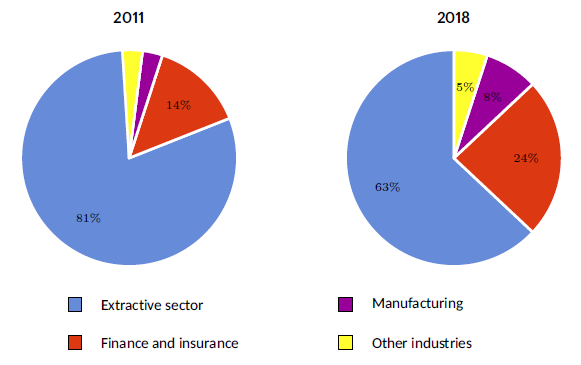
At the sector level (Figure 7), the majority of investment is allocated to the extractive sector. Between 2011 and 2018, the stock of investment in this sector increased from CAN$7.5 billion to CAN$11 billion. However, the share of investment directed to extractive industries decreased considerably between 2011 and 2018 (18 percentage points), in favour of finance and insurance (+10 percentage points) and manufacturing (+5 percentage points). Growth in the stock of investment in the extractive sector was therefore relatively slower.
It is also noteworthy that the share of investment in the extractive sector is higher than that in upper middle income countries. Investment is also less diverse. In 2018, more than 95% of investment in lower middle income countries was directed to three sectors, compared with seven sectors in upper middle income countries.
4.3 Canadian investment in low income countries
Last, in low income countries, the stock of Canadian investment was CAN$3.4 billion in 2018, accounting for just 0.3% of total CDIA stock. In addition, relatively weak growth of 40% was recorded between 2011 and 2018, a CAN$972 million increase in stock. The countries with the highest stock of Canadian investment in 2018 were Burkina Faso (CAN$1.8 billion), Senegal (CAN$982 million), Tanzania (CAN$341 million), and Eritrea (CAN$331 million). These countries received nearly all of the CDIA directed to low income countries.
With respect to sectors (Figure 8), both in 2011 and in 2018, nearly all Canadian direct investment was directed to the extractive sector.
Figure 6 - Inward FDI stock from Canada, 2011-2018

Text version
Inward FDI stock from Canada in billions, 2011-2018
| Income level | Year | FDI stock |
|---|---|---|
| Lower middle | 2011 | 9.4 |
| Lower middle | 2012 | 8.3 |
| Lower middle | 2013 | 9.9 |
| Lower middle | 2014 | 13 |
| Lower middle | 2015 | 16.2 |
| Lower middle | 2016 | 16.9 |
| Lower middle | 2017 | 16.1 |
| Lower middle | 2018 | 17 |
| Low | 2011 | 2.4 |
| Low | 2012 | 2.6 |
| Low | 2013 | 3.5 |
| Low | 2014 | 2.7 |
| Low | 2015 | 3.2 |
| Low | 2016 | 3.3 |
| Low | 2017 | 3.2 |
| Low | 2018 | 3.4 |
Figure 7 - Distribution of outward CDIA in lower middle income countries, by industry
Text version
Distribution of outward CDIA in lower middle income countries, by industry, 2011
| Sector | Share, in % |
|---|---|
| Extractive sector | 81 |
| Finance and insurance | 14 |
| Manufacturing | 3 |
| Other industries | 3 |
Distribution of outward CDIA in lower middle income countries, by industry, 2018
| Sector | Share, in % |
|---|---|
| Extractive sector | 63 |
| Finance and insurance | 24 |
| Manufacturing | 8 |
| Other industries | 5 |
Figure 8 - Distribution of outward CDIA in low income countries, by industry
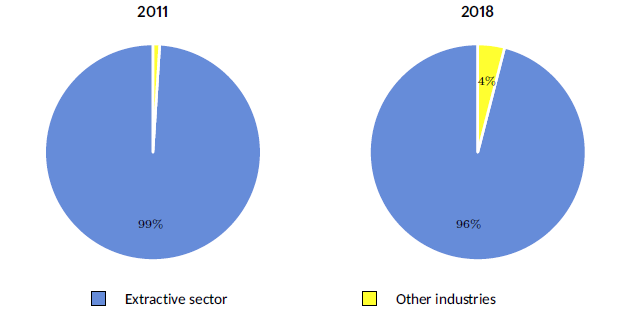
Text version
Distribution of outward CDIA in low income countries by industry, 2011
| Sector | Share, in % |
|---|---|
| Extractive sector | 99 |
| Other industries | 1 |
Distribution of outward CDIA in low income countries by industry, 2018
| Sector | Share, in % |
|---|---|
| Extractive sector | 96 |
| Other industries | 4 |
4.4 At a glance: Canadian Direct Investment Abroad according to the Income Level of the Recipient Country
It appears that CDIA is directed more to upper middle income countries than to lower middle income and low income countries. Greater sector investment diversification is also noted in upper middle income countries, compared with the two other country groups. Last, it is noteworthy that the lower the income level of the recipient country is, the higher the share of Canadian investment is directed to the extractive sector.
Table 2 provides a summary of countries with the largest share of CDIA stock for each country group in 2018.
5. Canadian Direct Investment Abroad: Outlook Based on the Geographic Area of the Recipient Country
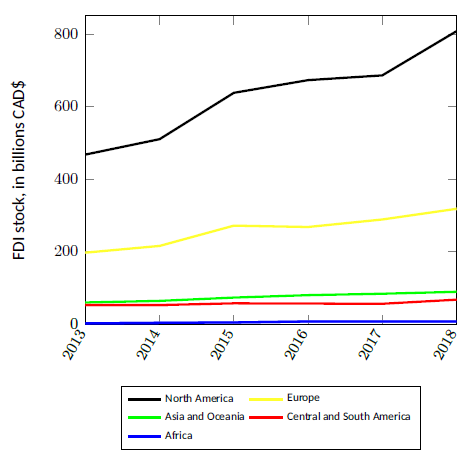
This section looks at CDIA stock distribution by geographic area. Figures 9 and 10 below show the CDIA stock trends between 2013 and 2018 by region. First, it appears that the vast majority of CDIA stock is directed to North America. Between 2013 and 2018, the share of total stock of Canadian investment abroad flowing into the United States increased from 39% to 46%. Mexico, meanwhile, had close to 2% of CDIA stock in 2018. The United Kingdom and LuxembourgFootnote 5 then followed in 2018 as the second and third main destinations of Canadian investment abroad, a reflection of Europe’s importance. Last, Asia and Oceania, Central and South America, and Africa all received a lower share of CDIA. These three regions, where the majority of low and middle income countries are located, are discussed in greater detail in the sections that follow.
Table 2 - Countries with the largest share of CDIA stock for each income group in 2018
Low Income
Country | Share of total CDIA stock |
|---|---|
Burkina Faso | 0.14% |
Senegal | 0.08% |
Tanzania | 0.03% |
Eritrea | 0.03% |
Ethiopia | 0.01% |
Lower middle Income
Country | Share of total CDIA stock |
|---|---|
Mongolia | 0.47% |
Indonesia | 0.25% |
India | 0.18% |
Philippines | 0.16% |
Kyrgyzstan | 0.10% |
Upper middle Income
Country | Share of total CDIA stock |
|---|---|
Mexico | 1.75% |
Peru | 1.11% |
Brazil | 1.10% |
China | 0.99% |
Colombia | 0.35% |
High Income
Country | Share of total CDIA stock |
|---|---|
United Kingdom | 8.48% |
Luxembourg | 6.99% |
Barbados | 5.03% |
Bermuda | 3.65% |
Data: Statistics Canada
5.1 Asia and Oceania
In 2018, the stock of Canadian investment in Asia and Oceania was CAN$89 billion, or 7% of total CDIA stock. Between 2011 and 2018, 59% growth was recorded. Of the region’s low and middle income countries, those with the highest CDIA stock in 2018 were China (14% of the region’s stock), Mongolia (7%), Indonesia (4%), Kazakhstan (3%), and India (3%). However, the growth recorded in the region seems to stem more from high income countries. Indeed, with the exception of China and India, the stock of Canadian investment in low and middle income countries in Asia and Oceania has increased only slightly or has decreased since 2013. Significant growth of more than 100% was, however, recorded in South Korea, India, China, Hong Kong, and Singapore (Table 3). Also, 35% of CDIA stock in Asia and Oceania is found in Australia, where growth between 2013 and 2018 was close to 60%.
Figure 9 - Inward FDI stock from Canada, 2013-2018
Text version
| Region | Year | FDI |
|---|---|---|
| North America | 2013 | 467.5 |
| North America | 2014 | 510 |
| North America | 2015 | 637.8 |
| North America | 2016 | 672.8 |
| North America | 2017 | 685.9 |
| North America | 2018 | 807.7 |
| Europe | 2013 | 196.9 |
| Europe | 2014 | 215.5 |
| Europe | 2015 | 271.4 |
| Europe | 2016 | 267.7 |
| Europe | 2017 | 288.4 |
| Europe | 2018 | 317.8 |
| Asia and Oceania | 2013 | 59.5 |
| Asia and Oceania | 2014 | 63.9 |
| Asia and Oceania | 2015 | 73 |
| Asia and Oceania | 2016 | 79.7 |
| Asia and Oceania | 2017 | 83.6 |
| Asia and Oceania | 2018 | 88.9 |
| Central and South America | 2013 | 52.7 |
| Central and South America | 2014 | 52.4 |
| Central and South America | 2015 | 57.1 |
| Central and South America | 2016 | 56.5 |
| Central and South America | 2017 | 55.9 |
| Central and South America | 2018 | 67.2 |
| Africa | 2013 | 1.8 |
| Africa | 2014 | 3.3 |
| Africa | 2015 | 4.4 |
| Africa | 2016 | 7 |
| Africa | 2017 | 7.3 |
| Africa | 2018 | 7.2 |
Figure 10 - Inward FDI stock from Canada, 2011-2018

Text version
FDI stock, in billions CAD$
| Region | Year | FDI |
|---|---|---|
| Asia and Oceania | 2011 | 55.9 |
| Asia and Oceania | 2012 | 58.5 |
| Asia and Oceania | 2013 | 54.8 |
| Asia and Oceania | 2014 | 59.6 |
| Asia and Oceania | 2015 | 70.8 |
| Asia and Oceania | 2016 | 78.3 |
| Asia and Oceania | 2017 | 84.1 |
| Asia and Oceania | 2018 | 88.7 |
| Central and South America | 2011 | 34 |
| Central and South America | 2012 | 43.2 |
| Central and South America | 2013 | 52.7 |
| Central and South America | 2014 | 52.4 |
| Central and South America | 2015 | 57.1 |
| Central and South America | 2016 | 58.4 |
| Central and South America | 2017 | 67.9 |
| Central and South America | 2018 | 67.2 |
| Africa | 2011 | 4.3 |
| Africa | 2012 | 1.4 |
| Africa | 2013 | 1.8 |
| Africa | 2014 | 3.3 |
| Africa | 2015 | 4.4 |
| Africa | 2016 | 6.5 |
| Africa | 2017 | 7.3 |
| Africa | 2018 | 7.2 |
Of the ten countries in Asia and Oceania receiving the largest share of CDIA in 2018 (Table 3), ), Australia, Hong Kong, Japan, Singapore, and South Korea had 4.8% of the stock of Canadian investment directed to high income countries. This share is small mainly because most Canadian investment in high income countries is directed to the United States and Europe. China and Kazakhstan, meanwhile, had 19% of the CDIA stock directed to upper middle income countries, whereas Mongolia, Indonesia, and India had 68% of the Canadian investment directed to lower middle income countries. Therefore, the majority of CDIA stock directed to lower middle income countries is in Asia and Oceania.
Table 3 - Ten countries in Asia and Oceania receiving the largest share of CDIA in 2018
Country | Income | CDIA stock, in billions CAD$ | Share of stock in the region | Growth rate of stock 2013-2018 |
|---|---|---|---|---|
Australia | High | 31.2 | 35.1% | 59.2% |
China | Upper middle | 12.7 | 14.3% | 110.5% |
Hong Kong | High | 9.1 | 10.2% | 105.6% |
Japan | High | 7.6 | 8.5% | 23.5% |
Mongolia | Lowe middle | 6.1 | 6.9% | -8.0% |
Singapore | High | 5.6 | 6.3% | 102.3% |
Indonesia | Lower middle | 3.3 | 3.7% | -13.3% |
Kazakhstan | Upper middle | 2.7 | 3.0% | 7.1% |
South Korea | High | 2.3 | 2.6% | 340.8% |
India | Lower middle | 2.3 | 2.6% | 123.9% |
Data: Statistics Canada
In terms of sectors, and as shown in Figure 11, the first observation is a slight decrease in Canadian investment in the extractive sector between 2012 and 2018. In 2012, 27% of CDIA stock was in the extractive sector, compared to 24% in 2018. Canadian investment stocks in manufacturing and in management of companies and enterprises lost ground between 2012 and 2018. The finance and insurance and real estate sectors managed to attract a significant share of Canadian investment, with respective increases of 6 and 9 percentage points. Last, the “other industries” category comprised eight sectors in 2018, namely, in order of importance, information and communication technologies (ICT), information and cultural industries, professional, scientific and technical services, accommodation and food services, retail trade, construction, and agriculture, forestry, fishing and hunting.
5.2 Central and South America
In 2018, the stock of Canadian investment in Central and South America was CAN$67 billion, or 5% of total CDIA stock. Between 2011 and 2018, 98% growth was recorded. In 2018, more than 90% of the stock of Canadian investment in Central and South America was concentrated in five countries, namely Chile (32% of the region’s stock), Peru (21%), Brazil (21%), Panama (10%) and Colombia (7%), all upper middle income or high income countries (Table 4). In addition, the data suggest that CDIA stock growth in Central and South America is largely attributable to higher investment in Chile and Peru. Between 2016 and 2017 in particular, CDIA stock in Chile increased by close to CAN$900 million.
Figure 11 - Distribution of outward CDIA in the region Asia and Oceania, by industry
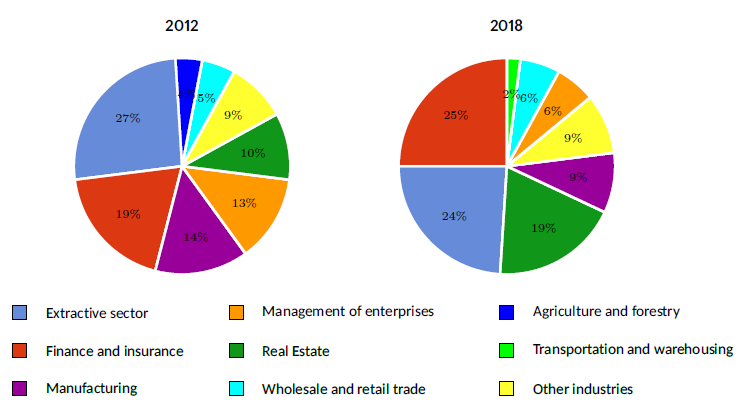
Text version
Distribution of outward CDIA in the region Asia and Oceania, by industry, 2012
| Sector | Share, in % |
|---|---|
| Extractive sector | 27 |
| Finance and insurance | 19 |
| Manufacturing | 14 |
| Management of enterprises | 13 |
| Real estate | 10 |
| Other industries | 9 |
| Wholesale and retail trade | 5 |
| Agriculture and forestry | 4 |
Distribution of outward CDIA in the region Asia and Oceania, by industry, 2018
| Sector | Share, in % |
|---|---|
| Extractive sector | 24 |
| Finance and insurance | 25 |
| Manufacturing | 9 |
| Management of enterprises | 6 |
| Real estate | 19 |
| Other industries | 9 |
| Wholesale and retail trade | 6 |
| Transportation and warehousing | 2 |
With respect to sectors (Figure 12), ), the significance of the main industries that attract Canadian investment, that is, the extractive and finance and insurance sectors, remained stable between 2011 and 2018. Furthermore, the share of Canadian investment in the manufacturing sector dropped substantially from 16% in 2011 to 6.3% in 2018, in favour of wholesale and retail trade, whose share in CDIA stock increased from 4.6% to 8.8%. All told, it appears that 65% of Canadian direct investment in Central and South America remained concentrated in the extractive and finance and insurance sectors between 2011 and 2018.
5.3 Africa
In 2018, the stock of Canadian direct investment in Africa was CAN$7 billion, approximately CAN$60 billion less than in Central and South America. This accounted for just 0.56% of total CDIA stock. Between 2011 and 2018, 66% growth in Canadian investment was recorded. Countries that received a large share of Canadian investment in Africa in 2018 include Mauritius (35% of the region’s stock), Burkina Faso (25%), South Africa (23%), and Senegal (14%).
Of the ten countries with the highest share of CDIA in Africa in 2018 (Table 5), Mauritius, South Africa and Namibia had 6% of the CDIA stock directed to upper middle income countries. Côte d’Ivoire, Nigeria and Botswana, meanwhile, had 8% of the Canadian investment in lower middle income countries. Last, Burkina Faso, Senegal, Tanzania and Eritrea had nearly all of the CDIA stock directed to low income countries.
With respect to sectors (Figure 13), ), both in 2011 and in 2018, Canadian direct investment directed to Africa was not very diversified. More than half of CDIA stock was in the extractive sector.
Table 4 - Ten countries in Central and South America receiving the largest share of CDIA in 2018
Country | Income | CDIA stock, in billions CAD$ | Share of stock in the region | Growth rate of stock 2013-2018 |
|---|---|---|---|---|
Chili | High | 21.5 | 32.0% | 18.0% |
Peru | Upper middle | 14.2 | 21.2% | 61.7% |
Brazil | Upper middle | 14.1 | 21.0% | -13.9% |
Panama | High | 6.7 | 10.0% | 6,676.8% |
Colombia | Upper middle | 4.5 | 6.6% | 22.2% |
Ecuador | Upper middle | 2.0 | 3.0% | 2,283.5% |
Uruguay | High | 1.0 | 1.5% | 4.9% |
Argentina | High | 0.9 | 1.3% | -65.7% |
Salvador | Lower middle | 0.6 | 0.9% | 39.6% |
Honduras | Lower middle | 0.5 | 0.7% | 116.6% |
Data: Statistics Canada
The share of investment directed to the finance and insurance sector, meanwhile, increased 10 percentage points. Last, Canadian investment in management of companies and enterprises occupied a smaller share in 2018 than in 2011.
5.4 At a glance: Canadian direct investment abroad according to the geographic area of the recipient country
When approached from a regional perspective, CDIA follows a trend similar to that by income level of the recipient country, whereby countries/regions with higher income receive more investment from Canada. The example of Africa, which receives a significantly lower share of Canadian direct investment than other regions, illustrates this observation. From a sector standpoint, Canadian investment in Africa also lacks diversification, with the extractive sector absorbing most of the stock. Therefore, here again, the data show that the lower the income level of the recipient country, the higher the investment directed to the extractive sector.
6. Comparison of Outward Foreign Direct Investment from G7 Countries
This section compares the trend in the stock of outward FDI from G7 countries, to assess Canada’s position relative to other countries. It examines FDI directed to Asia, Central and South America, and Africa from France, Germany, the United States, Japan, Italy, the United Kingdom, and Canada.
Figure 12 - Distribution of outward CDIA in the region Central and South America, by industry

Text version
Distribution of outward CDIA in the region Central and South America, by industry, 2011
| Sector | Share, in % |
|---|---|
| Extractive sector | 43 |
| Finance and insurance | 22 |
| Manufacturing | 16 |
| Wholesale and retail trade | 5 |
| Real estate | 5 |
| Utilities | 4 |
| Management of enterprises | 4 |
| Other industries | 3 |
Distribution of outward CDIA in the region Central and South America, by industry, 2018
| Sector | Share, in % |
|---|---|
| Extractive sector | 44 |
| Finance and insurance | 24 |
| Manufacturing | 6 |
| Wholesale and retail trade | 9 |
| Real estate | 2 |
| Utilities | 5 |
| Management of enterprises | 4 |
| Other industries | 5 |
Figure 13 - Distribution of outward CDIA in the region Africa, by industry
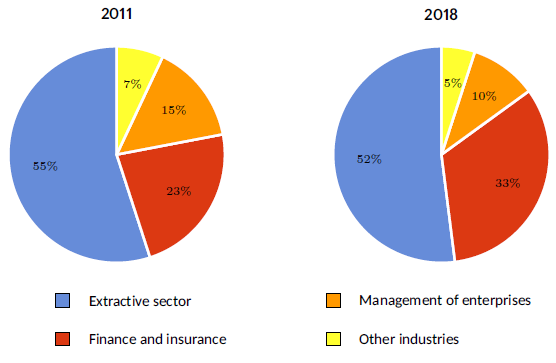
Text version
Distribution of outward CDIA in Africa by industry, 2011
| Sector | Share, in % |
| Extractive sector | 55 |
| Finance and insurance | 23 |
| Management of enterprises | 15 |
| Other industries | 7 |
Distribution of outward CDIA in Africa by industry, 2018
| Sector | Share, in % |
| Extractive sector | 52 |
| Finance and insurance | 33 |
| Management of enterprises | 10 |
| Other industries | 5 |
Table 5: Ten countries in Africa receiving the largest share of CDIA in 2018
Country | Income | CDIA stock, in billions CAD$ | Share of stock in the region | Growth rate of stock 2013-2018 |
|---|---|---|---|---|
Mauritius | Upper middle | 2.6 | 35.5% | 12,047.6% |
Burkina Faso | Low | 1.8 | 25.3% | 43.5% |
South Africa | Upper middle | 1.6 | 22.6% | -31.1% |
Senegal | Low | 1.0 | 13.7% | N/A |
Côte d’Ivoire | Lower middle | 0.7 | 9.0% | 77.6% |
Nigeria | Lower middle | 0.5 | 7.0% | 255.3% |
Namibia | Upper middle | 0.5 | 6.7% | 1,812.0% |
Tanzania | Low | 0.3 | 4.7% | -63.4% |
Eritrea | Low | 0.3 | 4.6% | 3.1% |
Botswana | Lower middle | 0.2 | 3.4% | 24,300.0% |
Data: Statistics Canada
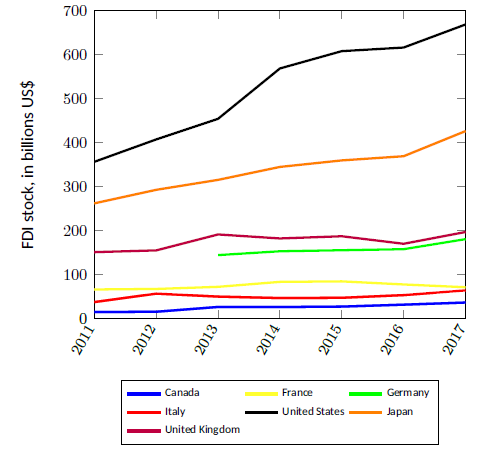
6.1 Outward foreign direct investment from G7 countries in Asia
Of the G7 countries, the United States invests the most in Asia, with a total investment stock in 2017 of close to US$700 billion (Figure 14). More than 71% of this stock was directed to Singapore, whereas 19% went to Japan and 16%, to China. Japan is the second largest investor in Asia. Of the US$426 billion invested in Asia by Japan in 2017, 27% went to China. Last, Canada is the G7 country that invested the least in Asia during the period 2011-2017. It is worth recalling that China, Hong Kong and Japan receive the most Canadian investment abroad in Asia (c.f. Table 3).
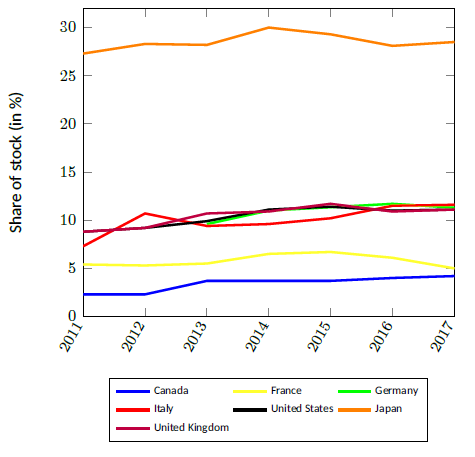
For each G7 country, Figure 15 shows the share of its total stock of FDI directed to Asia. We see that Japan ranks first. The share of Japan’s total FDI stock directed to Asia fluctuated between 27% and 30% for the period 2011-2017. The share of total stock of FDI directed to Asia from other countries remains fairly low, generally below 10%. Despite a slight increase since 2011, Canada ranks last in that respect. The share of CDIA stock directed to Asia increased from 2.3% in 2011 to 4.2% in 2017.
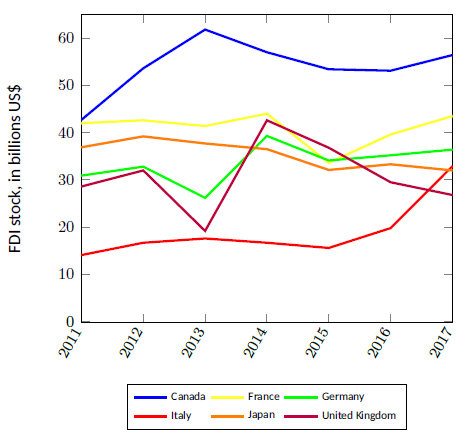
6.2 Outward foreign direct investment from G7 countries in Central and South America
Figures 16 and 17 show the trends in outward FDI directed to Central and South America for all G7 countries (Figure 16) and excluding the United States (Figure 17). We see from Figure 16 that the FDI stock of the United States directed to Central and South America is much higher than the stock of the other G7 countries. In 2017, the FDI stock of the United States in Central and South America was US$256 billion, whereas the stock of the second ranking country, that is, Canada, was US$56 billion. In 2017, more than a quarter of the FDI stock of the United States in Central and South America was in Brazil, and 10% of that stock was in Chile. It is also worth recalling that Chile, Peru and Brazil are the countries with the highest Canadian investment in Central and South America (c.f. Table 4). Last, Figure 17 reveals that Italy, which ranked last between 2011 and 2016, overtook the United Kingdom and Japan in 2017. This is due to the more than US$10 billion increase in Italy’s stock of FDI directed to Chile in 2017.
Figure 14 - Outward FDI stock from G7 countries in Asia, 2011-2017
Text version
| Country | Year | FDI stock, in billions US$ |
| Canada | 2011 | 15.5 |
| Canada | 2012 | 16.2 |
| Canada | 2013 | 27.1 |
| Canada | 2014 | 26.9 |
| Canada | 2015 | 27.9 |
| Canada | 2016 | 32.3 |
| Canada | 2017 | 37.1 |
| France | 2011 | 66.8 |
| France | 2012 | 68 |
| France | 2013 | 72.8 |
| France | 2014 | 84.1 |
| France | 2015 | 85.2 |
| France | 2016 | 78.2 |
| France | 2017 | 71.9 |
| Germany | 2013 | 144.9 |
| Germany | 2014 | 153.6 |
| Germany | 2016 | 158.3 |
| Germany | 2017 | 181.1 |
| Italy | 2011 | 38.2 |
| Italy | 2012 | 57.4 |
| Italy | 2013 | 50.6 |
| Italy | 2014 | 47.3 |
| Italy | 2015 | 47.9 |
| Italy | 2016 | 54 |
| Italy | 2017 | 64.7 |
| USA | 2011 | 356.9 |
| USA | 2012 | 407.7 |
| USA | 2013 | 454.6 |
| USA | 2014 | 568.9 |
| USA | 2015 | 608.2 |
| USA | 2016 | 616.4 |
| USA | 2017 | 668.7 |
| Japan | 2011 | 262.5 |
| Japan | 2012 | 293.2 |
| Japan | 2013 | 315.8 |
| Japan | 2014 | 345.2 |
| Japan | 2015 | 360 |
| Japan | 2016 | 369.5 |
| Japan | 2017 | 426.5 |
| UK | 2011 | 151.6 |
| UK | 2012 | 155.6 |
| UK | 2013 | 191.8 |
| UK | 2014 | 182.7 |
| UK | 2015 | 187.7 |
| UK | 2016 | 170.6 |
| UK | 2017 | 197.3 |
Figure 15 - Share of outward FDI total stock from G7 countries in Asia, 2011-2017
Text version
| Country | Year | Share of stock, in % |
|---|---|---|
| Canada | 2011 | 2.3 |
| Canada | 2012 | 2.3 |
| Canada | 2013 | 3.7 |
| Canada | 2014 | 3.7 |
| Canada | 2015 | 3.7 |
| Canada | 2016 | 4 |
| Canada | 2017 | 4.2 |
| France | 2011 | 5.4 |
| France | 2012 | 5.3 |
| France | 2013 | 5.5 |
| France | 2014 | 6.5 |
| France | 2015 | 6.7 |
| France | 2016 | 6.1 |
| France | 2017 | 5 |
| Germany | 2013 | 9.6 |
| Germany | 2014 | 11 |
| Germany | 2016 | 11.7 |
| Germany | 2017 | 11.3 |
| Italy | 2011 | 7.3 |
| Italy | 2012 | 10.7 |
| Italy | 2013 | 9.4 |
| Italy | 2014 | 9.6 |
| Italy | 2015 | 10.2 |
| Italy | 2016 | 11.5 |
| Italy | 2017 | 11.6 |
| USA | 2011 | 8.8 |
| USA | 2012 | 9.2 |
| USA | 2013 | 9.9 |
| USA | 2014 | 11.1 |
| USA | 2015 | 11.4 |
| USA | 2016 | 11 |
| USA | 2017 | 11.1 |
| Japan | 2011 | 27.3 |
| Japan | 2012 | 28.3 |
| Japan | 2013 | 28.2 |
| Japan | 2014 | 30 |
| Japan | 2015 | 29.3 |
| Japan | 2016 | 28.1 |
| Japan | 2017 | 28.5 |
| UK | 2011 | 8.8 |
| UK | 2012 | 9.2 |
| UK | 2013 | 10.7 |
| UK | 2014 | 10.9 |
| UK | 2015 | 11.7 |
| UK | 2016 | 10.9 |
| UK | 2017 | 11.1 |
Figure 16 - Outward FDI stock from G7 countries in Central and South America, 2011-2017

Text version
| Country | Year | FDI stock, in billions US$ |
|---|---|---|
| Canada | 2011 | 42.7 |
| Canada | 2012 | 53.6 |
| Canada | 2013 | 61.8 |
| Canada | 2014 | 57 |
| Canada | 2015 | 53.4 |
| Canada | 2016 | 53.1 |
| Canada | 2017 | 56.4 |
| France | 2011 | 42 |
| France | 2012 | 42.6 |
| France | 2013 | 41.4 |
| France | 2014 | 44 |
| France | 2015 | 33.6 |
| France | 2016 | 39.6 |
| France | 2017 | 43.5 |
| Germany | 2011 | 30.9 |
| Germany | 2012 | 32.8 |
| Germany | 2013 | 26.2 |
| Germany | 2014 | 39.3 |
| Germany | 2015 | 34.1 |
| Germany | 2016 | 35.2 |
| Germany | 2017 | 36.4 |
| Italy | 2011 | 14.1 |
| Italy | 2012 | 16.7 |
| Italy | 2013 | 17.6 |
| Italy | 2014 | 16.7 |
| Italy | 2015 | 15.6 |
| Italy | 2016 | 19.8 |
| Italy | 2017 | 32.9 |
| USA | 2011 | 247.8 |
| USA | 2012 | 262.3 |
| USA | 2013 | 238 |
| USA | 2014 | 250.3 |
| USA | 2015 | 242 |
| USA | 2016 | 247.4 |
| USA | 2017 | 255.7 |
| Japan | 2011 | 36.9 |
| Japan | 2012 | 39.2 |
| Japan | 2013 | 37.7 |
| Japan | 2014 | 36.5 |
| Japan | 2015 | 32.1 |
| Japan | 2016 | 33.3 |
| Japan | 2017 | 32 |
| UK | 2011 | 28.6 |
| UK | 2012 | 32 |
| UK | 2013 | 19.2 |
| UK | 2014 | 42.6 |
| UK | 2015 | 36.8 |
| UK | 2016 | 29.5 |
| UK | 2017 | 26.8 |
Figure 18 shows that Canada directed the highest share of total FDI stock to Central and South America for the entire period from 2011 to 2017. Nevertheless, this share is still rather low, peaking at 8.4% in 2013. Since that peak, the share of CDIA stock in Central and South America has been declining. It also appears that the share of direct investment stock directed to Central and South America for all G7 countries, except for Italy, is also down.
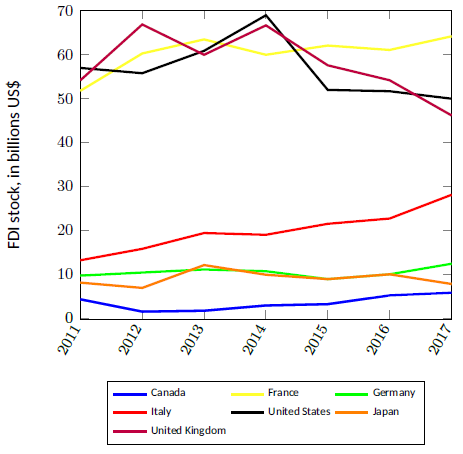
6.3 Outward foreign direct investment from G7 countries in Africa
Figure 19 shows France, the United Kingdom and the United States invest the most in Africa. In 2017, France was the lead investor, with a total direct investment stock in Africa of US$64 billion. The United States and the United Kingdom, whose investment stock in Africa has been decreasing since 2014, had an investment stock in Africa of US$50 billion and US$46 billion, respectively, in 2017. Just like in Asia, Canada ranks last here. In 2017, its CDIA stock in Africa was just US$5.8 billion. Nevertheless, after falling in 2012, Canada’s direct investment stock in Africa has since risen slightly.
Last, Figure 20 shows that Italy, France and the United Kingdom invest the largest share of their total FDI in Africa. While this share has been declining in France and the United Kingdom in recent years, it has been increasing in Italy. Canada ranked last between 2011 and 2016 and overtook Japan in 2017. That said, the share of total FDI from G7 countries directed to Africa remains fairly low. The peak was reached by Italy in 2017, when the share of its total FDI directed to Africa was a mere 5%. It therefore seems that Africa is not a very popular destination for investment from all G7 countries.
Figure 17 - Outward FDI stock from G7 countries in Central and South America, 2011-2017
Text version
| Country | Year | FDI stock, in billions US$ |
|---|---|---|
| Canada | 2011 | 42.7 |
| Canada | 2012 | 53.6 |
| Canada | 2013 | 61.8 |
| Canada | 2014 | 57 |
| Canada | 2015 | 53.4 |
| Canada | 2016 | 53.1 |
| Canada | 2017 | 56.4 |
| France | 2011 | 42 |
| France | 2012 | 42.6 |
| France | 2013 | 41.4 |
| France | 2014 | 44 |
| France | 2015 | 33.6 |
| France | 2016 | 39.6 |
| France | 2017 | 43.5 |
| Germany | 2011 | 30.9 |
| Germany | 2012 | 32.8 |
| Germany | 2013 | 26.2 |
| Germany | 2014 | 39.3 |
| Germany | 2015 | 34.1 |
| Germany | 2016 | 35.2 |
| Germany | 2017 | 36.4 |
| Italy | 2011 | 14.1 |
| Italy | 2012 | 16.7 |
| Italy | 2013 | 17.6 |
| Italy | 2014 | 16.7 |
| Italy | 2015 | 15.6 |
| Italy | 2016 | 19.8 |
| Italy | 2017 | 32.9 |
| Japan | 2011 | 36.9 |
| Japan | 2012 | 39.2 |
| Japan | 2013 | 37.7 |
| Japan | 2014 | 36.5 |
| Japan | 2015 | 32.1 |
| Japan | 2016 | 33.3 |
| Japan | 2017 | 32 |
| UK | 2011 | 28.6 |
| UK | 2012 | 32 |
| UK | 2013 | 19.2 |
| UK | 2014 | 42.6 |
| UK | 2015 | 36.8 |
| UK | 2016 | 29.5 |
| UK | 2017 | 26.8 |
Figure 18 - Share of outward FDI total stock from G7 countries in Central and South America, 2011-2017

Text version
| Country | Year | Share of stock, in % |
|---|---|---|
| Canada | 2011 | 6.5 |
| Canada | 2012 | 7.6 |
| Canada | 2013 | 8.5 |
| Canada | 2014 | 7.8 |
| Canada | 2015 | 7.1 |
| Canada | 2016 | 6.6 |
| Canada | 2017 | 6.3 |
| France | 2011 | 3.4 |
| France | 2012 | 3.3 |
| France | 2013 | 3.1 |
| France | 2014 | 3.4 |
| France | 2015 | 2.6 |
| France | 2016 | 3.1 |
| France | 2017 | 3 |
| Germany | 2011 | 2.8 |
| Germany | 2012 | 2.8 |
| Germany | 2013 | 1.7 |
| Germany | 2014 | 2.8 |
| Germany | 2015 | 2.5 |
| Germany | 2016 | 2.6 |
| Germany | 2017 | 2.3 |
| Italy | 2011 | 2.7 |
| Italy | 2012 | 3.1 |
| Italy | 2013 | 3.3 |
| Italy | 2014 | 3.4 |
| Italy | 2015 | 3.3 |
| Italy | 2016 | 4.2 |
| Italy | 2017 | 5.9 |
| USA | 2011 | 6.1 |
| USA | 2012 | 5.9 |
| USA | 2013 | 5.2 |
| USA | 2014 | 4.9 |
| USA | 2015 | 4.6 |
| USA | 2016 | 4.4 |
| USA | 2017 | 4.3 |
| Japan | 2011 | 3.8 |
| Japan | 2012 | 3.8 |
| Japan | 2013 | 3.4 |
| Japan | 2014 | 3.2 |
| Japan | 2015 | 2.6 |
| Japan | 2016 | 2.5 |
| Japan | 2017 | 2.1 |
| UK | 2011 | 1.7 |
| UK | 2012 | 1.9 |
| UK | 2013 | 1.1 |
| UK | 2014 | 2.5 |
| UK | 2015 | 2.3 |
| UK | 2016 | 1.9 |
| UK | 2017 | 1.5 |
Figure 19 - Outward FDI stock from G7 countries in Africa, 2011-2017
Text version
| Country | Year | FDI stock, in billions US$ |
|---|---|---|
| Canada | 2011 | 4.3 |
| Canada | 2012 | 1.5 |
| Canada | 2013 | 1.7 |
| Canada | 2014 | 2.9 |
| Canada | 2015 | 3.2 |
| Canada | 2016 | 5.2 |
| Canada | 2017 | 5.8 |
| France | 2011 | 51.8 |
| France | 2012 | 60.3 |
| France | 2013 | 63.5 |
| France | 2014 | 60 |
| France | 2015 | 62.1 |
| France | 2016 | 61.1 |
| France | 2017 | 64.2 |
| Germany | 2011 | 9.7 |
| Germany | 2012 | 10.4 |
| Germany | 2013 | 11.1 |
| Germany | 2014 | 10.7 |
| Germany | 2015 | 8.9 |
| Germany | 2016 | 10 |
| Germany | 2017 | 12.4 |
| Italy | 2011 | 13.2 |
| Italy | 2012 | 15.8 |
| Italy | 2013 | 19.4 |
| Italy | 2014 | 19 |
| Italy | 2015 | 21.5 |
| Italy | 2016 | 22.7 |
| Italy | 2017 | 28.1 |
| USA | 2011 | 57 |
| USA | 2012 | 55.8 |
| USA | 2013 | 60.9 |
| USA | 2014 | 69 |
| USA | 2015 | 52 |
| USA | 2016 | 51.7 |
| USA | 2017 | 50 |
| Japan | 2011 | 8.1 |
| Japan | 2012 | 6.9 |
| Japan | 2013 | 12.1 |
| Japan | 2014 | 9.9 |
| Japan | 2015 | 8.9 |
| Japan | 2016 | 10 |
| Japan | 2017 | 7.8 |
| UK | 2011 | 54.2 |
| UK | 2012 | 66.9 |
| UK | 2013 | 60 |
| UK | 2014 | 66.7 |
| UK | 2015 | 57.6 |
| UK | 2016 | 54.2 |
| UK | 2017 | 46.2 |
Figure 20 - Share of outward FDI total stock from G7 countries in Africa, 2011-2017

Text version
| Country | Year | Share of stock, in % |
|---|---|---|
| Canada | 2011 | 0.6 |
| Canada | 2012 | 0.2 |
| Canada | 2013 | 0.2 |
| Canada | 2014 | 0.4 |
| Canada | 2015 | 0.4 |
| Canada | 2016 | 0.6 |
| Canada | 2017 | 0.6 |
| France | 2011 | 4.2 |
| France | 2012 | 4.7 |
| France | 2013 | 4.8 |
| France | 2014 | 4.6 |
| France | 2015 | 4.9 |
| France | 2016 | 4.8 |
| France | 2017 | 4.4 |
| Germany | 2011 | 0.9 |
| Germany | 2012 | 0.9 |
| Germany | 2013 | 0.7 |
| Germany | 2014 | 0.8 |
| Germany | 2015 | 0.7 |
| Germany | 2016 | 0.7 |
| Germany | 2017 | 0.8 |
| Italy | 2011 | 2.5 |
| Italy | 2012 | 3 |
| Italy | 2013 | 3.6 |
| Italy | 2014 | 3.9 |
| Italy | 2015 | 4.6 |
| Italy | 2016 | 4.8 |
| Italy | 2017 | 5 |
| USA | 2011 | 1.4 |
| USA | 2012 | 1.3 |
| USA | 2013 | 1.3 |
| USA | 2014 | 1.4 |
| USA | 2015 | 1 |
| USA | 2016 | 0.9 |
| USA | 2017 | 0.8 |
| Japan | 2011 | 0.8 |
| Japan | 2012 | 0.6 |
| Japan | 2013 | 1.1 |
| Japan | 2014 | 0.9 |
| Japan | 2015 | 0.7 |
| Japan | 2016 | 0.8 |
| Japan | 2017 | 0.5 |
| UK | 2011 | 3.1 |
| UK | 2012 | 4 |
| UK | 2013 | 3.3 |
| UK | 2014 | 4 |
| UK | 2015 | 3.6 |
| UK | 2016 | 3.5 |
| UK | 2017 | 2.6 |
7. Conclusion
Increasing FDI in developing countries is an integral part of the international agenda to achieve the SDGs. Just like most donor countries, Canada tries to put in place means of combining official development assistance with other types of financing, including private investment. This report provides a descriptive analysis of FDI in developing countries. It starts by looking at the distribution of global investment according to the income level of the recipient country. It then details the distribution of CDIA, (1) by income level of the recipient country and (2) by geographic area of the recipient country. Last, it compares the trends in outward FDI from G7 countries in Asia, Central and South America, and Africa.
The report reveals that the level of Canadian investment in developing countries is fairly low. In 2018, low and middle income countries received less than 10% of the stock of Canadian investment abroad. In addition, just 0.56% of CDIA stock was directed to Africa. At the sectoral level, the level of investment diversification decreases with income. In low income countries, 96% of Canadian investment stock was in the extractive sector. Last, compared to other G7 countries, Canada invests a considerable share of its total FDI in Central and South America, but a relatively small share in Asia and Africa.
Therefore, to contribute to the SDGs through higher private investment in developing countries, Canada will have to develop a strategy to improve its presence in the least developed regions. It will also have to find means of promoting investment in sectors other than extractive industries that are likely to generate positive externalities and benefits for local populations.
References
Caseilla, B. and L. Formenti. (2018). FDI in the digital economy: A shift to asset light international footprints. Transnational Corporations, 25(1), 101–30.
Farla, K., de Crombrugghe, D. and B. Verspagen. (2016). Institutions, foreign direct investment, and domestic investment: Crowding out or crowding in ? World Development, 88, 1–9.
Hirshhorn, R. (2015). Review of the literature on foreign direct investment.
de Mello, L. R. Jr. (1997). Foreign direct investment in developing countries and growth: A selective survey. The Journal of Development Studies, 34(1), 1–34.
OECD. (2018b). FDI stocks. Page consulted: https://data.oecd.org/fdi/fdistocks.htm# indicator chart
OECD. (2018a). OECD DAC Blended Finance Principles for Unlocking Commercial Finance for the Sustainable Development Goals. Document consulted: http://www.oecd.org/dac/financingsustainabledevelopment/developmentfinancetopics/OECDBlendedFinancePrinciples.pdf
Pineli, A., Narula, R. and R. Belderbos. (2019). FDI, multinationals and structural change in developing countries. UNU Merit, Working paper series, 2019 004.
Rostami, H., Kalbfleisch, R. and Q. Xu. (2016). The role of FDI in fostering development.
Statistics Canada. (2018). Foreign Direct Investment. Page consulted: https://www150.statcan.gc.ca/n1/pub/13607x/2016001/48eng.htm
UNCTAD. (2017). Methodological Note. World Investment Report 2O17. Page consulted: https://unctad.org/en/PublicationChapters/wir2017chMethodNote_en.pdf
UNCTAD. (2018). World Investment Report 2018. ISBN 978 92 1 112926 7.
UNCTAD. (2019). UNCTADstat. Page consulted: https://unctadstat.unctad.org/wds/TableViewer/tableView.aspx?ReportId=96740
United Nations. (2019). Sustainable Development Goals. Page consulted: https://www.un.org/sustainabl development/globalpartnerships/
- Date Modified: