
Highlights of Canada’s Merchandise Trade Performance in 2021
Kevin Jiang
April 2022
Table of contents
Highlights
- Canada’s merchandise trade posted historical growth in 2021. Exports were up 20.8% compared to 2020 to reach $631 billion in value, a 6.6% increase over the pre-pandemic record high in 2019; imports rose 13.0% to $614 billion, also a new record high.
- While prices also impacted imports, most of the growth in exports in 2021 was due to strengthened commodity prices. In real terms, Canadian exports and imports were up by 1.2% and 9.2% from 2020, respectively.
- Exports improved in every product sector except for motor vehicles and parts, with growth mainly driven by exports of energy, forestry, and metal and non-metallic mineral products. On the import side, nine out of eleven sectors improved in 2021, with significant contributions from metal and non-metallic mineral products, basic and industrial chemical, plastic and rubber products, and consumer goods.
- Compared to the year prior, bilateral trade improved with every major region in 2021. Higher trade with the United States was the main reason for the overall growth, but there was also large growth in trade with China and Mexico.
OverviewFootnote 1
After recording the second largest one-year decline on record in 2020 (the largest was in 2009), Canada’s merchandise exports and imports both posted historical growth in 2021, increasing by 20.8% and 13.0%, respectively. As a result, both Canadian exports and imports surpassed their respective pre-pandemic levels and reached new record highs (see Figure 1). Furthermore, as the growth in exports outpaced that of imports, Canada’s historical $20.4 billion merchandise trade deficit in 2020 turned to a trade surplus of $17.7 billion in 2021 the largest trade surplus since 2008.
Figure 1. After histroical growth in 2021, Canada’s merchandise exports and imports surpassed pre-pandemic levels and reached new record highs 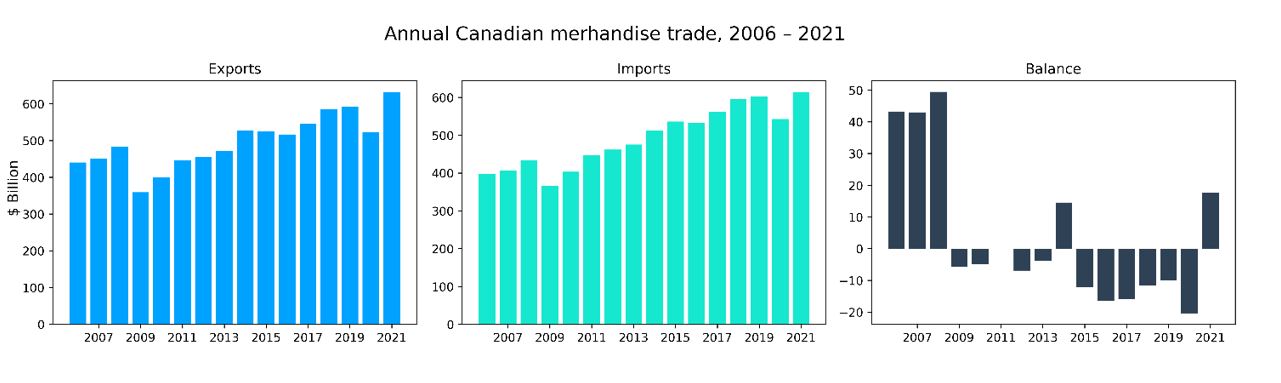
Text version
| Balance ($B) | Export ($B) | Import ($B) | |
|---|---|---|---|
| 2006 | 43 | 440 | 397 |
| 2007 | 43 | 450 | 407 |
| 2008 | 49 | 483 | 434 |
| 2009 | -6 | 360 | 365 |
| 2010 | -5 | 399 | 404 |
| 2011 | 0 | 447 | 447 |
| 2012 | -7 | 455 | 462 |
| 2013 | -4 | 472 | 476 |
| 2014 | 15 | 527 | 512 |
| 2015 | -12 | 524 | 536 |
| 2016 | -16 | 517 | 533 |
| 2017 | -16 | 546 | 562 |
| 2018 | -12 | 584 | 596 |
| 2019 | -10 | 592 | 602 |
| 2020 | -20 | 523 | 543 |
| 2021 | 18 | 631 | 614 |
Data: Statistics Canada Table 12-10-0122-01
Strengthened commodity prices led to growth in many sectors
In 2021, the value of Canadian merchandise exports increased by over $108 billion to $631 billion. This represents a 20.8% increase over 2020 and a 6.6% increase over the pre-pandemic previous record high in 2019. However, this historical growth was largely due to strengthened commodity prices, especially resource products such as crude oil and lumber (see Figure 2). In real terms, Canada’s merchandise exports (volume) only rose by 1.2% in 2021, and still remain 5.3% below the pre-pandemic level in 2019. Footnote 2
Figure 2. High prices pushed up Canada’s export value, while export volume edged up 
Text version
| Export value (2012 = 100) | Export volume (2012 = 100) | |
|---|---|---|
| 2012 | 100.0 | 100.0 |
| 2013 | 103.7 | 102.7 |
| 2014 | 115.7 | 110.1 |
| 2015 | 115.1 | 117.2 |
| 2016 | 113.5 | 116.9 |
| 2017 | 120.0 | 119.5 |
| 2018 | 128.4 | 122.6 |
| 2019 | 130.1 | 125.3 |
| 2020 | 114.9 | 117.3 |
| 2021 | 138.7 | 118.7 |
Data: Statistics Canada Tables 12-10-0126-01 & 12-10-0122-01
Despite the fact that all but one export sector posted growth in 2021, over 90% of the increase in value can be traced back to resource sectors, which increased by 34% year-over-year; from $288 billion in 2020 to $385 billion in 2021 (see Figure 3). In particular, exports of energy products led all sectors by growing 62% or $55 billion in value. After the sharp decline in the first half of 2020, energy exports rebounded strongly in the second half of the year as crude oil prices picked up and this trend continued into 2021. According to Alberta Energy, the price for Western Canada Select (benchmark for heavy crude oil obtained from Western Canadian producers) rose from US$27.3 per barrel in February 2020 to US$53.1 per barrel in December 2021. Consequently, by the end of last year, energy exports were nearly 50% higher than their pre-pandemic levels. Similarly, exports of forestry products were up primary due to record high lumber prices as demand for home renovations skyrocketed during the pandemic. As one of the least negatively impacted export sectors for Canada by the COVID-19 pandemic, exports in the forest products and building and packaging materials sector surpassed their pre-pandemic levels in August 2020 and continued growing until June 2021. Since then, lumber prices have moderated, leading to exports in the sector to gradually return to pre-pandemic levels.
The only export sector that contracted in 2021 was motor vehicles and parts. After a historical decline in 2020, exports in this sector fell once again in 2021, contracting by 7.2% to $61 billion for the full year. Consequently, this sector fell by one spot to become Canada’s fourth largest export sector in 2021, surpassed by the metal and non-metallic mineral products sector. The decline in automotive exports was largely due to the prolonged global semiconductor shortage that began in 2020. Although supply chain issues had gradually and moderately improved towards the end of 2021, December export values in this sector still remained below their pre-pandemic levels.
Figure 3. Resource sectors were mainly responsible for the growth in Canadian exports 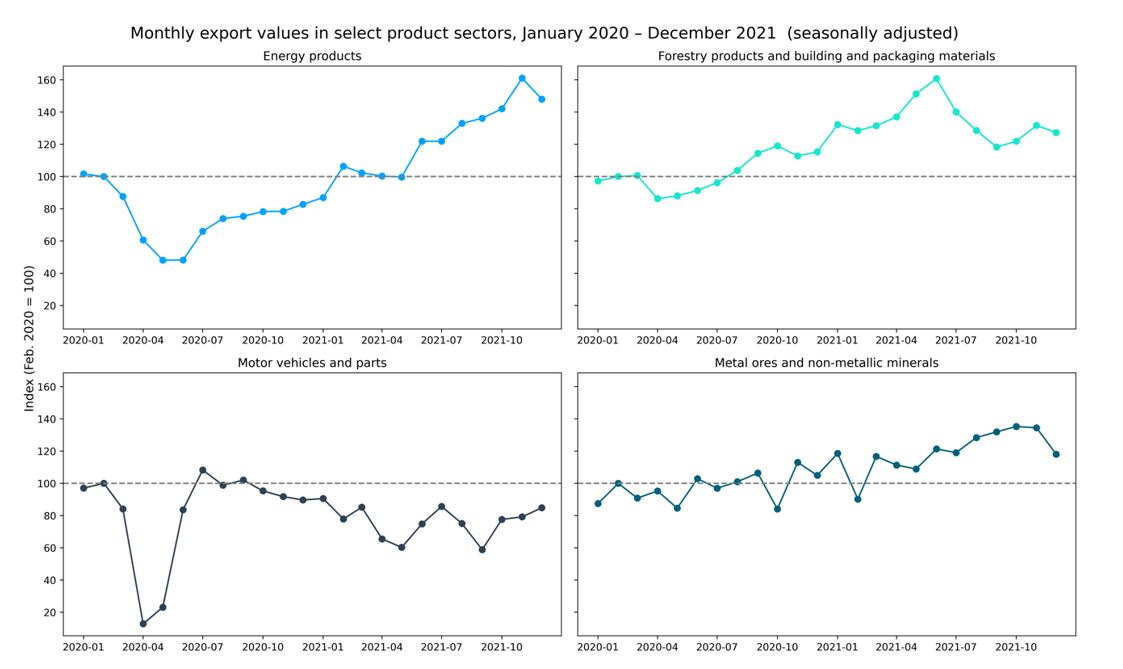
Text version
| Energy products (Feb. 2020 = 100) | Forestry products and building and packaging materials (Feb. 2020 = 100) | Metal ores and non-metallic minerals (Feb. 2020 = 100) | Motor vehicles and parts (Feb. 2020 = 100) | |
|---|---|---|---|---|
| 2020 | ||||
| Jan | 101.6 | 97.2 | 87.5 | 97.0 |
| Feb | 100.0 | 100.0 | 100.0 | 100.0 |
| Mar | 87.7 | 100.6 | 90.9 | 84.2 |
| Apr | 60.7 | 86.3 | 95.2 | 12.8 |
| May | 48.1 | 88.0 | 84.6 | 23.1 |
| Jun | 48.2 | 91.4 | 102.9 | 83.6 |
| Jul | 66.0 | 96.2 | 97.0 | 108.3 |
| Aug | 73.9 | 103.8 | 101.0 | 98.8 |
| Sep | 75.4 | 114.4 | 106.4 | 102.1 |
| Oct | 78.3 | 119.1 | 84.1 | 95.3 |
| Nov | 78.4 | 112.8 | 113.0 | 91.8 |
| Dec | 82.8 | 115.3 | 105.0 | 89.7 |
| 2021 | ||||
| Jan | 86.9 | 132.3 | 118.6 | 90.6 |
| Feb | 106.4 | 128.5 | 90.2 | 77.9 |
| Mar | 102.3 | 131.5 | 116.7 | 85.2 |
| Apr | 100.3 | 137.0 | 111.4 | 65.5 |
| May | 99.7 | 151.4 | 108.9 | 60.3 |
| Jun | 121.9 | 160.8 | 121.3 | 74.9 |
| Jul | 121.9 | 140.1 | 119.1 | 85.7 |
| Aug | 133.0 | 128.6 | 128.4 | 75.1 |
| Sep | 136.1 | 118.3 | 132.0 | 58.9 |
| Oct | 142.0 | 121.9 | 135.3 | 77.6 |
| Nov | 161.1 | 131.7 | 134.5 | 79.2 |
| Dec | 148.0 | 127.3 | 118.1 | 84.9 |
Data: Statistics Canada Table 12-10-0121-01
On the import side, after falling by 9.8% in 2020, overall Canadian merchandise imports rebounded by 13.0% or $70 billion in 2021 to $614 billion in value—also a new record high. Unlike exports, merchandise import volumes also rose significantly in 2021, advancing by 9.2% compared to 2020, but still remained 0.5% below their pre-pandemic levels in 2019 (see Figure 4). Nine out of eleven import sectors improved in 2021, with significant contributions from metal and non-metallic mineral products (+$13 billion), basic and industrial chemical, plastic and rubber products (+$11 billion), consumer goods (+9 billion), industrial machinery, equipment and parts (+$8 billion), and energy products (+$8 billion). The only two sectors that contracted were metal ores and non-metallic minerals (-$1 billion) and aircraft and other transportation equipment and parts (-$0.4 billion).
Figure 4. In contrast to exports, both Canada’s import value and volume rose significantly in 2021 
Text version
| Import value (2012 = 100) | Import volume (2012 = 100) | |
|---|---|---|
| 2012 | 100.0 | 100.0 |
| 2013 | 102.9 | 103.0 |
| 2014 | 110.8 | 105.7 |
| 2015 | 116.0 | 105.8 |
| 2016 | 115.4 | 105.9 |
| 2017 | 121.6 | 111.3 |
| 2018 | 129.0 | 114.7 |
| 2019 | 130.3 | 114.8 |
| 2020 | 117.5 | 104.6 |
| 2021 | 132.8 | 114.2 |
Data: Statistics Canada Tables 12-10-0126-01 & 12-10-0122-01
Regional summary
Canadian merchandise trade improved with every major region in 2021, and also grew with 159 out of 224 trading partners (see Figure 5). In value terms, the historical growth in Canada’s merchandise exports last year was almost entirely due to the recovery in exports to the United States. Besides the United States, exports to all regions recorded double-digit growth in 2021, with Europe as the sole exception. Over the same period, Canada’s merchandise imports improved with every region, especially from the United States, Asia Pacific region, and Europe.
Figure 5. Merchandise trade with most countries surpassed pre-pandemic levels 
Data: Statistics Canada, Canadian International Merchandise Trade Database
Americas: the United States was by far the most important driver of growth
After falling by 13.7% in 2020, bilateral merchandise trade between Canada and the United States rebounded by 19.5% in 2021, reaching a new record high of $774 billion for the full year. In value terms, bilateral trade with the United States was up by $126 billion in 2021, accounting for over 70% of the total growth in Canada’s merchandise trade. Growth in Canadian merchandise exports to the United States outpaced overall Canadian exports, rising by 24.5% (+$94 billion) to $477 billion in 2021. As a result, the U.S. share of total Canadian merchandise exports bounced back to 75.6%, the highest since 2013. Growth was driven by a solid economic rebound underpinned by stimulus spending as well as rising prices for a number of key exports. Over half of the growth in value can be traced to exports of energy products (see Figure 6), especially crude oil (+$39 billion) and petroleum gases (+$8.7 billion). Exports of forestry and metal and non-metallic mineral products also each grew by 34% in 2021. In contrast, two export sectors to the U.S. contracted: exports of motor vehicles and parts fell by 8.4%, primarily due to lower exports of passenger vehicles; and, exports of aircraft and other transportation equipment and parts also declined by 2.2%. On the import side, there was broad-based growth across many sectors, leading to imports from the U.S. rebounding by 12.2% in 2021 to $297 billion. Basic and industrial chemical, plastic and rubber products led all import sectors by growing 24.9% or 7.2 billion. Additionally, metal and non-metallic mineral products, consumer goods, and energy products each recorded annual growth of over $4 billion in value.
Figure 6. The recovery in exports to the U.S. was mainly due to higher exports of energy products 
Text version
| North American Product Classification System | growth% |
| Motor vehicles and parts | -8.4 |
| Aircraft and other transportation equipment and parts | -2.2 |
| Electronic and electrical equipment and parts | 5.8 |
| Metal ores and non-metallic minerals | 33.4 |
| Industrial machinery, equipment and parts | 9.3 |
| Farm, fishing and intermediate food products | 19.0 |
| Basic and industrial chemical, plastic and rubber products | 34.0 |
| Consumer goods | 17.6 |
| Metal and non-metallic mineral products | 33.9 |
| Forestry products and building and packaging materials | 33.9 |
| Energy products | 64.1 |
Data: Statistics Canada Table 12-10-0119-01
Besides the United States, Canada’s trade with other countries in the region also improved significantly in 2021. Canadian exports to other countries in the Americas region advanced by 28.8%—the fastest growth out of all the regions—mainly due to higher exports of energy products, cereals, and oil seeds. At the same time, Canadian imports from the region rose 11.8% (automotive products, iron and steel, and machinery). Mexico is Canada’s third largest single-country trading partner after the United States and China. In 2020, bilateral trade with Mexico plummeted with exports falling by 15.9% and imports by 19.0%. One year later in 2021, trade with Mexico rebounded significantly, with exports to Mexico increasing by 33.0% or $2.0 billion (over half the growth to other Americas region), surpassing pre-pandemic levels to reach $8.2 billion. The growth was primarily due to farm, fishing and intermediate food products. On the other hand, while imports from Mexico also recovered in 2021, advancing by 11.6% to $33.4 billion, the growth was not enough to make up for the huge loss in the year prior, resulting in imports from Mexico remaining 9.6% below 2019 levels. Other top contributors to the growth in exports to the region were Chile (+24.3%, mainly energy products) and Colombia (+27.0%, cereals); while imports from Brazil (+13.9%, iron and steel), Colombia (+53.4%, energy products), Peru (+8.5%, mineral ores), and Argentina (+40.3%, iron and steel) also posted strong growth.
Europe: exports to Europe lagged behind other regions
Canadian merchandise exports to Europe edged up by 0.7% in 2021—the slowest growth out of all regions. The sluggish recovery was mainly due to a contraction in exports to the United Kingdom, while exports to European Union (EU) members recovered strongly. Supported by the Canada-European Union Comprehensive Economic and Trade Agreement (CETA), exports to the EU rose by 7.7% in 2021, with higher exports to Belgium (+38.2%; mainly diamonds, nickel, and potash) and Spain (+63.2%, crude oil) being partially offset by lower exports to Italy (-29.2%, medicaments and crude oil). Moreover, due to higher exports of aircraft and parts, exports to smaller EU trading partners such as Malta (+141.2%), Latvia (+125.4%), and Austria (+90.4%) also recorded significant growth. Conversely, while exports to certain non-EU members like Switzerland (+67.8%) and Norway (+22.1%) also performed well in 2021, exports to the United Kingdom registered the largest contraction in the region by far (-18.6%). However, the decline was almost entirely because of gold. Excluding gold, Canadian exports to the United Kingdom were up by 8.5% in 2021.
In contrast to exports, Canada’s merchandise imports from Europe posted double-digit growth in 2021, advancing by 11.0% from 2020 levels. Imports from EU members (+12.8%) outperformed those from non-EU countries (+4.5%). Top contributors to the growth were: automotive products from Germany, energy products from the Netherlands (crude oil), precious metals from Italy (platinum), and pharmaceutical products from Belgium.
Asia Pacific: lower exports to India partially offset widespread growth in the region
In 2021, Canadian exports to the Asia Pacific region were up by 14.6%, driven by energy products, precious stones and metals, and mineral ores; over the same period, Canadian imports from the region rose by 14.7%. Imports were mainly supported by machinery, electronics, and automotive products.
Canadian merchandise exports to China grew for the second consecutive year in 2021 after the largest one-year decline on record in 2019 due to various trade disputes. Exports to China rose 13.9% or $3.5 billion to $29 billion in value (a new record high). This represents the largest growth out of all the non-US markets by far. Over three-quarters of the growth in value were due to higher exports of coal. Similarly, Canadian merchandise imports from China posted significant growth, increasing by 12.4% in 2021 to $86 billion (a new record high). Imports were driven by widespread gains, but especially from electronic and electrical equipment and parts, industrial machinery, equipment and parts, and metal and non-metallic mineral products.
Outside of China, Canada’s merchandise exports to Japan improved in 2021, with exports advancing by 15.7%, on the back of petroleum gases, wood sawn, iron ores, and canola seed. Other markets with strong growth include: Hong Kong (+85.8%, gold), South Korea (+20.6%; petroleum gases, gold, and iron ores), and Taiwan (+36.7%, copper and iron ores). Similarly, Canadian imports from Taiwan (+39.0%, electronics and silver) and Japan (+14.1%, automotive products) also rose strongly. On the other hand, exports to India suffered a second consecutive year of decline in 2021 (-20.0%), as shipments of fertilizers and vegetables to the country both fell by over $300 million when compared to 2020 levels.
Africa and Middle East: exports to Saudi Arabia and Algeria supported growth in the region
Last but not least, Canadian merchandise exports to the Africa and Middle East region rose by 11.3% in 2021 (driven by automotive products). Exports to Saudi Arabia, which fell significantly in the year prior, recovered by 40.0% and contributed the most to the overall growth in exports to the region, primarily due to exports of automotive products (mainly armoured vehicles). However, despite the recovery, exports to Saudi Arabia remains over 20% below 2019 levels. In contrast, exports to Algeria registered a new record high after growing by 75.2% in 2021 (mainly wheat and iron ores). Other countries in the region with notable export growth in 2021 include: United Arab Emirates (+10.7%, aircraft and parts and machinery), Tanzania (+422.7%, aircraft and parts), and Israel (+32.4%, oilseeds and automotive products).
Over the same period, Canadian imports from the Africa and Middle East region rose by 28.4%. Higher imports of energy products from Nigeria and Saudi Arabia was the main driver of growth, followed by imports of iron and steel products from Turkey, United Arab Emirates, and Egypt. Imports from Morocco (+64.0%, fertilizers), Democratic Republic of the Congo (+70.7%, copper), and Madagascar (+63.9%, vanilla and titanium ores) also improved significantly in 2021.
Box 1. Travel services trade started to rebound in the second half of 2021
Services sectors continued to be the most impacted by COVID-19 public health containment measures. Following the initial drop in the second quarter of 2020, goods trade in most sectors recovered rapidly, but services trade (especially travel services) saw no signs of recovery for quite some time (see Figure 7). At the start of 2021, as Canada and many of its principal trading partners experienced further waves of the pandemic (therefore requiring extensions of containment measures and travel restrictions), travel services continued to be impacted and thus did not begin to recover until the second half of 2021, and still had a long way to go before reaching pre-pandemic levels. By the end of 2021, travel services exports were still 15.0% below their levels in February 2020, and travel services imports remained 65.4% lower. In contrast, commercial services trade seemed immune to the negative impacts of the COVID-19 pandemic. After a small dip in early 2020, commercial services exports quickly recovered and surpassed their pre-pandemic levels. Commercial services imports also held steady throughout the past 2 years. For the full year 2021, total Canadian services exports rebounded by 3.6% from 2020 to $130.3 billion. However, this still represents a 12.9% reduction compared to the export level in 2019. Likewise, total services imports rose 0.4% in 2021 but remained 21.3% below 2019 levels.
Figure 7. Travel services trade started to recovery in the second half of 2021 but still remains far below its pre-pandemic levels 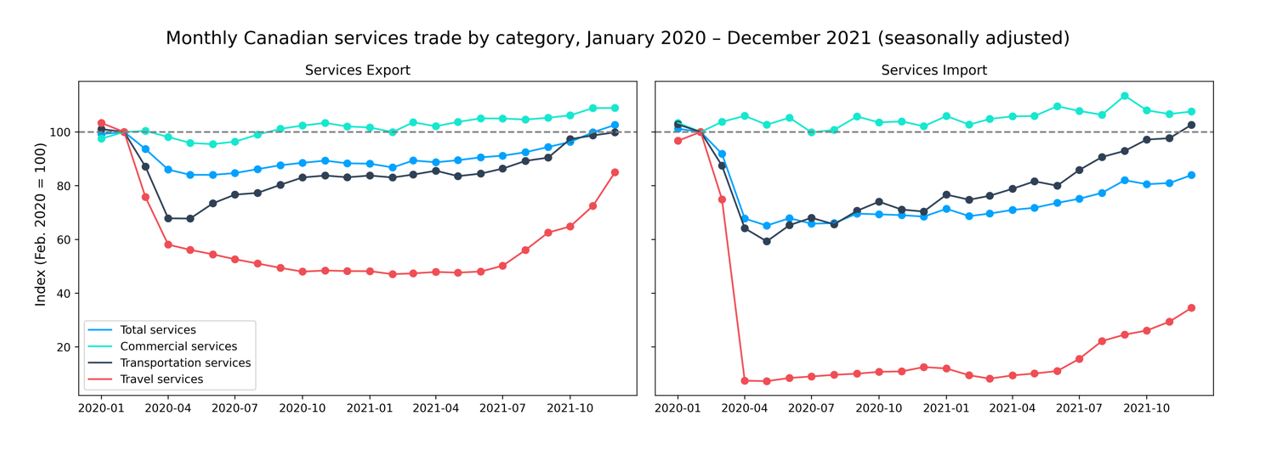
Text version
| Export | Import | |||||||
|---|---|---|---|---|---|---|---|---|
| Commercial services (Feb. 2020 = 100) | Total services (Feb. 2020 = 100) | Transportation services (Feb. 2020 = 100) | Travel services (Feb. 2020 = 100) | Commercial services (Feb. 2020 = 100) | Total services (Feb. 2020 = 100) | Transportation services (Feb. 2020 = 100) | Travel services (Feb. 2020 = 100) | |
| 2020 | ||||||||
| Jan | 97.5 | 99.2 | 101.1 | 103.3 | 103.4 | 101.2 | 102.8 | 96.8 |
| Feb | 100.0 | 100.0 | 100.0 | 100.0 | 100.0 | 100.0 | 100.0 | 100.0 |
| Mar | 100.4 | 93.6 | 87.1 | 75.8 | 103.8 | 91.9 | 87.5 | 74.9 |
| Apr | 98.1 | 86.0 | 67.9 | 58.1 | 106.0 | 67.8 | 64.2 | 7.5 |
| May | 95.9 | 84.1 | 67.8 | 56.2 | 102.7 | 65.2 | 59.3 | 7.3 |
| Jun | 95.5 | 84.1 | 73.5 | 54.5 | 105.3 | 67.9 | 65.3 | 8.5 |
| Jul | 96.4 | 84.7 | 76.7 | 52.7 | 99.9 | 65.9 | 68.1 | 9.0 |
| Aug | 99.0 | 86.2 | 77.3 | 51.0 | 100.8 | 66.1 | 65.6 | 9.7 |
| Sep | 101.2 | 87.6 | 80.3 | 49.4 | 105.8 | 69.6 | 70.7 | 10.1 |
| Oct | 102.4 | 88.5 | 83.1 | 48.0 | 103.6 | 69.3 | 74.1 | 10.8 |
| Nov | 103.4 | 89.3 | 83.8 | 48.5 | 103.9 | 69.1 | 71.1 | 10.9 |
| Dec | 102.1 | 88.3 | 83.1 | 48.3 | 102.1 | 68.5 | 70.4 | 12.5 |
| 2021 | ||||||||
| Jan | 101.7 | 88.2 | 83.8 | 48.2 | 105.9 | 71.4 | 76.7 | 12.0 |
| Feb | 100.0 | 86.8 | 83.1 | 47.1 | 102.7 | 68.7 | 74.8 | 9.5 |
| Mar | 103.6 | 89.4 | 84.1 | 47.4 | 104.8 | 69.6 | 76.3 | 8.2 |
| Apr | 102.1 | 88.7 | 85.6 | 47.9 | 105.8 | 71.0 | 78.9 | 9.4 |
| May | 103.7 | 89.5 | 83.6 | 47.7 | 105.9 | 71.8 | 81.6 | 10.1 |
| Jun | 105.1 | 90.6 | 84.5 | 48.1 | 109.6 | 73.6 | 80.0 | 11.0 |
| Jul | 105.0 | 91.2 | 86.4 | 50.2 | 107.8 | 75.1 | 85.9 | 15.6 |
| Aug | 104.6 | 92.5 | 89.2 | 56.1 | 106.4 | 77.3 | 90.7 | 22.2 |
| Sep | 105.3 | 94.4 | 90.5 | 62.6 | 113.5 | 82.1 | 93.0 | 24.6 |
| Oct | 106.2 | 96.3 | 97.3 | 64.8 | 108.1 | 80.6 | 97.2 | 26.1 |
| Nov | 108.9 | 99.9 | 98.7 | 72.5 | 106.7 | 81.0 | 97.7 | 29.4 |
| Dec | 108.9 | 102.6 | 99.9 | 85.0 | 107.6 | 84.0 | 102.7 | 34.6 |
Data: Statistics Canada Table 12-10-0144-01
Appendix
- Canada’s Annual Trade by Product Sector
| Exports ($ Million, 2021) | Exports (∆%) | Imports ($ Million, 2021) | Imports (∆%) | |
|---|---|---|---|---|
| Total of all merchandise | 631,315 | 20.8 | 613,589 | 13.0 |
| Resource products | 385,325 | 34.0 | 205,686 | 22.2 |
| Farm, fishing and intermediate food products | 47,960 | 8.7 | 23,770 | 10.7 |
| Energy products | 143,911 | 62.0 | 31,029 | 36.5 |
| Metal ores and non-metallic minerals | 26,777 | 22.9 | 15,573 | -6.4 |
| Metal and non-metallic mineral products | 72,086 | 19.1 | 53,125 | 32.2 |
| Basic and industrial chemical, plastic and rubber products | 38,638 | 30.0 | 51,933 | 25.7 |
| Forestry products and building and packaging materials | 55,953 | 31.4 | 30,256 | 16.3 |
| Non-resource products | 220,611 | 5.1 | 393,787 | 8.3 |
| Industrial machinery & equipment | 34,414 | 7.5 | 69,042 | 13.8 |
| Electronic machinery & equipment | 24,598 | 6.7 | 74,514 | 9.2 |
| Motor vehicles and parts | 60,946 | -7.2 | 95,197 | 7.6 |
| Aircraft & other transportation equipment | 21,928 | 8.9 | 19,763 | -2.1 |
| Consumer goods | 78,725 | 14.1 | 135,272 | 7.5 |
Data: Statistics Canada Table 12-10-0121-01
- Annual Trade by Principal Trading Partner
| Exports ($ Million, 2021) | Exports (∆%) | Imports ($ Million, 2021) | Imports (∆%) | |
|---|---|---|---|---|
| United States | 476,989 | 24.5 | 297,479 | 12.2 |
| Mexico | 8,185 | 33.0 | 33,423 | 11.6 |
| Brazil | 2,263 | 5.4 | 7,490 | 13.9 |
| Peru | 1,086 | 18.5 | 3,976 | 8.5 |
| European Union | 14,126 | -49.9 | 59,706 | -0.3 |
| -Germany | 6,856 | 7.5 | 19,107 | 10.6 |
| -France | 4,043 | 8.8 | 7,101 | 9.6 |
| -Netherlands | 4,773 | -12.3 | 3,909 | 21.4 |
| -Italy | 2,650 | -29.1 | 10,469 | 16.2 |
| -Belgium | 3,781 | 38.2 | 4,865 | 11.2 |
| -Spain | 2,325 | 63.2 | 3,779 | 22.2 |
| United Kingdom | 16,220 | -18.6 | 7,873 | 0.4 |
| Norway | 3,131 | 22.1 | 978 | -17.0 |
| Switzerland | 3,030 | 67.8 | 5,694 | -3.7 |
| Russian Federation | 657 | 3.9 | 2,141 | 79.0 |
| China | 28,810 | 13.9 | 86,043 | 12.4 |
| Hong Kong | 3,540 | 85.8 | 427 | -25.2 |
| Japan | 14,347 | 15.7 | 15,444 | 14.1 |
| South Korea | 5,682 | 20.6 | 10,340 | 7.7 |
| India | 2,960 | -20.3 | 5,979 | 20.3 |
| Taiwan | 2,441 | 36.7 | 7,825 | 39.0 |
| Australia | 2,312 | 8.0 | 2,240 | -5.1 |
| Indonesia | 2,241 | 25.1 | 1,980 | 23.2 |
| Singapore | 1,209 | -2.5 | 1,028 | -12.8 |
| Algeria | 1,080 | 75.2 | 58 | 37.9 |
| Saudi Arabia | 2,186 | 40.0 | 2,364 | 56.3 |
| Turkey | 1,149 | -6.1 | 2,788 | 49.3 |
| Iraq | 135 | 52.8 | 1 | 120.0 |
Data: Statistics Canada Table 12-10-0011-01
- Date Modified: