
Price or quantity effect? The impacts of the pandemic on Canadian trade
Colin Scarffe
January 2022
Key points
- As of October 2021, the value of Canada’s merchandise exports were 13% above the 2019 average (pre-pandemic) level. However, this is the product of two offsetting trends:
- The first is that export prices surged in 2021 and are 21% above their pre-pandemic level.
- The second is that export quantities sagged in 2021 and are 6.2% below their pre-pandemic level.
- This narrative only emerged in 2021, after prices and quantities had recovered from the pandemic dip.
- As of October 2021, Canadian merchandise imports are 5.7% above pre-pandemic levels and are a muted version of the export side. Import prices are 5.4% above their pre-pandemic level while import quantities are 0.2% above their pre-pandemic level.
- Canadian merchandise export prices move nearly one-for-one with Canadian industrial prices—both industrial prices (excluding energy) and export prices (excluding oil) have increased close to 15% year-over-year in October 2021.
- In October, Canadian merchandise imports (excluding oil) had increased a more modest 5% year-over-year while the price of consumer goods (excluding energy) increased 3% year-over-year. While import prices are correlated with consumer and industrial prices, the correlation is somewhat weak suggesting that other domestic factors may be more important than import prices.
- As export prices have risen faster than import prices, Canada has seen its terms of trade appreciate. In general, this rising terms of trade indicates the price changes have been a net-benefit to the Canadian economy as Canadian exporters are receiving greater returns for exports relative to the increased costs to importers.
1. Introduction
Largely due to the COVID-19 pandemic, Canada’s merchandise trade —and merchandise trade around the world—has been volatile in the last two years. Business closures to control the spread of the virus, shifts in spending patterns, volatile commodity prices, and lingering supply chain issues have all contributed to the disruptions in trade. Between February 2020 and May 2020, Canadian imports and exports both fell 29%. As pandemic restrictions gradually eased, monetary policy become more accommodating, fiscal supports materialized, and Canadians transitioned to working online, Canadian trade rebounded. As of October 2021, Canadian merchandise imports were 5.7% above 2019 average (pre-pandemic) levels, while Canadian merchandise exports were 13% above pre-pandemic levels. However, the fall and subsequent recovery of Canadian trade is more complicated than the simple narrative that things have returned to normal. In general, two components determine the value of Canadian trade: the quantity of goods traded and the price paid for those goods. Examining the quantity and price changes over the last two years provides more nuance on what actually changed during the pandemic, and contributes to a clearer narrative of the emerging trends in merchandise trade.
2. Data and methodology
The data in this paper covers only merchandise trade and comes from Statistics Canada. Table 12-10-0121-01 provides monthly Canadian trade values by the North American Product Classification System (NAPCS) commodities (101 commodities at the most detailed level).Footnote 1 Table 12-10-0128-01 provides monthly price and volume (hereafter quantity) information for Canadian merchandise trade by NAPCS commodities.Footnote 2 There are two choices to make with the data: whether to seasonally adjust the data, and whether to use the data on a Customs or Balance of Payments (BoP) basis. Given the examination period is measured in months rather than years, seasonally adjusted data is the natural choice; balance of payments data was chosen as it is more commonly reported by Statistics Canada. A manual adjustment was made to the quantity and price data to adjust the base year to 2019. Details of the adjustment, as well as details of other index number calculations can be found in the second appendix. The latest data available at the time of writing was October 2021.
For many series, a counter-factual level is used for comparison. There are several ways to generate a counter-factual; the first would be to use a benchmark level, such as the 2019 average as the “normal” level. One problem is that this simple benchmark ignores the fact that trade generally grows over time, and thus what is “normal” for the end of 2021 should be above the 2019 average. The second option is to use a previous trend to make a linear extrapolation for 2020 and 2021. A third option is to use univariate ARIMAFootnote 3 estimation to generate a prediction for 2020 and 2021. While ARIMA estimation isn’t ex-ante constrained to be linear, in this paper all of the ARIMA estimates produced a linear trend—thus the linear extrapolations and the ARIMA estimates are similar. Both the 2019 average level and the ARIMA estimation will be used as benchmarks in this report. Details of the specific ARIMA procedure can be found in section 9, the third appendix.
3. Exports
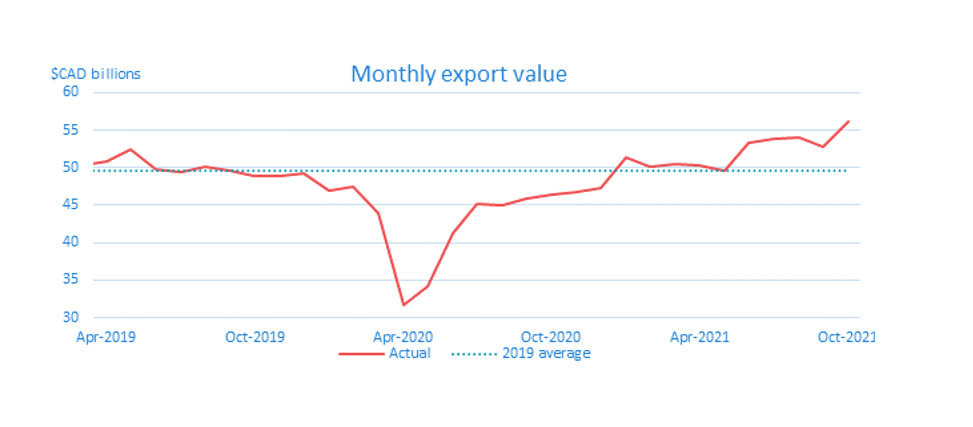
The value of Canadian merchandise exports decreased close to 34% between February and April 2020; however, the trough was short-lived with exports recovering half of their value by June 2020 and were above 2019 average levels by January 2021. As seen in figure 1 below, exports have seen steady growth regardless of the starting point. Even if no leniency is granted for the pandemic, Canadian merchandise exports grew close to 15% between October 2019 and October 2021. This is equivalent to an annual growth rate of 7.2% which compares favourably to an annual growth rate of exports between 2010 and 2019 of only 4.3%.
Figure 1: The monthly value of Canadian merchandise exports
Text version
| Date | Actual | 2019 average |
|---|---|---|
| Jan-2018 | 46068.9 | 49630.3 |
| Feb-2018 | 46806.1 | 49630.3 |
| Mar-2018 | 48208.0 | 49630.3 |
| Apr-2018 | 49008.9 | 49630.3 |
| May-2018 | 49014.3 | 49630.3 |
| Jun-2018 | 51684.6 | 49630.3 |
| Jul-2018 | 51481.6 | 49630.3 |
| Aug-2018 | 50585.9 | 49630.3 |
| Sep-2018 | 50664.2 | 49630.3 |
| Oct-2018 | 50226.3 | 49630.3 |
| Nov-2018 | 47003.3 | 49630.3 |
| Dec-2018 | 45412.5 | 49630.3 |
| Jan-2019 | 47989.6 | 49630.3 |
| Feb-2019 | 48254.6 | 49630.3 |
| Mar-2019 | 50298.6 | 49630.3 |
| Apr-2019 | 50852.1 | 49630.3 |
| May-2019 | 52341.9 | 49630.3 |
| Jun-2019 | 49752.0 | 49630.3 |
| Jul-2019 | 49431.1 | 49630.3 |
| Aug-2019 | 50070.9 | 49630.3 |
| Sep-2019 | 49530.4 | 49630.3 |
| Oct-2019 | 48881.3 | 49630.3 |
| Nov-2019 | 48837.7 | 49630.3 |
| Dec-2019 | 49323.5 | 49630.3 |
| Jan-2020 | 46883.4 | 49630.3 |
| Feb-2020 | 47381.1 | 49630.3 |
| Mar-2020 | 43944.3 | 49630.3 |
| Apr-2020 | 31639.9 | 49630.3 |
| May-2020 | 34227.4 | 49630.3 |
| Jun-2020 | 41326.9 | 49630.3 |
| Jul-2020 | 45248.6 | 49630.3 |
| Aug-2020 | 45024.0 | 49630.3 |
| Sep-2020 | 45902.0 | 49630.3 |
| Oct-2020 | 46423.8 | 49630.3 |
| Nov-2020 | 46834.7 | 49630.3 |
| Dec-2020 | 47346.3 | 49630.3 |
| Jan-2021 | 51292.2 | 49630.3 |
| Feb-2021 | 50060.8 | 49630.3 |
| Mar-2021 | 50557.1 | 49630.3 |
| Apr-2021 | 50274.3 | 49630.3 |
| May-2021 | 49528.4 | 49630.3 |
| Jun-2021 | 53268.1 | 49630.3 |
| Jul-2021 | 53821.0 | 49630.3 |
| Aug-2021 | 53947.5 | 49630.3 |
| Sep-2021 | 52801.6 | 49630.3 |
| Oct-2021 | 56183.1 | 49630.3 |
| Nov-2021 | ||
| Dec-2021 |
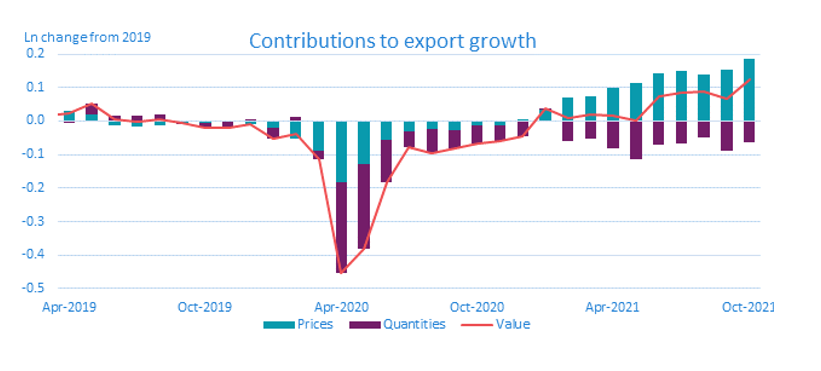
However, examining the export value by itself does not tell the full story. Figure 2 decomposes the change in exports (from the 2019 average level) into changes in export quantity and changes in export prices. Figure 2 shows that all of the export growth in 2021 has been due to increasing prices, while the quantity of exported goods has actually acted as a drag on growth.
Figure 2: Price and quantity contribution to the growth of merchandise export value compared to 2019Footnote 4
Text version
| Date | Value | Prices | Quantities |
|---|---|---|---|
| Jan-2019 | -0.035 | -0.029 | -0.006 |
| Feb-2019 | -0.029 | 0.005 | -0.035 |
| Mar-2019 | 0.015 | 0.025 | -0.010 |
| Apr-2019 | 0.025 | 0.030 | -0.005 |
| May-2019 | 0.053 | 0.021 | 0.032 |
| Jun-2019 | 0.004 | -0.012 | 0.016 |
| Jul-2019 | -0.001 | -0.017 | 0.015 |
| Aug-2019 | 0.006 | -0.013 | 0.019 |
| Sep-2019 | -0.006 | -0.005 | -0.002 |
| Oct-2019 | -0.019 | -0.007 | -0.011 |
| Nov-2019 | -0.019 | -0.003 | -0.016 |
| Dec-2019 | -0.008 | -0.010 | 0.002 |
| Jan-2020 | -0.059 | -0.020 | -0.039 |
| Feb-2020 | -0.047 | -0.047 | 0.000 |
| Mar-2020 | -0.120 | -0.082 | -0.038 |
| Apr-2020 | -0.450 | -0.180 | -0.270 |
| May-2020 | -0.373 | -0.126 | -0.247 |
| Jun-2020 | -0.182 | -0.057 | -0.124 |
| Jul-2020 | -0.087 | -0.038 | -0.049 |
| Aug-2020 | -0.100 | -0.026 | -0.074 |
| Sep-2020 | -0.084 | -0.028 | -0.056 |
| Oct-2020 | -0.070 | -0.013 | -0.056 |
| Nov-2020 | -0.060 | -0.014 | -0.046 |
| Dec-2020 | -0.048 | 0.002 | -0.050 |
| Jan-2021 | 0.031 | 0.033 | -0.002 |
| Feb-2021 | 0.006 | 0.070 | -0.064 |
| Mar-2021 | 0.017 | 0.074 | -0.057 |
| Apr-2021 | 0.011 | 0.098 | -0.087 |
| May-2021 | -0.002 | 0.113 | -0.116 |
| Jun-2021 | 0.071 | 0.143 | -0.072 |
| Jul-2021 | 0.081 | 0.150 | -0.069 |
| Aug-2021 | 0.084 | 0.141 | -0.058 |
| Sep-2021 | 0.061 | 0.161 | -0.100 |
| Oct-2021 | 0.127 | 0.195 | -0.068 |
| Nov-2021 | 0.165 | 0.199 | -0.034 |
Of note is that quantities were above the 2019 average level in January 2021. While the recent sluggishness of quantities could still be pandemic driven, this is a new trend which is distinct from the initial drop in April 2020. Had quantities stayed below 2019 levels the entire time, the narrative could be that they’re slow to recover, or perhaps Canada has lost that capacity entirely. However, given quantities did exceed the 2019 level, neither of these descriptions fit the data.
In order to investigate the trends further, the price and quantity growth is decomposed into the 101 NAPCS components. By decomposing the aggregates into the components, its possible to infer whether the observed trend is the result of a single component—and therefore not reflective of the broader economy—or whether it is broad based—and therefore reflective of the economic conditions. Table 3 & 4 in the first appendix have the 10 components that have the highest contribution to growth—both negative and positive—for export prices and quantities. Table 1 has key summary statistics for the individual components for various periods throughout the pandemic.
Table 1: Summary statistics of components throughout the pandemicFootnote 5
| Quantities | Dates | Unweighted mean change | Median change | Number of prod. that declined | Number of prod. that increased | HHI of CTGFootnote 6 |
|---|---|---|---|---|---|---|
| Pandemic decline | 2019 – May-20 | -15.0% | -15.0% | 77 | 22 | 0.14 |
| Pandemic rebound | May-20 – Jan-21 | 33.1% | 16.3% | 22 | 77 | 0.11 |
| 2021 | Jan-21 – Oct-21 | -3.2% | -3.8% | 65 | 32 | 0.10 |
| full period | 2019 – Oct-21 | -3.9% | -4.3% | 64 | 35 | 0.12 |
| Prices | ||||||
| Pandemic decline | 2019 – May-20 | -3.3% | 1.1% | 42 | 57 | 0.58 |
| Pandemic rebound | May-20 – Jan-21 | 8.8% | 0.9% | 41 | 58 | 0.33 |
| 2021 | Jan-21 – Oct-21 | 15.8% | 7.0% | 22 | 75 | 0.17 |
| Full period | 2019 – Oct-21 | 17.4% | 12.3% | 18 | 81 | 0.08 |
The dynamics in export quantities and prices since 2019 can be described as follows:
Pandemic decline (2019 average – May 2020):
- A broad-based decline in export quantities. Autos and parts played a large role, but 77 of the 99 products declined. No product was solely responsible for the decline in quantity.
- A decline in export prices that was entirely due to a decline in the price of oil. Excluding oil, export prices were flat.
Pandemic rebound (May 2020 – January 2021):
- A broad-based increase in export quantities. Crude oil and autos/auto-parts were large contributors to the recovery, but combined only contributed a little over half to the total increase in export quantities.
- A broad-based increase in export prices. Crude oil was responsible for more than half of the contribution in prices, but export prices excluding oil were also up significantly.
2021 (January 2021 – October 2021):
- Broad based decrease in quantities. Two-thirds of exports had a lower export quantity compared to January. Cars, trucks, tires, and parts contributed only one-sixth to the decline.
- Broad based increase in prices.
Total pandemic period (2019 average – October 2021):
- A broad-based decline in quantities. Autos and parts plays a significant role, but only contributes about a third to the total decline
- A broad-based increase in export prices, the magnitude of which is the largest (or at least matches the largest) on record.
- Oil prices had a large decrease (-75%) and then a large increase (+400%), thus largely canceling out the change. However, this result in a still notable 31% increase.
To summarize the 2021 period in words, there is no single export, or group of exports, that is responsible for the price increase or the quantity decrease. The increase in prices is reflective of the fact that prices around the world for most goods have increased, and Canadian exporters are selling their goods for higher prices. Likewise, no single export was responsible for the lower export quantity. Canadian exporters are struggling to export their goods. This isn’t to say that Canadian exporters have become lousy at exporting; rather, there are supply constraints that are limiting Canadian businesses. The fact that both the higher prices and lower quantities are broad based means that no single cause—such as a semi-conductor shortage—can explain these events; higher prices and lower quantities are simply a feature of the broader economic conditions.
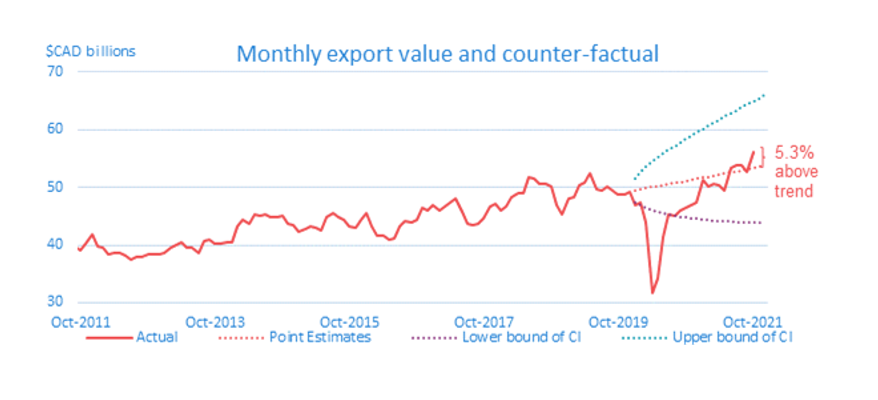
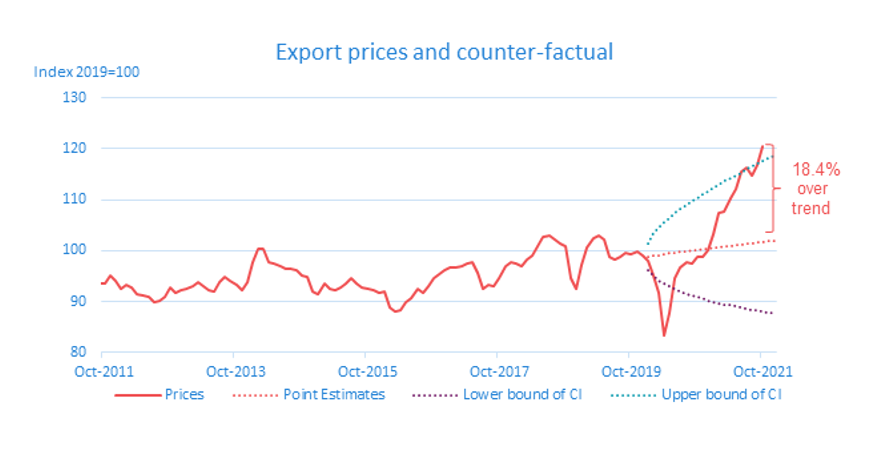
The final piece of the analysis on the export side is to examine how the current level of the data compares to the counter-factual estimates. The reason why a comparison to counter-factual is necessary is that it provides context for the above facts. There’s no questioning that prices have driven export growth while quantities have held back export growth, but if export prices are high while quantities are more normal, then having a lower export quantity would not be a significant issue. Conversely, if quantities are low while prices are normal, this changes the narrative as perhaps the shock isn’t as extensive as thought. Similar to above, before examining prices and quantities, figure 3 has the value of exports compared to its counter-factual.
Figure 3: The value of exports and the counter-factualFootnote 7
Text version
| Date | Actual | Point Estimates | Lower bound of CI | Upper bound of CI |
|---|---|---|---|---|
| Jan-2010 | 32347.0 | |||
| Feb-2010 | 33103.1 | |||
| Mar-2010 | 32714.8 | |||
| Apr-2010 | 32888.5 | |||
| May-2010 | 33749.6 | |||
| Jun-2010 | 33387.2 | |||
| Jul-2010 | 33044.1 | |||
| Aug-2010 | 33945.2 | |||
| Sep-2010 | 33280.8 | |||
| Oct-2010 | 34208.7 | |||
| Nov-2010 | 34743.7 | |||
| Dec-2010 | 36554.0 | |||
| Jan-2011 | 37537.7 | |||
| Feb-2011 | 35660.6 | |||
| Mar-2011 | 36331.9 | |||
| Apr-2011 | 36806.3 | |||
| May-2011 | 36652.1 | |||
| Jun-2011 | 36308.3 | |||
| Jul-2011 | 37664.6 | |||
| Aug-2011 | 38730.1 | |||
| Sep-2011 | 39881.5 | |||
| Oct-2011 | 39087.2 | |||
| Nov-2011 | 40149.1 | |||
| Dec-2011 | 41803.1 | |||
| Jan-2012 | 39670.6 | |||
| Feb-2012 | 39609.3 | |||
| Mar-2012 | 38336.5 | |||
| Apr-2012 | 38587.5 | |||
| May-2012 | 38523.7 | |||
| Jun-2012 | 38187.8 | |||
| Jul-2012 | 37517.6 | |||
| Aug-2012 | 37988.8 | |||
| Sep-2012 | 37852.8 | |||
| Oct-2012 | 38287.8 | |||
| Nov-2012 | 38471.9 | |||
| Dec-2012 | 38476.9 | |||
| Jan-2013 | 38594.1 | |||
| Feb-2013 | 39491.2 | |||
| Mar-2013 | 40031.8 | |||
| Apr-2013 | 40565.4 | |||
| May-2013 | 39631.3 | |||
| Jun-2013 | 39535.4 | |||
| Jul-2013 | 38657.9 | |||
| Aug-2013 | 40671.8 | |||
| Sep-2013 | 41044.8 | |||
| Oct-2013 | 40318.5 | |||
| Nov-2013 | 40155.0 | |||
| Dec-2013 | 40527.5 | |||
| Jan-2014 | 40424.8 | |||
| Feb-2014 | 43191.7 | |||
| Mar-2014 | 44432.5 | |||
| Apr-2014 | 43696.7 | |||
| May-2014 | 45246.7 | |||
| Jun-2014 | 45124.9 | |||
| Jul-2014 | 45317.8 | |||
| Aug-2014 | 44760.4 | |||
| Sep-2014 | 44952.0 | |||
| Oct-2014 | 45009.7 | |||
| Nov-2014 | 43634.1 | |||
| Dec-2014 | 43542.3 | |||
| Jan-2015 | 42271.9 | |||
| Feb-2015 | 42834.5 | |||
| Mar-2015 | 43147.5 | |||
| Apr-2015 | 42892.2 | |||
| May-2015 | 42493.5 | |||
| Jun-2015 | 44835.4 | |||
| Jul-2015 | 45566.1 | |||
| Aug-2015 | 44755.3 | |||
| Sep-2015 | 44345.5 | |||
| Oct-2015 | 43348.8 | |||
| Nov-2015 | 43055.7 | |||
| Dec-2015 | 44499.7 | |||
| Jan-2016 | 45518.4 | |||
| Feb-2016 | 43349.7 | |||
| Mar-2016 | 41507.4 | |||
| Apr-2016 | 41552.4 | |||
| May-2016 | 40944.8 | |||
| Jun-2016 | 41120.5 | |||
| Jul-2016 | 43174.4 | |||
| Aug-2016 | 44151.3 | |||
| Sep-2016 | 44001.0 | |||
| Oct-2016 | 44407.9 | |||
| Nov-2016 | 46456.4 | |||
| Dec-2016 | 46116.7 | |||
| Jan-2017 | 46977.1 | |||
| Feb-2017 | 46110.4 | |||
| Mar-2017 | 46769.3 | |||
| Apr-2017 | 47390.3 | |||
| May-2017 | 47988.4 | |||
| Jun-2017 | 45712.0 | |||
| Jul-2017 | 43807.0 | |||
| Aug-2017 | 43560.1 | |||
| Sep-2017 | 43763.8 | |||
| Oct-2017 | 44638.0 | |||
| Nov-2017 | 46728.9 | |||
| Dec-2017 | 47079.4 | |||
| Jan-2018 | 46068.9 | |||
| Feb-2018 | 46806.1 | |||
| Mar-2018 | 48208.0 | |||
| Apr-2018 | 49008.9 | |||
| May-2018 | 49014.3 | |||
| Jun-2018 | 51684.6 | |||
| Jul-2018 | 51481.6 | |||
| Aug-2018 | 50585.9 | |||
| Sep-2018 | 50664.2 | |||
| Oct-2018 | 50226.3 | |||
| Nov-2018 | 47003.3 | |||
| Dec-2018 | 45412.5 | |||
| Jan-2019 | 47989.6 | |||
| Feb-2019 | 48254.6 | |||
| Mar-2019 | 50298.6 | |||
| Apr-2019 | 50852.1 | |||
| May-2019 | 52341.9 | |||
| Jun-2019 | 49752.0 | |||
| Jul-2019 | 49431.1 | |||
| Aug-2019 | 50070.9 | |||
| Sep-2019 | 49530.4 | |||
| Oct-2019 | 48881.3 | |||
| Nov-2019 | 48837.7 | |||
| Dec-2019 | 49323.5 | |||
| Jan-2020 | 46883.4 | 49498.67 | 47473.3 | 51610.46 |
| Feb-2020 | 47381.1 | 49674.47 | 46824.54 | 52697.85 |
| Mar-2020 | 43944.3 | 49850.89 | 46370.98 | 53591.94 |
| Apr-2020 | 31639.9 | 50027.93 | 46017.63 | 54387.72 |
| May-2020 | 34227.4 | 50205.6 | 45727.84 | 55121.84 |
| Jun-2020 | 41326.9 | 50383.91 | 45482.88 | 55813.05 |
| Jul-2020 | 45248.6 | 50562.85 | 45271.68 | 56472.42 |
| Aug-2020 | 45024.0 | 50742.42 | 45087.05 | 57107.16 |
| Sep-2020 | 45902.0 | 50922.63 | 44924 | 57722.25 |
| Oct-2020 | 46423.8 | 51103.48 | 44778.93 | 58321.32 |
| Nov-2020 | 46834.7 | 51284.98 | 44649.12 | 58907.08 |
| Dec-2020 | 47346.3 | 51467.12 | 44532.46 | 59481.65 |
| Jan-2021 | 51226.2 | 51649.9 | 44427.3 | 60046.7 |
| Feb-2021 | 49969.1 | 51833.34 | 44332.27 | 60603.59 |
| Mar-2021 | 50530.2 | 52017.42 | 44246.29 | 61153.42 |
| Apr-2021 | 50221.1 | 52202.16 | 44168.43 | 61697.14 |
| May-2021 | 49562.7 | 52387.56 | 44097.9 | 62235.52 |
| Jun-2021 | 53332.8 | 52573.61 | 44034.06 | 62769.24 |
| Jul-2021 | 53854.4 | 52760.33 | 43976.33 | 63298.87 |
| Aug-2021 | 54011.6 | 52947.71 | 43924.22 | 63824.91 |
| Sep-2021 | 52782.6 | 53135.75 | 43877.3 | 64347.8 |
| Oct-2021 | 56420 | 53324.46 | 43835.19 | 64867.93 |
| Nov-2021 | 53513.84 | 43797.56 | 65385.64 | |
| Dec-2021 | 53703.9 | 43764.1 | 65901.24 |
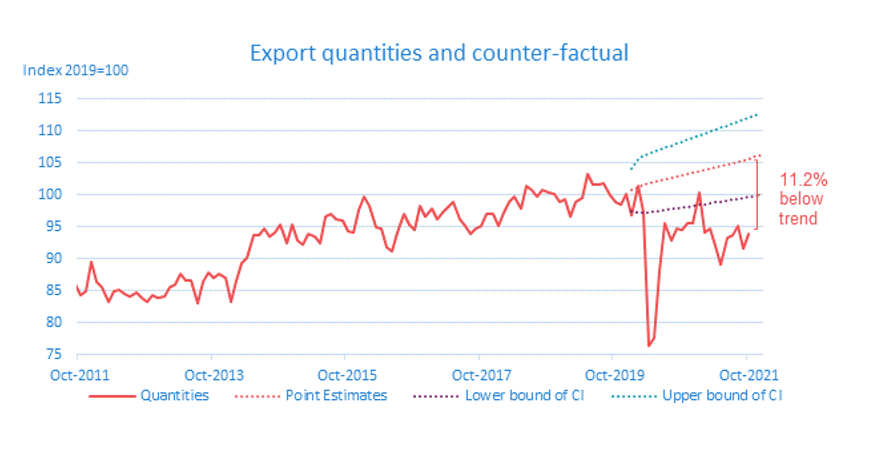
This simple counter-factual does not attempt to provide an accurate forecast—perhaps Canadian exports should be much higher or much lower than they are currently, given the economic conditions. A better forecast would require a more powerful model which is out of the scope of this work. Instead, the counter-factual can be interpreted as Canadian exports being approximately back to (or above) the same growth path they were prior to the pandemic. Exports surpassed the counter-factual (the trend growth rate between January 2010 and December 2019) by June 2021. As of October 2021, exports were $2.8 billion (or roughly 5%) above the counter-factual estimate.Footnote 8 Next, figure 4 has the export quantity and export prices compared to their respective counter-factuals.
Figure 4: Monthly quantity, price, and counter-factual estimates for exports
Text version
| Date | Quantities | Point Estimates | Lower bound of CI | Upper bound of CI |
|---|---|---|---|---|
| Jan-2010 | 77.34 | |||
| Feb-2010 | 78.52 | |||
| Mar-2010 | 79.42 | |||
| Apr-2010 | 81.01 | |||
| May-2010 | 81.04 | |||
| Jun-2010 | 80.86 | |||
| Jul-2010 | 80.51 | |||
| Aug-2010 | 81.96 | |||
| Sep-2010 | 80.52 | |||
| Oct-2010 | 82.36 | |||
| Nov-2010 | 82.48 | |||
| Dec-2010 | 85.77 | |||
| Jan-2011 | 82.99 | |||
| Feb-2011 | 79.93 | |||
| Mar-2011 | 80.15 | |||
| Apr-2011 | 79.60 | |||
| May-2011 | 79.93 | |||
| Jun-2011 | 78.52 | |||
| Jul-2011 | 84.93 | |||
| Aug-2011 | 85.67 | |||
| Sep-2011 | 85.93 | |||
| Oct-2011 | 84.24 | |||
| Nov-2011 | 84.99 | |||
| Dec-2011 | 89.53 | |||
| Jan-2012 | 86.42 | |||
| Feb-2012 | 85.62 | |||
| Mar-2012 | 83.31 | |||
| Apr-2012 | 84.90 | |||
| May-2012 | 85.17 | |||
| Jun-2012 | 84.56 | |||
| Jul-2012 | 84.15 | |||
| Aug-2012 | 84.80 | |||
| Sep-2012 | 83.91 | |||
| Oct-2012 | 83.21 | |||
| Nov-2012 | 84.40 | |||
| Dec-2012 | 83.96 | |||
| Jan-2013 | 84.02 | |||
| Feb-2013 | 85.49 | |||
| Mar-2013 | 85.98 | |||
| Apr-2013 | 87.72 | |||
| May-2013 | 86.53 | |||
| Jun-2013 | 86.59 | |||
| Jul-2013 | 82.99 | |||
| Aug-2013 | 86.34 | |||
| Sep-2013 | 87.85 | |||
| Oct-2013 | 87.00 | |||
| Nov-2013 | 87.63 | |||
| Dec-2013 | 87.05 | |||
| Jan-2014 | 83.31 | |||
| Feb-2014 | 86.67 | |||
| Mar-2014 | 89.23 | |||
| Apr-2014 | 90.17 | |||
| May-2014 | 93.60 | |||
| Jun-2014 | 93.64 | |||
| Jul-2014 | 94.69 | |||
| Aug-2014 | 93.57 | |||
| Sep-2014 | 94.13 | |||
| Oct-2014 | 95.26 | |||
| Nov-2014 | 92.53 | |||
| Dec-2014 | 95.43 | |||
| Jan-2015 | 92.92 | |||
| Feb-2015 | 92.26 | |||
| Mar-2015 | 93.85 | |||
| Apr-2015 | 93.47 | |||
| May-2015 | 92.48 | |||
| Jun-2015 | 96.53 | |||
| Jul-2015 | 97.10 | |||
| Aug-2015 | 96.10 | |||
| Sep-2015 | 96.00 | |||
| Oct-2015 | 94.29 | |||
| Nov-2015 | 94.00 | |||
| Dec-2015 | 97.69 | |||
| Jan-2016 | 99.75 | |||
| Feb-2016 | 98.19 | |||
| Mar-2016 | 94.95 | |||
| Apr-2016 | 94.72 | |||
| May-2016 | 91.73 | |||
| Jun-2016 | 91.24 | |||
| Jul-2016 | 94.07 | |||
| Aug-2016 | 97.07 | |||
| Sep-2016 | 95.38 | |||
| Oct-2016 | 94.57 | |||
| Nov-2016 | 98.20 | |||
| Dec-2016 | 96.54 | |||
| Jan-2017 | 97.75 | |||
| Feb-2017 | 96.14 | |||
| Mar-2017 | 97.23 | |||
| Apr-2017 | 97.96 | |||
| May-2017 | 98.81 | |||
| Jun-2017 | 96.25 | |||
| Jul-2017 | 95.23 | |||
| Aug-2017 | 93.95 | |||
| Sep-2017 | 94.79 | |||
| Oct-2017 | 95.06 | |||
| Nov-2017 | 97.00 | |||
| Dec-2017 | 96.93 | |||
| Jan-2018 | 95.21 | |||
| Feb-2018 | 97.16 | |||
| Mar-2018 | 98.79 | |||
| Apr-2018 | 99.67 | |||
| May-2018 | 97.77 | |||
| Jun-2018 | 101.29 | |||
| Jul-2018 | 100.70 | |||
| Aug-2018 | 99.62 | |||
| Sep-2018 | 100.67 | |||
| Oct-2018 | 100.26 | |||
| Nov-2018 | 100.09 | |||
| Dec-2018 | 98.90 | |||
| Jan-2019 | 99.35 | |||
| Feb-2019 | 96.59 | |||
| Mar-2019 | 98.97 | |||
| Apr-2019 | 99.46 | |||
| May-2019 | 103.26 | |||
| Jun-2019 | 101.57 | |||
| Jul-2019 | 101.55 | |||
| Aug-2019 | 101.90 | |||
| Sep-2019 | 99.83 | |||
| Oct-2019 | 98.88 | |||
| Nov-2019 | 98.41 | |||
| Dec-2019 | 100.23 | |||
| Jan-2020 | 96.20 | 101.046 | 97.76703 | 104.4349 |
| Feb-2020 | 100.04 | 101.5289 | 97.48892 | 105.7363 |
| Mar-2020 | 96.25 | 101.6575 | 97.291 | 106.22 |
| Apr-2020 | 76.35 | 101.866 | 97.4009 | 106.5358 |
| May-2020 | 78.08 | 102.0749 | 97.51273 | 106.8505 |
| Jun-2020 | 88.31 | 102.2843 | 97.62639 | 107.1643 |
| Jul-2020 | 95.21 | 102.494 | 97.74178 | 107.4773 |
| Aug-2020 | 92.87 | 102.7042 | 97.85884 | 107.7895 |
| Sep-2020 | 94.59 | 102.9148 | 97.97748 | 108.101 |
| Oct-2020 | 94.51 | 103.1259 | 98.09765 | 108.4119 |
| Nov-2020 | 95.52 | 103.3374 | 98.21927 | 108.7223 |
| Dec-2020 | 95.16 | 103.5493 | 98.34229 | 109.0321 |
| Jan-2021 | 99.80 | 103.7617 | 98.46665 | 109.3415 |
| Feb-2021 | 93.80 | 103.9745 | 98.59232 | 109.6505 |
| Mar-2021 | 94.42 | 104.1877 | 98.71924 | 109.9592 |
| Apr-2021 | 91.67 | 104.4014 | 98.84738 | 110.2675 |
| May-2021 | 89.09 | 104.6155 | 98.97669 | 110.5756 |
| Jun-2021 | 93.01 | 104.8301 | 99.10714 | 110.8835 |
| Jul-2021 | 93.34 | 105.0451 | 99.2387 | 111.1911 |
| Aug-2021 | 94.40 | 105.2605 | 99.37133 | 111.4987 |
| Sep-2021 | 90.46 | 105.4764 | 99.50501 | 111.8061 |
| Oct-2021 | 93.39648 | 105.6927 | 99.6397 | 112.1134 |
| Nov-2021 | 105.9094 | 99.77539 | 112.4206 | |
| Dec-2021 | 106.1266 | 99.91205 | 112.7278 |
Text version
| Date | Prices | Point Estimates | Lower bound of CI | Upper bound of CI |
|---|---|---|---|---|
| Jan-2010 | 84.22 | |||
| Feb-2010 | 84.90 | |||
| Mar-2010 | 82.94 | |||
| Apr-2010 | 81.74 | |||
| May-2010 | 83.85 | |||
| Jun-2010 | 83.13 | |||
| Jul-2010 | 82,62 | |||
| Aug-2010 | 83.40 | |||
| Sep-2010 | 83.22 | |||
| Oct-2010 | 83.61 | |||
| Nov-2010 | 84.83 | |||
| Dec-2010 | 85.81 | |||
| Jan-2011 | 91.08 | |||
| Feb-2011 | 89.83 | |||
| Mar-2011 | 91.25 | |||
| Apr-2011 | 93.09 | |||
| May-2011 | 92.32 | |||
| Jun-2011 | 93.09 | |||
| Jul-2011 | 89.26 | |||
| Aug-2011 | 90.96 | |||
| Sep-2011 | 93.43 | |||
| Oct-2011 | 93.43 | |||
| Nov-2011 | 95.04 | |||
| Dec-2011 | 94.01 | |||
| Jan-2012 | 92.42 | |||
| Feb-2012 | 93.16 | |||
| Mar-2012 | 92.63 | |||
| Apr-2012 | 91.51 | |||
| May-2012 | 91.08 | |||
| Jun-2012 | 90.93 | |||
| Jul-2012 | 89.76 | |||
| Aug-2012 | 90.20 | |||
| Sep-2012 | 90.83 | |||
| Oct-2012 | 92.64 | |||
| Nov-2012 | 91.75 | |||
| Dec-2012 | 92.25 | |||
| Jan-2013 | 92.47 | |||
| Feb-2013 | 93.00 | |||
| Mar-2013 | 93.74 | |||
| Apr-2013 | 93.11 | |||
| May-2013 | 92.19 | |||
| Jun-2013 | 91.91 | |||
| Jul-2013 | 93.78 | |||
| Aug-2013 | 94.85 | |||
| Sep-2013 | 94.08 | |||
| Oct-2013 | 93.33 | |||
| Nov-2013 | 92.25 | |||
| Dec-2013 | 93.74 | |||
| Jan-2014 | 97.68 | |||
| Feb-2014 | 100.32 | |||
| Mar-2014 | 100.25 | |||
| Apr-2014 | 97.60 | |||
| May-2014 | 97.33 | |||
| Jun-2014 | 96.98 | |||
| Jul-2014 | 96.35 | |||
| Aug-2014 | 96.31 | |||
| Sep-2014 | 96.06 | |||
| Oct-2014 | 95.04 | |||
| Nov-2014 | 94.95 | |||
| Dec-2014 | 91.89 | |||
| Jan-2015 | 91.55 | |||
| Feb-2015 | 93.50 | |||
| Mar-2015 | 92.52 | |||
| Apr-2015 | 92.30 | |||
| May-2015 | 92.72 | |||
| Jun-2015 | 93.65 | |||
| Jul-2015 | 94.57 | |||
| Aug-2015 | 93.66 | |||
| Sep-2015 | 92.83 | |||
| Oct-2015 | 92.53 | |||
| Nov-2015 | 92.21 | |||
| Dec-2015 | 91.71 | |||
| Jan-2016 | 91.91 | |||
| Feb-2016 | 88.90 | |||
| Mar-2016 | 88.03 | |||
| Apr-2016 | 88.33 | |||
| May-2016 | 89.86 | |||
| Jun-2016 | 90.75 | |||
| Jul-2016 | 92.40 | |||
| Aug-2016 | 91.60 | |||
| Sep-2016 | 92.89 | |||
| Oct-2016 | 94.57 | |||
| Nov-2016 | 95.29 | |||
| Dec-2016 | 96.18 | |||
| Jan-2017 | 96.77 | |||
| Feb-2017 | 96.60 | |||
| Mar-2017 | 96.84 | |||
| Apr-2017 | 97.38 | |||
| May-2017 | 97.78 | |||
| Jun-2017 | 95.64 | |||
| Jul-2017 | 92.61 | |||
| Aug-2017 | 93.38 | |||
| Sep-2017 | 92.94 | |||
| Oct-2017 | 94.55 | |||
| Nov-2017 | 96.99 | |||
| Dec-2017 | 97.81 | |||
| Jan-2018 | 97.43 | |||
| Feb-2018 | 96.98 | |||
| Mar-2018 | 98.27 | |||
| Apr-2018 | 98.99 | |||
| May-2018 | 100.94 | |||
| Jun-2018 | 102.74 | |||
| Jul-2018 | 102.93 | |||
| Aug-2018 | 102.15 | |||
| Sep-2018 | 101.31 | |||
| Oct-2018 | 100.87 | |||
| Nov-2018 | 94.54 | |||
| Dec-2018 | 92.45 | |||
| Jan-2019 | 97.18 | |||
| Feb-2019 | 100.53 | |||
| Mar-2019 | 102.53 | |||
| Apr-2019 | 103.06 | |||
| May-2019 | 102.13 | |||
| Jun-2019 | 98.85 | |||
| Jul-2019 | 98.35 | |||
| Aug-2019 | 98.75 | |||
| Sep-2019 | 99.53 | |||
| Oct-2019 | 99.28 | |||
| Nov-2019 | 99.74 | |||
| Dec-2019 | 99.01 | |||
| Jan-2020 | 98.03 | 98.66488 | 96.01716 | 101.3856 |
| Feb-2020 | 95.36 | 99.06011 | 94.87569 | 103.4291 |
| Mar-2020 | 92.12 | 99.046 | 93.97394 | 104.3918 |
| Apr-2020 | 83.55 | 99.25964 | 93.33769 | 105.5573 |
| May-2020 | 88.20 | 99.34704 | 92.73922 | 106.4257 |
| Jun-2020 | 94.44 | 99.50486 | 92.25211 | 107.3278 |
| Jul-2020 | 96.28 | 99.62384 | 91.79559 | 108.1197 |
| Aug-2020 | 97.45 | 99.76467 | 91.39467 | 108.9012 |
| Sep-2020 | 97.20 | 99.89363 | 91.02036 | 109.6319 |
| Oct-2020 | 98.68 | 100.0295 | 90.67888 | 110.3443 |
| Nov-2020 | 98.57 | 100.1618 | 90.35912 | 111.0279 |
| Dec-2020 | 100.16 | 100.2963 | 90.06159 | 111.6941 |
| Jan-2021 | 103.32 | 100.4299 | 89.78149 | 112.3412 |
| Feb-2021 | 107.24 | 100.5643 | 89.51789 | 112.9737 |
| Mar-2021 | 107.73 | 100.6985 | 89.26837 | 113.5921 |
| Apr-2021 | 110.29 | 100.8331 | 89.03184 | 114.1985 |
| May-2021 | 111.99 | 100.9677 | 88.80687 | 114.7938 |
| Jun-2021 | 115.42 | 101.1026 | 88.59252 | 115.3793 |
| Jul-2021 | 116.16 | 101.2377 | 88.38783 | 115.9556 |
| Aug-2021 | 115.18 | 101.3729 | 88.19204 | 116.5237 |
| Sep-2021 | 117.48 | 101.5083 | 88.00446 | 117.0843 |
| Oct-2021 | 121.5766 | 101.6439 | 87.8245 | 117.6379 |
| Nov-2021 | 101.7797 | 87.6516 | 118.1851 | |
| Dec-2021 | 101.9157 | 87.48531 | 118.7263 |
Perhaps unsurprising given the decomposition in figure 2, the value of exports sitting in the middle of the “normal” range is the product of two offsetting abnormal occurrences. Export prices are 18.4% above the counter-factual trend, while export quantities are 11.2% below the counter-factual trend. Both of these events fit into the common narrative emerging in the aftermath of the COVID-19 pandemic. A shift towards consuming more goods causes an increase in demand, putting upward pressure on prices, while constrained supply keeps actual quantities traded down. The result ends up being a close to a wash in terms of value, but the composition is higher prices paid for goods and lower quantities exported.
One final point on exports: reinforcing the narrative from the decomposition in figure 2, these trends have emerged entirely in 2021. In January 2021, export prices were right in line with the point estimate and just slightly above 100—the 2019 average level. Likewise, quantities were below the point estimate, but were above the lower bound of the confidence interval and slightly above 100. Thus for Canadian merchandise exports, the run-up in prices, and the sagging of quantities is a pandemic narrative that is disparate from the initial drop and is a distinct trend for 2021.
4. Imports
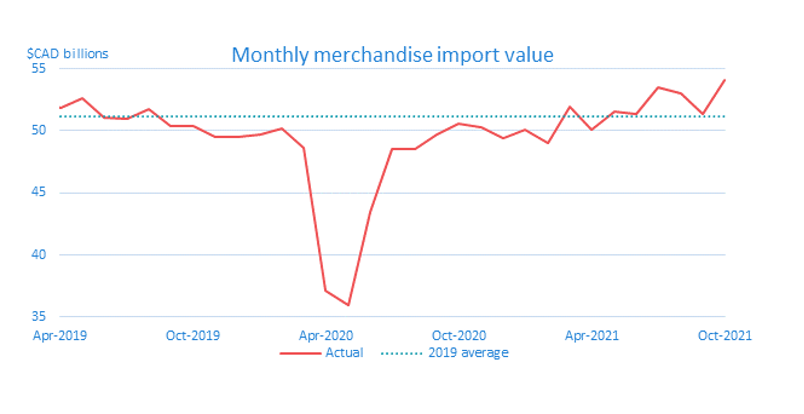
Throughout the pandemic, the import side of Canadian merchandise trade has exhibited similar behaviour as the export side; however, it is more muted and the trends in value, prices, and quantities are less distinct. Both merchandise exports and imports fell 29% between February and May 2020, with April being the trough for exports and May being the trough for imports. Figure 5 has the monthly value of Canadian merchandise imports and the 2019 average.
Figure 5: The monthly value of Canadian merchandise imports
Text version
| Date | Actual | 2019 average |
|---|---|---|
| Jan-2018 | 47927.0 | 51164.4 |
| Feb-2018 | 48910.1 | 51164.4 |
| Mar-2018 | 51677.2 | 51164.4 |
| Apr-2018 | 50496.3 | 51164.4 |
| May-2018 | 51479.9 | 51164.4 |
| Jun-2018 | 51933.3 | 51164.4 |
| Jul-2018 | 51547.0 | 51164.4 |
| Aug-2018 | 51086.7 | 51164.4 |
| Sep-2018 | 51191.1 | 51164.4 |
| Oct-2018 | 50427.9 | 51164.4 |
| Nov-2018 | 50126.3 | 51164.4 |
| Dec-2018 | 51167.5 | 51164.4 |
| Jan-2019 | 51934.4 | 51164.4 |
| Feb-2019 | 51430.0 | 51164.4 |
| Mar-2019 | 52688.5 | 51164.4 |
| Apr-2019 | 51821.0 | 51164.4 |
| May-2019 | 52622.6 | 51164.4 |
| Jun-2019 | 51035.6 | 51164.4 |
| Jul-2019 | 50972.3 | 51164.4 |
| Aug-2019 | 51703.5 | 51164.4 |
| Sep-2019 | 50404.5 | 51164.4 |
| Oct-2019 | 50395.8 | 51164.4 |
| Nov-2019 | 49475.2 | 51164.4 |
| Dec-2019 | 49489.3 | 51164.4 |
| Jan-2020 | 49744.1 | 51164.4 |
| Feb-2020 | 50191.5 | 51164.4 |
| Mar-2020 | 48579.8 | 51164.4 |
| Apr-2020 | 37139.5 | 51164.4 |
| May-2020 | 36007.0 | 51164.4 |
| Jun-2020 | 43437.0 | 51164.4 |
| Jul-2020 | 48482.9 | 51164.4 |
| Aug-2020 | 48557.3 | 51164.4 |
| Sep-2020 | 49654.0 | 51164.4 |
| Oct-2020 | 50544.5 | 51164.4 |
| Nov-2020 | 50236.2 | 51164.4 |
| Dec-2020 | 49433.9 | 51164.4 |
| Jan-2021 | 50073.5 | 51164.4 |
| Feb-2021 | 48975.8 | 51164.4 |
| Mar-2021 | 51991.5 | 51164.4 |
| Apr-2021 | 50121.2 | 51164.4 |
| May-2021 | 51537.8 | 51164.4 |
| Jun-2021 | 51388.8 | 51164.4 |
| Jul-2021 | 53623.1 | 51164.4 |
| Aug-2021 | 53079.3 | 51164.4 |
| Sep-2021 | 51610.8 | 51164.4 |
| Oct-2021 | 54156.2 | 51164.4 |
| Nov-2021 | 51164.4 | |
| Dec-2021 | 51164.4 |
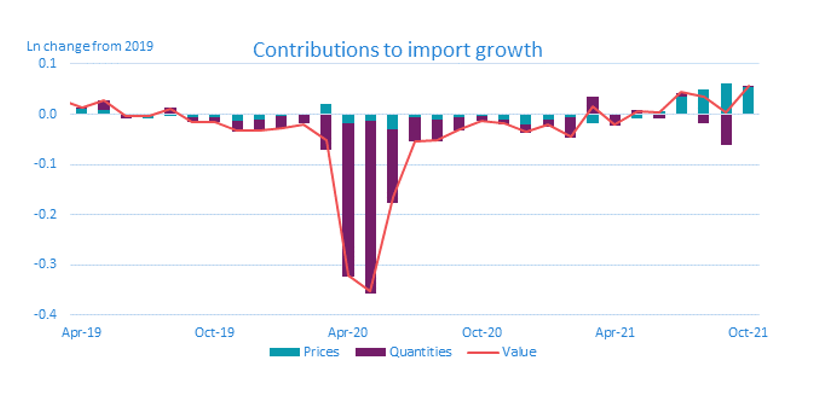
Next, figure 6 below decomposes the change in imports into price and quantity growth. There are features of figure 6 that are similar to the export decomposition in figure 2—namely the big dip at the beginning of the pandemic and the recent increase in import prices. However, this does not mean that imports have had the same narrative as exports. Prices played a smaller role in the initial decline for imports (albeit on the export side the price decline was entirely due to oil) and accordingly quantities played a larger role on the import side. The second difference is that as late as May 2021, import prices were below the 2019 average level. This is noticeably different from the export side where prices have been above the 2019 average level since December 2020—6 months earlier than imports. Lastly, import quantities were slightly above the 2019 average level in October 2021—albeit essentially no different from the pre-pandemic level. This still differs markedly from the export side where quantities were a significant drag on growth.
Figure 6: Price and quantity contribution to the growth of import value compared to 2019
Text version
| Date | Value | Prices | Quantities |
|---|---|---|---|
| Jan-2018 | -0.065 | -0.048 | -0.019 |
| Feb-2018 | -0.045 | -0.038 | -0.008 |
| Mar-2018 | 0.010 | -0.025 | 0.035 |
| Apr-2018 | -0.013 | -0.027 | 0.013 |
| May-2018 | 0.006 | -0.023 | 0.028 |
| Jun-2018 | 0.015 | 0.000 | 0.014 |
| Jul-2018 | 0.007 | 0.006 | 0.001 |
| Aug-2018 | -0.002 | 0.007 | -0.010 |
| Sep-2018 | 0.001 | 0.009 | -0.009 |
| Oct-2018 | -0.014 | -0.001 | -0.014 |
| Nov-2018 | -0.020 | 0.004 | -0.025 |
| Dec-2018 | 0.000 | 0.015 | -0.016 |
| Jan-2019 | 0.015 | 0.010 | 0.002 |
| Feb-2019 | 0.005 | -0.005 | 0.011 |
| Mar-2019 | 0.029 | 0.004 | 0.026 |
| Apr-2019 | 0.013 | 0.010 | 0.004 |
| May-2019 | 0.028 | 0.008 | 0.019 |
| Jun-2019 | -0.003 | 0.002 | -0.009 |
| Jul-2019 | -0.004 | -0.009 | 0.002 |
| Aug-2019 | 0.010 | -0.002 | 0.012 |
| Sep-2019 | -0.015 | -0.005 | -0.011 |
| Oct-2019 | -0.015 | -0.005 | -0.012 |
| Nov-2019 | -0.034 | -0.012 | -0.023 |
| Dec-2019 | -0.033 | -0.010 | -0.023 |
| Jan-2020 | -0.028 | -0.002 | -0.027 |
| Feb-2020 | -0.019 | 0.000 | -0.016 |
| Mar-2020 | -0.052 | 0.023 | -0.073 |
| Apr-2020 | -0.320 | -0.020 | -0.301 |
| May-2020 | -0.351 | -0.010 | -0.346 |
| Jun-2020 | -0.164 | -0.028 | -0.141 |
| Jul-2020 | -0.054 | -0.008 | -0.049 |
| Aug-2020 | -0.052 | -0.013 | -0.039 |
| Sep-2020 | -0.030 | -0.008 | -0.022 |
| Oct-2020 | -0.012 | -0.004 | -0.009 |
| Nov-2020 | -0.018 | -0.011 | -0.008 |
| Dec-2020 | -0.034 | -0.020 | -0.014 |
| Jan-2021 | -0.022 | -0.013 | -0.009 |
| Feb-2021 | -0.044 | -0.007 | -0.037 |
| Mar-2021 | 0.016 | -0.020 | 0.035 |
| Apr-2021 | -0.021 | -0.001 | -0.020 |
| May-2021 | 0.007 | -0.010 | 0.016 |
| Jun-2021 | 0.004 | 0.006 | -0.002 |
| Jul-2021 | 0.047 | 0.034 | 0.012 |
| Aug-2021 | 0.037 | 0.047 | -0.011 |
| Sep-2021 | 0.009 | 0.061 | -0.053 |
| Oct-2021 | 0.057 | 0.055 | 0.001 |
| Nov-2021 | 0.080 | 0.073 | 0.006 |
Below, table 2 has the summary statistics for the individual components throughout the pandemic. For consistency, the same time periods are used, but based off of the contributions to import growth in figure 6, their isn’t a clear change in trend that emerges after January 2021.
Table 2: Summary statistics of components throughout the pandemic
| Quantities | Dates | Unweighted mean change | Median change | Number of prod. that declined | Number of prod.that increased | HHI of CTGs |
|---|---|---|---|---|---|---|
| Pandemic decline | 2019—May-20 | -14.1% | -19.3% | 77 | 22 | 0.10 |
| Pandemic recovery | May-20—Jan-21 | 77.0% | 22.7% | 19 | 80 | 0.10 |
| 2021 | Jan-21—Oct-21 | 20.0% | 0.8% | 46 | 53 | 0.08 |
| Full pandemic period | 2019—Oct-21 | 1.9% | 3.7% | 38 | 61 | 0.05 |
| Prices | ||||||
| Pandemic decline | 2019—May-20 | 0.4% | 2.6% | 37 | 62 | 0.24 |
| Pandemic recovery | May-20—Jan-21 | 3.2% | -2.9% | 60 | 39 | 0.18 |
| 2021 | Jan-21—Oct-21 | 12.2% | 6.4% | 23 | 76 | 0.05 |
| Full pandemic period | 2019—Oct-21 | 13.8% | 4.7% | 33 | 66 | 0.05 |
In general, the import price and quantity contributions to growth have been broad-based throughout the pandemic. During the pandemic decline and subsequent recovery, import price contributions were slightly concentrated, but given the relatively small change in prices, this number is less important to the narrative. One period to note is that the decline in quantities in August and September 2021 (the two purple bars below 0 towards the right hand side in figure 6) was entirely due to a decline in autos and auto-parts. Otherwise, all other movements have been largely broad-based.
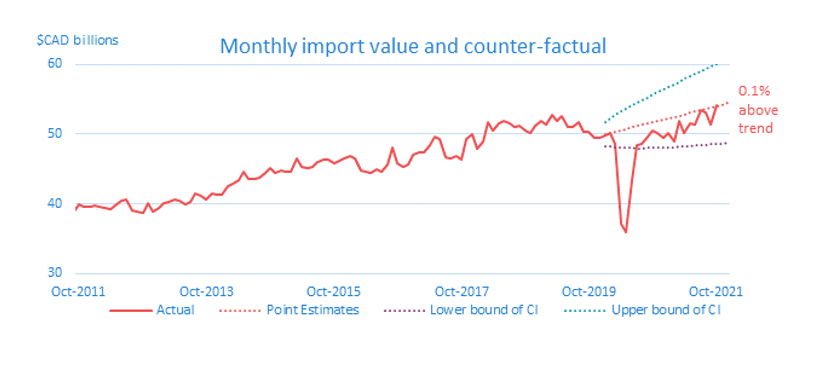
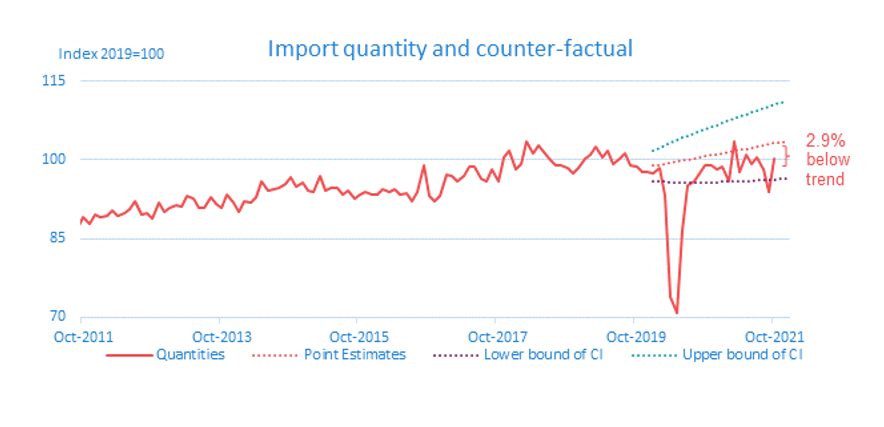
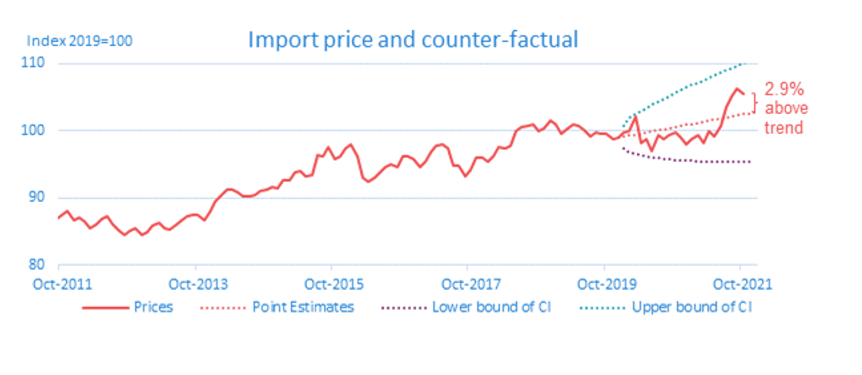
Next, figure 7 has the three series—the value, quantities, and prices—plotted with their respective counter-factuals. One aspect that these figures show is that it is clear that prices are above trend and quantities are below trend—albeit only slightly. Thus, while the path taken to get to October 2021 is different than exports, imports has the similar—though milder—narrative to the export side that prices are up while quantities are down.
Figure 7: The value, quantity, and price of imports and their counter-factuals
Text version
| Date | Actual | Point Estimates | Lower bound of CI | Upper bound of CI |
|---|---|---|---|---|
| Jan-2010 | 31953.0 | |||
| Feb-2010 | 33041.9 | |||
| Mar-2010 | 33970.6 | |||
| Apr-2010 | 32778.9 | |||
| May-2010 | 34609.8 | |||
| Jun-2010 | 34783.4 | |||
| Jul-2010 | 35115.1 | |||
| Aug-2010 | 35716.7 | |||
| Sep-2010 | 35614.6 | |||
| Oct-2010 | 35391.2 | |||
| Nov-2010 | 35256.5 | |||
| Dec-2010 | 35438.3 | |||
| Jan-2011 | 36793.6 | |||
| Feb-2011 | 35709.1 | |||
| Mar-2011 | 37331.4 | |||
| Apr-2011 | 37046.0 | |||
| May-2011 | 37738.1 | |||
| Jun-2011 | 37422.8 | |||
| Jul-2011 | 37515.8 | |||
| Aug-2011 | 38521.3 | |||
| Sep-2011 | 38783.7 | |||
| Oct-2011 | 39927.3 | |||
| Nov-2011 | 39573.8 | |||
| Dec-2011 | 39682.0 | |||
| Jan-2012 | 39705.3 | |||
| Feb-2012 | 39610.3 | |||
| Mar-2012 | 39498.6 | |||
| Apr-2012 | 39328.4 | |||
| May-2012 | 39910.3 | |||
| Jun-2012 | 40525.6 | |||
| Jul-2012 | 40559.6 | |||
| Aug-2012 | 39065.1 | |||
| Sep-2012 | 38903.9 | |||
| Oct-2012 | 38667.1 | |||
| Nov-2012 | 40145.2 | |||
| Dec-2012 | 38880.9 | |||
| Jan-2013 | 39476.7 | |||
| Feb-2013 | 40181.6 | |||
| Mar-2013 | 40214.9 | |||
| Apr-2013 | 40718.5 | |||
| May-2013 | 40451.7 | |||
| Jun-2013 | 39979.4 | |||
| Jul-2013 | 40314.4 | |||
| Aug-2013 | 41469.4 | |||
| Sep-2013 | 41079.9 | |||
| Oct-2013 | 40690.2 | |||
| Nov-2013 | 41422.6 | |||
| Dec-2013 | 41370.8 | |||
| Jan-2014 | 41301.2 | |||
| Feb-2014 | 42617.2 | |||
| Mar-2014 | 42909.2 | |||
| Apr-2014 | 43374.2 | |||
| May-2014 | 44679.2 | |||
| Jun-2014 | 43496.6 | |||
| Jul-2014 | 43622.9 | |||
| Aug-2014 | 43837.6 | |||
| Sep-2014 | 44366.5 | |||
| Oct-2014 | 45201.0 | |||
| Nov-2014 | 44430.3 | |||
| Dec-2014 | 44824.8 | |||
| Jan-2015 | 44695.3 | |||
| Feb-2015 | 44556.4 | |||
| Mar-2015 | 46561.0 | |||
| Apr-2015 | 45273.1 | |||
| May-2015 | 45144.3 | |||
| Jun-2015 | 45253.0 | |||
| Jul-2015 | 46025.6 | |||
| Aug-2015 | 46363.1 | |||
| Sep-2015 | 46353.1 | |||
| Oct-2015 | 45762.2 | |||
| Nov-2015 | 46205.6 | |||
| Dec-2015 | 46489.2 | |||
| Jan-2016 | 46825.3 | |||
| Feb-2016 | 46555.0 | |||
| Mar-2016 | 44744.3 | |||
| Apr-2016 | 44638.7 | |||
| May-2016 | 44529.7 | |||
| Jun-2016 | 44896.4 | |||
| Jul-2016 | 44611.1 | |||
| Aug-2016 | 45670.0 | |||
| Sep-2016 | 48036.7 | |||
| Oct-2016 | 45793.6 | |||
| Nov-2016 | 45383.2 | |||
| Dec-2016 | 45665.2 | |||
| Jan-2017 | 47072.3 | |||
| Feb-2017 | 47370.9 | |||
| Mar-2017 | 47440.7 | |||
| Apr-2017 | 48440.8 | |||
| May-2017 | 49569.3 | |||
| Jun-2017 | 49270.4 | |||
| Jul-2017 | 46754.8 | |||
| Aug-2017 | 46485.6 | |||
| Sep-2017 | 46931.0 | |||
| Oct-2017 | 46322.4 | |||
| Nov-2017 | 49354.5 | |||
| Dec-2017 | 50011.6 | |||
| Jan-2018 | 47927.0 | |||
| Feb-2018 | 48910.1 | |||
| Mar-2018 | 51677.2 | |||
| Apr-2018 | 50496.3 | |||
| May-2018 | 51479.9 | |||
| Jun-2018 | 51933.3 | |||
| Jul-2018 | 51547.0 | |||
| Aug-2018 | 51086.7 | |||
| Sep-2018 | 51191.1 | |||
| Oct-2018 | 50427.9 | |||
| Nov-2018 | 50126.3 | |||
| Dec-2018 | 51167.5 | |||
| Jan-2019 | 51934.4 | |||
| Feb-2019 | 51430.0 | |||
| Mar-2019 | 52688.5 | |||
| Apr-2019 | 51821.0 | |||
| May-2019 | 52622.6 | |||
| Jun-2019 | 51035.6 | |||
| Jul-2019 | 50972.3 | |||
| Aug-2019 | 51703.5 | |||
| Sep-2019 | 50404.5 | |||
| Oct-2019 | 50395.8 | |||
| Nov-2019 | 49475.2 | |||
| Dec-2019 | 49489.3 | |||
| Jan-2020 | 49744.1 | 50018.23 | 48341.44 | 51753.18 |
| Feb-2020 | 50191.5 | 50201.52 | 48211.48 | 52273.7 |
| Mar-2020 | 48579.8 | 50385.48 | 48123.7 | 52753.56 |
| Apr-2020 | 37139.5 | 50570.12 | 48064.32 | 53206.55 |
| May-2020 | 36007.0 | 50755.43 | 48025.72 | 53640.3 |
| Jun-2020 | 43437.0 | 50941.43 | 48003.18 | 54059.52 |
| Jul-2020 | 48482.9 | 51128.1 | 47993.55 | 54467.38 |
| Aug-2020 | 48557.3 | 51315.46 | 47994.58 | 54866.12 |
| Sep-2020 | 49654.0 | 51503.51 | 48004.62 | 55257.41 |
| Oct-2020 | 50544.5 | 51692.24 | 48022.41 | 55642.52 |
| Nov-2020 | 50236.2 | 51881.67 | 48046.96 | 56022.43 |
| Dec-2020 | 49433.9 | 52071.79 | 48077.48 | 56397.94 |
| Jan-2021 | 50073.5 | 52262.61 | 48113.33 | 56769.71 |
| Feb-2021 | 48975.8 | 52454.12 | 48153.99 | 57138.26 |
| Mar-2021 | 51991.5 | 52646.34 | 48198.99 | 57504.05 |
| Apr-2021 | 50121.2 | 52839.26 | 48247.97 | 57867.46 |
| May-2021 | 51537.8 | 53032.89 | 48300.61 | 58228.82 |
| Jun-2021 | 51388.8 | 53227.23 | 48356.63 | 58588.41 |
| Jul-2021 | 53623.1 | 53422.28 | 48415.78 | 58946.49 |
| Aug-2021 | 53079.3 | 53618.05 | 48477.86 | 59303.27 |
| Sep-2021 | 51610.8 | 53814.53 | 48542.67 | 59658.93 |
| Oct-2021 | 54156.2 | 54011.74 | 48610.06 | 60013.66 |
| Nov-2021 | 54209.66 | 48679.87 | 60367.61 | |
| Dec-2021 | 54408.31 | 48751.97 | 60720.92 |
Text version
| Date | Quantities | Point Estimates | Lower bound of CI | Upper bound of CI |
|---|---|---|---|---|
| Jan-2010 | 76.04 | |||
| Feb-2010 | 77.94 | |||
| Mar-2010 | 82.70 | |||
| Apr-2010 | 80.34 | |||
| May-2010 | 82.37 | |||
| Jun-2010 | 83.21 | |||
| Jul-2010 | 83.75 | |||
| Aug-2010 | 84.67 | |||
| Sep-2010 | 84.56 | |||
| Oct-2010 | 84.08 | |||
| Nov-2010 | 83.66 | |||
| Dec-2010 | 84.18 | |||
| Jan-2011 | 86.73 | |||
| Feb-2011 | 83.94 | |||
| Mar-2011 | 87.24 | |||
| Apr-2011 | 86.68 | |||
| May-2011 | 87.17 | |||
| Jun-2011 | 86.27 | |||
| Jul-2011 | 87.70 | |||
| Aug-2011 | 88.15 | |||
| Sep-2011 | 87.12 | |||
| Oct-2011 | 89.20 | |||
| Nov-2011 | 87.73 | |||
| Dec-2011 | 89.49 | |||
| Jan-2012 | 89.16 | |||
| Feb-2012 | 89.41 | |||
| Mar-2012 | 90.23 | |||
| Apr-2012 | 89.35 | |||
| May-2012 | 89.74 | |||
| Jun-2012 | 90.72 | |||
| Jul-2012 | 92.08 | |||
| Aug-2012 | 89.69 | |||
| Sep-2012 | 89.86 | |||
| Oct-2012 | 88.71 | |||
| Nov-2012 | 91.84 | |||
| Dec-2012 | 90.01 | |||
| Jan-2013 | 90.82 | |||
| Feb-2013 | 91.43 | |||
| Mar-2013 | 91.12 | |||
| Apr-2013 | 93.16 | |||
| May-2013 | 92.73 | |||
| Jun-2013 | 90.86 | |||
| Jul-2013 | 90.89 | |||
| Aug-2013 | 92.91 | |||
| Sep-2013 | 91.67 | |||
| Oct-2013 | 90.86 | |||
| Nov-2013 | 93.32 | |||
| Dec-2013 | 91.94 | |||
| Jan-2014 | 90.19 | |||
| Feb-2014 | 92.19 | |||
| Mar-2014 | 91.77 | |||
| Apr-2014 | 92.77 | |||
| May-2014 | 95.99 | |||
| Jun-2014 | 94.09 | |||
| Jul-2014 | 94.34 | |||
| Aug-2014 | 94.72 | |||
| Sep-2014 | 95.31 | |||
| Oct-2014 | 96.81 | |||
| Nov-2014 | 94.81 | |||
| Dec-2014 | 95.77 | |||
| Jan-2015 | 94.21 | |||
| Feb-2015 | 93.88 | |||
| Mar-2015 | 97.07 | |||
| Apr-2015 | 94.12 | |||
| May-2015 | 94.58 | |||
| Jun-2015 | 94.63 | |||
| Jul-2015 | 93.36 | |||
| Aug-2015 | 94.19 | |||
| Sep-2015 | 92.64 | |||
| Oct-2015 | 93.28 | |||
| Nov-2015 | 93.80 | |||
| Dec-2015 | 93.29 | |||
| Jan-2016 | 93.38 | |||
| Feb-2016 | 94.53 | |||
| Mar-2016 | 94.00 | |||
| Apr-2016 | 94.42 | |||
| May-2016 | 93.50 | |||
| Jun-2016 | 93.59 | |||
| Jul-2016 | 92.18 | |||
| Aug-2016 | 93.94 | |||
| Sep-2016 | 99.10 | |||
| Oct-2016 | 93.08 | |||
| Nov-2016 | 92.23 | |||
| Dec-2016 | 93.17 | |||
| Jan-2017 | 97.16 | |||
| Feb-2017 | 97.07 | |||
| Mar-2017 | 95.83 | |||
| Apr-2017 | 96.86 | |||
| May-2017 | 98.78 | |||
| Jun-2017 | 98.81 | |||
| Jul-2017 | 96.39 | |||
| Aug-2017 | 95.83 | |||
| Sep-2017 | 98.24 | |||
| Oct-2017 | 96.00 | |||
| Nov-2017 | 100.39 | |||
| Dec-2017 | 101.73 | |||
| Jan-2018 | 98.14 | |||
| Feb-2018 | 99.24 | |||
| Mar-2018 | 103.52 | |||
| Apr-2018 | 101.33 | |||
| May-2018 | 102.84 | |||
| Jun-2018 | 101.44 | |||
| Jul-2018 | 100.10 | |||
| Aug-2018 | 99.02 | |||
| Sep-2018 | 99.10 | |||
| Oct-2018 | 98.56 | |||
| Nov-2018 | 97.52 | |||
| Dec-2018 | 98.36 | |||
| Jan-2019 | 100.21 | |||
| Feb-2019 | 101.12 | |||
| Mar-2019 | 102.60 | |||
| Apr-2019 | 100.39 | |||
| May-2019 | 101.88 | |||
| Jun-2019 | 99.12 | |||
| Jul-2019 | 100.24 | |||
| Aug-2019 | 101.23 | |||
| Sep-2019 | 98.89 | |||
| Oct-2019 | 98.85 | |||
| Nov-2019 | 97.77 | |||
| Dec-2019 | 97.70 | |||
| Jan-2020 | 97.29 | 98.88347 | 95.99835 | 101.8553 |
| Feb-2020 | 98.37 | 99.08343 | 95.90724 | 102.3648 |
| Mar-2020 | 93.00 | 99.2838 | 95.84008 | 102.8513 |
| Apr-2020 | 74.03 | 99.48458 | 95.79166 | 103.3199 |
| May-2020 | 70.79 | 99.68576 | 95.75842 | 103.7742 |
| Jun-2020 | 86.85 | 99.88735 | 95.73782 | 104.2167 |
| Jul-2020 | 95.26 | 100.0893 | 95.72795 | 104.6494 |
| Aug-2020 | 96.15 | 100.2917 | 95.72734 | 105.0738 |
| Sep-2020 | 97.82 | 100.4946 | 95.73482 | 105.4909 |
| Oct-2020 | 99.08 | 100.6978 | 95.74946 | 105.9018 |
| Nov-2020 | 99.16 | 100.9014 | 95.7705 | 106.3072 |
| Dec-2020 | 98.63 | 101.1055 | 95.7973 | 106.7077 |
| Jan-2021 | 99.12 | 101.3099 | 95.82932 | 107.104 |
| Feb-2021 | 96.35 | 101.5148 | 95.86611 | 107.4963 |
| Mar-2021 | 103.60 | 101.7201 | 95.90727 | 107.8852 |
| Apr-2021 | 97.98 | 101.9258 | 95.95248 | 108.2709 |
| May-2021 | 101.64 | 102.1319 | 96.00142 | 108.6538 |
| Jun-2021 | 99.76 | 102.3384 | 96.05385 | 109.0342 |
| Jul-2021 | 101.22 | 102.5454 | 96.10953 | 109.4122 |
| Aug-2021 | 98.86 | 102.7527 | 96.16825 | 109.7881 |
| Sep-2021 | 94.83 | 102.9605 | 96.22983 | 110.162 |
| Oct-2021 | 100.1214 | 103.1687 | 96.29412 | 110.5342 |
| Nov-2021 | 103.3774 | 96.36095 | 110.9047 | |
| Dec-2021 | 103.5864 | 96.4302 | 111.2737 |
Text version
| Date | Prices | Point Estimates | Lower bound of CI | Upper bound of CI |
|---|---|---|---|---|
| Jan-2010 | 82.07 | |||
| Feb-2010 | 82.80 | |||
| Mar-2010 | 80.22 | |||
| Apr-2010 | 79.68 | |||
| May-2010 | 82.06 | |||
| Jun-2010 | 81.64 | |||
| Jul-2010 | 81.89 | |||
| Aug-2010 | 82.37 | |||
| Sep-2010 | 82.26 | |||
| Oct-2010 | 82.21 | |||
| Nov-2010 | 82.31 | |||
| Dec-2010 | 82.23 | |||
| Jan-2011 | 82.85 | |||
| Feb-2011 | 83.08 | |||
| Mar-2011 | 83.59 | |||
| Apr-2011 | 83.47 | |||
| May-2011 | 84.57 | |||
| Jun-2011 | 84.73 | |||
| Jul-2011 | 83.56 | |||
| Aug-2011 | 85.33 | |||
| Sep-2011 | 86.95 | |||
| Oct-2011 | 87.42 | |||
| Nov-2011 | 88.10 | |||
| Dec-2011 | 86.61 | |||
| Jan-2012 | 86.98 | |||
| Feb-2012 | 86.53 | |||
| Mar-2012 | 85.51 | |||
| Apr-2012 | 85.98 | |||
| May-2012 | 86.85 | |||
| Jun-2012 | 87.25 | |||
| Jul-2012 | 86.04 | |||
| Aug-2012 | 85.07 | |||
| Sep-2012 | 84.55 | |||
| Oct-2012 | 85.14 | |||
| Nov-2012 | 85.38 | |||
| Dec-2012 | 84.38 | |||
| Jan-2013 | 84.89 | |||
| Feb-2013 | 85.83 | |||
| Mar-2013 | 86.20 | |||
| Apr-2013 | 85.37 | |||
| May-2013 | 85.20 | |||
| Jun-2013 | 85.93 | |||
| Jul-2013 | 86.63 | |||
| Aug-2013 | 87.19 | |||
| Sep-2013 | 87.53 | |||
| Oct-2013 | 87.47 | |||
| Nov-2013 | 86.69 | |||
| Dec-2013 | 87.89 | |||
| Jan-2014 | 89.44 | |||
| Feb-2014 | 90.29 | |||
| Mar-2014 | 91.32 | |||
| Apr-2014 | 91.32 | |||
| May-2014 | 90.91 | |||
| Jun-2014 | 90.28 | |||
| Jul-2014 | 90.31 | |||
| Aug-2014 | 90.40 | |||
| Sep-2014 | 90.93 | |||
| Oct-2014 | 91.21 | |||
| Nov-2014 | 91.54 | |||
| Dec-2014 | 91.44 | |||
| Jan-2015 | 92.69 | |||
| Feb-2015 | 92.67 | |||
| Mar-2015 | 93.74 | |||
| Apr-2015 | 93.98 | |||
| May-2015 | 93.29 | |||
| Jun-2015 | 93.45 | |||
| Jul-2015 | 96.30 | |||
| Aug-2015 | 96.25 | |||
| Sep-2015 | 97.65 | |||
| Oct-2015 | 95.78 | |||
| Nov-2015 | 96.17 | |||
| Dec-2015 | 97.33 | |||
| Jan-2016 | 97.95 | |||
| Feb-2016 | 96.19 | |||
| Mar-2016 | 92.99 | |||
| Apr-2016 | 92.35 | |||
| May-2016 | 93.04 | |||
| Jun-2016 | 93.71 | |||
| Jul-2016 | 94.52 | |||
| Aug-2016 | 94.95 | |||
| Sep-2016 | 94.69 | |||
| Oct-2016 | 96.12 | |||
| Nov-2016 | 96.12 | |||
| Dec-2016 | 95.75 | |||
| Jan-2017 | 94.66 | |||
| Feb-2017 | 95.34 | |||
| Mar-2017 | 96.71 | |||
| Apr-2017 | 97.69 | |||
| May-2017 | 98.03 | |||
| Jun-2017 | 97.38 | |||
| Jul-2017 | 94.71 | |||
| Aug-2017 | 94.73 | |||
| Sep-2017 | 93.28 | |||
| Oct-2017 | 94.24 | |||
| Nov-2017 | 96.01 | |||
| Dec-2017 | 96.01 | |||
| Jan-2018 | 95.35 | |||
| Feb-2018 | 96.24 | |||
| Mar-2018 | 97.48 | |||
| Apr-2018 | 97.32 | |||
| May-2018 | 97.76 | |||
| Jun-2018 | 99.98 | |||
| Jul-2018 | 100.56 | |||
| Aug-2018 | 100.74 | |||
| Sep-2018 | 100.88 | |||
| Oct-2018 | 99.90 | |||
| Nov-2018 | 100.38 | |||
| Dec-2018 | 101.56 | |||
| Jan-2019 | 101.04 | |||
| Feb-2019 | 99.53 | |||
| Mar-2019 | 100.43 | |||
| Apr-2019 | 100.98 | |||
| May-2019 | 100.80 | |||
| Jun-2019 | 100.24 | |||
| Jul-2019 | 99.14 | |||
| Aug-2019 | 99.78 | |||
| Sep-2019 | 99.50 | |||
| Oct-2019 | 99.52 | |||
| Nov-2019 | 98.78 | |||
| Dec-2019 | 99.02 | |||
| Jan-2020 | 99.79 | 99.06605 | 97.40049 | 100.7601 |
| Feb-2020 | 99.99 | 99.33914 | 96.83456 | 101.9085 |
| Mar-2020 | 102.30 | 99.45889 | 96.55188 | 102.4534 |
| Apr-2020 | 98.03 | 99.58112 | 96.36548 | 102.9041 |
| May-2020 | 99.03 | 99.74265 | 96.21003 | 103.405 |
| Jun-2020 | 97.22 | 99.90879 | 96.07086 | 103.9 |
| Jul-2020 | 99.20 | 100.0659 | 95.95098 | 104.3572 |
| Aug-2020 | 98.67 | 100.2209 | 95.84985 | 104.7913 |
| Sep-2020 | 99.25 | 100.3783 | 95.76369 | 105.2153 |
| Oct-2020 | 99.64 | 100.5367 | 95.68922 | 105.6298 |
| Nov-2020 | 98.93 | 100.695 | 95.62477 | 106.0341 |
| Dec-2020 | 98.04 | 100.8533 | 95.56929 | 106.4294 |
| Jan-2021 | 98.67 | 101.0119 | 95.52182 | 106.8174 |
| Feb-2021 | 99.27 | 101.1708 | 95.48145 | 107.1991 |
| Mar-2021 | 98.00 | 101.3299 | 95.44742 | 107.575 |
| Apr-2021 | 99.92 | 101.4893 | 95.41915 | 107.9456 |
| May-2021 | 99.03 | 101.6489 | 95.39613 | 108.3116 |
| Jun-2021 | 100.60 | 101.8088 | 95.37791 | 108.6734 |
| Jul-2021 | 103.47 | 101.969 | 95.36413 | 109.0313 |
| Aug-2021 | 104.86 | 102.1294 | 95.35444 | 109.3856 |
| Sep-2021 | 106.29 | 102.29 | 95.34854 | 109.7368 |
| Oct-2021 | 105.6278 | 102.4509 | 95.34619 | 110.085 |
| Nov-2021 | 102.6121 | 95.34714 | 110.4305 | |
| Dec-2021 | 102.7735 | 95.3512 | 110.7735 |
5. Impact of export and import prices on the Canadian economy
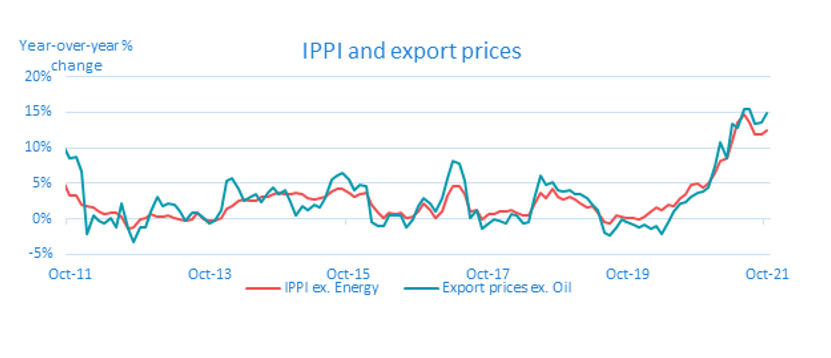
There are two reasons why export and import prices are important for the Canadian economy. The first is that both export and import prices are eventually passed through to domestic prices. If Canadian exporters are price takers then the mechanism is relatively straightforward. When the global price increases, then it is more profitable for exporters to sell their goods on the global market rather than the domestic market. Thereafter, the domestic market adjusts to the new world price. Likewise, when the global price falls, goods should become cheaper in the domestic market. The mechanisms are more complicated if Canadian exporters are price setters rather than price takers, but in general, higher export prices are associated with higher domestic prices. While there is not much of a correlation between export prices and consumer prices, figure 8 shows that industrial prices, as measured by the industrial producer price index (IPPI), and export prices move nearly one-for-one. Consumer price inflation has made headlines recently by being at their highest point since the 1990’s and close to 5%. However, industrial price inflation is actually much higher and as industrial prices rose 12.4% year-over-year as of October.
Figure 8: Export prices excluding oil and IPPI excluding energy Footnote 9
Text version
| Date | IPPI ex. Energy | Export prices ex. Oil |
|---|---|---|
| 01-Jan | 0.032337 | 0.073956 |
| 01-Feb | 0.037372 | 0.062336 |
| 01-Mar | 0.048113 | 0.09608 |
| 01-Apr | 0.048621 | 0.115927 |
| 01-May | 0.035444 | 0.064719 |
| 01-Jun | 0.046079 | 0.090292 |
| 01-Jul | 0.043775 | 0.058898 |
| 01-Aug | 0.050686 | 0.077013 |
| 01-Sep | 0.048976 | 0.100538 |
| 01-Oct | 0.03338 | 0.085583 |
| 01-Nov | 0.031814 | 0.086362 |
| 01-Dec | 0.020396 | 0.067284 |
| 01-Jan | 0.018324 | -0.02101 |
| 01-Feb | 0.01613 | 0.004434 |
| 01-Mar | 0.010207 | -0.00195 |
| 01-Apr | 0.006479 | -0.0069 |
| 01-May | 0.008024 | 0.000667 |
| 01-Jun | 0.007828 | -0.01298 |
| 01-Jul | 0.002993 | 0.020879 |
| 01-Aug | -0.01344 | -0.01431 |
| 01-Sep | -0.01132 | -0.03324 |
| 01-Oct | -0.001 | -0.01156 |
| 01-Nov | 0.000571 | -0.01245 |
| 01-Dec | 0.006546 | 0.01121 |
| 01-Jan | 0.002824 | 0.031327 |
| 01-Feb | 0.002156 | 0.018563 |
| 01-Mar | 0.004603 | 0.021487 |
| 01-Apr | 0.000526 | 0.019035 |
| 01-May | -0.00092 | 0.010431 |
| 01-Jun | -0.00329 | -0.00266 |
| 01-Jul | -0.00094 | 0.00789 |
| 01-Aug | 0.008329 | 0.00919 |
| 01-Sep | -0.001 | 0.000881 |
| 01-Oct | -0.00212 | -0.00575 |
| 01-Nov | -0.00221 | -0.00213 |
| 01-Dec | 0.001818 | 0.012904 |
| 01-Jan | 0.014465 | 0.052626 |
| 01-Feb | 0.018423 | 0.056524 |
| 01-Mar | 0.024665 | 0.04285 |
| 01-Apr | 0.02716 | 0.025311 |
| 01-May | 0.02506 | 0.031247 |
| 01-Jun | 0.024589 | 0.033929 |
| 01-Jul | 0.031026 | 0.02369 |
| 01-Aug | 0.031055 | 0.036979 |
| 01-Sep | 0.034059 | 0.043136 |
| 01-Oct | 0.036652 | 0.034666 |
| 01-Nov | 0.034676 | 0.03975 |
| 01-Dec | 0.034008 | 0.022883 |
| 01-Jan | 0.035678 | 0.005345 |
| 01-Feb | 0.035472 | 0.017576 |
| 01-Mar | 0.02861 | 0.012355 |
| 01-Apr | 0.026393 | 0.019901 |
| 01-May | 0.029546 | 0.016403 |
| 01-Jun | 0.031087 | 0.029152 |
| 01-Jul | 0.037749 | 0.054847 |
| 01-Aug | 0.041583 | 0.060305 |
| 01-Sep | 0.041797 | 0.063792 |
| 01-Oct | 0.036112 | 0.054744 |
| 01-Nov | 0.0313 | 0.039568 |
| 01-Dec | 0.034622 | 0.048624 |
| 01-Jan | 0.03593 | 0.045251 |
| 01-Feb | 0.020489 | -0.00423 |
| 01-Mar | 0.007761 | -0.01032 |
| 01-Apr | 0.00173 | -0.01007 |
| 01-May | 0.007613 | 0.003973 |
| 01-Jun | 0.007306 | 0.004624 |
| 01-Jul | 0.008563 | 0.005421 |
| 01-Aug | 0.001468 | -0.01295 |
| 01-Sep | 0.003243 | -0.00039 |
| 01-Oct | 0.009595 | 0.017075 |
| 01-Nov | 0.021055 | 0.028373 |
| 01-Dec | 0.011245 | 0.02159 |
| 01-Jan | 0.001001 | 0.009772 |
| 01-Feb | 0.011182 | 0.028114 |
| 01-Mar | 0.033079 | 0.056465 |
| 01-Apr | 0.045282 | 0.081872 |
| 01-May | 0.045005 | 0.077956 |
| 01-Jun | 0.034591 | 0.05359 |
| 01-Jul | 0.009611 | 0.000726 |
| 01-Aug | 0.012683 | 0.012087 |
| 01-Sep | -0.00081 | -0.01318 |
| 01-Oct | 0.006987 | -0.00576 |
| 01-Nov | 0.006715 | -0.0007 |
| 01-Dec | 0.010585 | -0.00368 |
| 01-Jan | 0.009693 | -0.0062 |
| 01-Feb | 0.01214 | 0.006266 |
| 01-Mar | 0.008365 | 0.004731 |
| 01-Apr | 0.004108 | -0.0065 |
| 01-May | 0.004045 | -0.00541 |
| 01-Jun | 0.019798 | 0.027616 |
| 01-Jul | 0.036107 | 0.061456 |
| 01-Aug | 0.029813 | 0.047907 |
| 01-Sep | 0.041201 | 0.051174 |
| 01-Oct | 0.030724 | 0.040203 |
| 01-Nov | 0.026811 | 0.037448 |
| 01-Dec | 0.030395 | 0.039435 |
| 01-Jan | 0.027985 | 0.035066 |
| 01-Feb | 0.02065 | 0.034475 |
| 01-Mar | 0.016107 | 0.029625 |
| 01-Apr | 0.018582 | 0.020392 |
| 01-May | 0.008421 | 0.011917 |
| 01-Jun | -0.00526 | -0.01897 |
| 01-Jul | -0.0066 | -0.02366 |
| 01-Aug | 0.004773 | -0.01129 |
| 01-Sep | 0.003339 | -0.00013 |
| 01-Oct | 0.000348 | -0.00514 |
| 01-Nov | 0.000263 | -0.00917 |
| 01-Dec | -0.00124 | -0.01249 |
| 01-Jan | 0.002694 | -0.00853 |
| 01-Feb | 0.010501 | -0.0146 |
| 01-Mar | 0.01599 | -0.00964 |
| 01-Apr | 0.012276 | -0.022 |
| 01-May | 0.018802 | -0.00556 |
| 01-Jun | 0.01751 | 0.010841 |
| 01-Jul | 0.029769 | 0.022005 |
| 01-Aug | 0.033712 | 0.022994 |
| 01-Sep | 0.048354 | 0.030075 |
| 01-Oct | 0.04891 | 0.036844 |
| 01-Nov | 0.043155 | 0.039241 |
| 01-Dec | 0.050451 | 0.044442 |
| 01-Jan | 0.064261 | 0.074103 |
| 01-Feb | 0.081619 | 0.106844 |
| 01-Mar | 0.085633 | 0.085457 |
| 01-Apr | 0.109791 | 0.133768 |
| 01-May | 0.135462 | 0.12901 |
| 01-Jun | 0.146145 | 0.154218 |
| 01-Jul | 0.136584 | 0.153767 |
| 01-Aug | 0.118942 | 0.134708 |
| 01-Sep | 0.117967 | 0.134987 |
| 01-Oct | 0.124407 | 0.14851 |
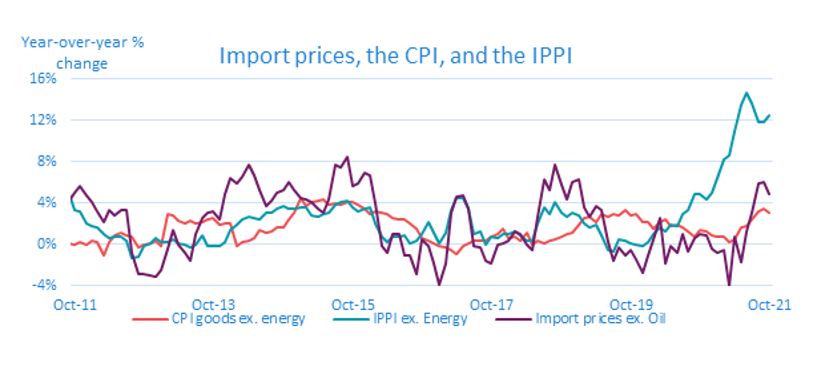
Import prices also have a positive correlation with Canadian domestic prices. When the global price of imports increase, Canadians and Canadian firms either have to pay the new global price for those goods, substitute to a domestic supplier, or use a substitute good. With only mild economic assumptions, in each case the price paid for the goods increases. As seen in figure 9, compared to export prices and industrial prices, import prices and consumer prices have had a much milder increase in the past year.
Figure 9: Import prices excluding oil, the IPPI excluding energy, and CPI goods excluding energy
Text version
| Date | CPI goods ex. energy | IPPI ex. Energy | Import prices ex. Oil |
|---|---|---|---|
| Jan-10 | |||
| Feb-10 | |||
| Mar-10 | |||
| Apr-10 | |||
| May-10 | |||
| Jun-10 | |||
| Jul-10 | |||
| Aug-10 | |||
| Sep-10 | |||
| Oct-10 | |||
| Nov-10 | |||
| Dec-10 | |||
| Jan-11 | -0.00231 | 0.032337 | 0.00209973 |
| Feb-11 | -0.00484 | 0.037372 | -0.005618758 |
| Mar-11 | 0.007491 | 0.048113 | 0.023432698 |
| Apr-11 | -0.00188 | 0.048621 | 0.027871389 |
| May-11 | -0.0052 | 0.035444 | 0.011042676 |
| Jun-11 | -0.01196 | 0.046079 | 0.022128025 |
| Jul-11 | -0.00619 | 0.043775 | 0.003177648 |
| Aug-11 | -0.00469 | 0.050686 | 0.023898616 |
| Sep-11 | 0.000893 | 0.048976 | 0.041706874 |
| Oct-11 | -0.00049 | 0.03338 | 0.049476264 |
| Nov-11 | 0.002362 | 0.031814 | 0.056510712 |
| Dec-11 | -0.00062 | 0.020396 | 0.046825204 |
| Jan-12 | 0.00327 | 0.018324 | 0.040833546 |
| Feb-12 | 0.001868 | 0.01613 | 0.031982464 |
| Mar-12 | -0.01015 | 0.010207 | 0.021863593 |
| Apr-12 | 0.002364 | 0.006479 | 0.032925135 |
| May-12 | 0.009091 | 0.008024 | 0.027745535 |
| Jun-12 | 0.01184 | 0.007828 | 0.032739116 |
| Jul-12 | 0.008712 | 0.002993 | 0.033703405 |
| Aug-12 | 0.007021 | -0.01344 | -0.008420738 |
| Sep-12 | -0.00287 | -0.01132 | -0.029122541 |
| Oct-12 | 4.73E-05 | -0.001 | -0.028720773 |
| Nov-12 | 0.001359 | 0.000571 | -0.030081709 |
| Dec-12 | 0.002914 | 0.006546 | -0.030705783 |
| Jan-13 | -0.00117 | 0.002824 | -0.024800532 |
| Feb-13 | 0.029127 | 0.002156 | -0.00463225 |
| Mar-13 | 0.028296 | 0.004603 | 0.013332442 |
| Apr-13 | 0.023462 | 0.000526 | -0.000660226 |
| May-13 | 0.020418 | -0.00092 | -0.008489108 |
| Jun-13 | 0.022354 | -0.00329 | -0.015195764 |
| Jul-13 | 0.02041 | -0.00094 | 0.010456263 |
| Aug-13 | 0.021642 | 0.008329 | 0.025398993 |
| Sep-13 | 0.024819 | -0.001 | 0.031132973 |
| Oct-13 | 0.025475 | -0.00212 | 0.032184087 |
| Nov-13 | 0.019521 | -0.00221 | 0.02409486 |
| Dec-13 | 0.020921 | 0.001818 | 0.049281399 |
| Jan-14 | 0.020788 | 0.014465 | 0.064682983 |
| Feb-14 | -0.00139 | 0.018423 | 0.058846086 |
| Mar-14 | 0.002889 | 0.024665 | 0.064824056 |
| Apr-14 | 0.002947 | 0.02716 | 0.07699807 |
| May-14 | 0.0064 | 0.02506 | 0.066316472 |
| Jun-14 | 0.013226 | 0.024589 | 0.052604537 |
| Jul-14 | 0.011518 | 0.031026 | 0.037208105 |
| Aug-14 | 0.012688 | 0.031055 | 0.0428672 |
| Sep-14 | 0.016204 | 0.034059 | 0.04972508 |
| Oct-14 | 0.016397 | 0.036652 | 0.051940676 |
| Nov-14 | 0.024546 | 0.034676 | 0.059638632 |
| Dec-14 | 0.031006 | 0.034008 | 0.0530432 |
| Jan-15 | 0.045366 | 0.035678 | 0.044322832 |
| Feb-15 | 0.037662 | 0.035472 | 0.043052472 |
| Mar-15 | 0.041048 | 0.02861 | 0.040990719 |
| Apr-15 | 0.042377 | 0.026393 | 0.03419227 |
| May-15 | 0.043342 | 0.029546 | 0.031211744 |
| Jun-15 | 0.038846 | 0.031087 | 0.044023892 |
| Jul-15 | 0.039265 | 0.037749 | 0.077366657 |
| Aug-15 | 0.038657 | 0.041583 | 0.07493135 |
| Sep-15 | 0.040352 | 0.041797 | 0.084808322 |
| Oct-15 | 0.041144 | 0.036112 | 0.056745986 |
| Nov-15 | 0.037823 | 0.0313 | 0.058489394 |
| Dec-15 | 0.03397 | 0.034622 | 0.069554117 |
| Jan-16 | 0.028968 | 0.03593 | 0.067172267 |
| Feb-16 | 0.032357 | 0.020489 | 0.040210413 |
| Mar-16 | 0.030535 | 0.007761 | -0.001796885 |
| Apr-16 | 0.02966 | 0.00173 | -0.007732983 |
| May-16 | 0.025048 | 0.007613 | 0.010135265 |
| Jun-16 | 0.024194 | 0.007306 | 0.010443443 |
| Jul-16 | 0.023578 | 0.008563 | -0.010958929 |
| Aug-16 | 0.020606 | 0.001468 | -0.010154847 |
| Sep-16 | 0.014888 | 0.003243 | -0.028353195 |
| Oct-16 | 0.006469 | 0.009595 | 0.004823953 |
| Nov-16 | 0.003095 | 0.021055 | -0.000976779 |
| Dec-16 | 0.001137 | 0.011245 | -0.018667016 |
| Jan-17 | -0.00159 | 0.001001 | -0.038587388 |
| Feb-17 | -0.0025 | 0.011182 | -0.018021613 |
| Mar-17 | -0.00516 | 0.033079 | 0.030757471 |
| Apr-17 | -0.00901 | 0.045282 | 0.046312477 |
| May-17 | -0.00183 | 0.045005 | 0.047080116 |
| Jun-17 | 0.000763 | 0.034591 | 0.034341925 |
| Jul-17 | 0.003742 | 0.009611 | -0.001997459 |
| Aug-17 | 0.003389 | 0.012683 | -0.002432888 |
| Sep-17 | 0.003066 | -0.00081 | -0.01615926 |
| Oct-17 | 0.007463 | 0.006987 | -0.018738864 |
| Nov-17 | 0.010004 | 0.006715 | -0.000961319 |
| Dec-17 | 0.014756 | 0.010585 | 0.000674066 |
| Jan-18 | 0.006357 | 0.009693 | 0.003235314 |
| Feb-18 | 0.006794 | 0.01214 | 0.012112864 |
| Mar-18 | 0.004105 | 0.008365 | 0.00939606 |
| Apr-18 | 0.011116 | 0.004108 | -0.000244247 |
| May-18 | -0.00016 | 0.004045 | -0.004937968 |
| Jun-18 | 0.00374 | 0.019798 | 0.026792605 |
| Jul-18 | 0.00047 | 0.036107 | 0.062285132 |
| Aug-18 | 0.004169 | 0.029813 | 0.053184237 |
| Sep-18 | 0.005102 | 0.041201 | 0.076763802 |
| Oct-18 | 0.007874 | 0.030724 | 0.057596604 |
| Nov-18 | 0.009717 | 0.026811 | 0.043266161 |
| Dec-18 | 0.011546 | 0.030395 | 0.060053334 |
| Jan-19 | 0.018695 | 0.027985 | 0.062568672 |
| Feb-19 | 0.025419 | 0.02065 | 0.036289237 |
| Mar-19 | 0.026963 | 0.016107 | 0.026518107 |
| Apr-19 | 0.021236 | 0.018582 | 0.036764239 |
| May-19 | 0.029683 | 0.008421 | 0.032699283 |
| Jun-19 | 0.026912 | -0.00526 | 0.001637127 |
| Jul-19 | 0.029328 | -0.0066 | -0.015175071 |
| Aug-19 | 0.027751 | 0.004773 | -0.002925828 |
| Sep-19 | 0.03258 | 0.003339 | -0.010784879 |
| Oct-19 | 0.028673 | 0.000348 | -0.005590265 |
| Nov-19 | 0.029088 | 0.000263 | -0.014790508 |
| Dec-19 | 0.021897 | -0.00124 | -0.026887322 |
| Jan-20 | 0.021737 | 0.002694 | -0.011087787 |
| Feb-20 | 0.014998 | 0.010501 | 0.004852979 |
| Mar-20 | 0.021108 | 0.01599 | 0.025059057 |
| Apr-20 | 0.02384 | 0.012276 | -0.017882062 |
| May-20 | 0.017731 | 0.018802 | -0.001459828 |
| Jun-20 | 0.019101 | 0.01751 | -0.008269946 |
| Jul-20 | 0.016647 | 0.029769 | 0.009364022 |
| Aug-20 | 0.012437 | 0.033712 | -0.006301414 |
| Sep-20 | 0.007577 | 0.048354 | 0.006318304 |
| Oct-20 | 0.013233 | 0.04891 | 0.010005463 |
| Nov-20 | 0.012288 | 0.043155 | 0.008537364 |
| Dec-20 | 0.008422 | 0.050451 | -0.003844373 |
| Jan-21 | 0.007073 | 0.064261 | -0.007921717 |
| Feb-21 | 0.006998 | 0.081619 | -0.00590183 |
| Mar-21 | 0.002185 | 0.085633 | -0.039846703 |
| Apr-21 | 0.005236 | 0.109791 | 0.006775308 |
| May-21 | 0.016447 | 0.135462 | -0.01764766 |
| Jun-21 | 0.018141 | 0.146145 | 0.012188456 |
| Jul-21 | 0.024295 | 0.136584 | 0.03085261 |
| Aug-21 | 0.0313 | 0.118942 | 0.059006894 |
| Sep-21 | 0.03511 | 0.117967 | 0.059795652 |
| Oct-21 | 0.030588 | 0.124407 | 0.049242417 |
Import prices appear to only have a middling correlation with both consumer prices (as measured by the consumer price index) and industrial prices. Importantly, this does not mean the import prices do not affect domestic prices. Import prices must eventually be passed through to domestic prices. What it means is that there are factors other than import prices that go into determining domestic prices. While this statement may seem trivial, it highlights the tightness of the correlation between industrial prices and export prices in figure 8. Not only do export prices and domestic industrial prices move together, but there doesn’t appear to be much room for other factors to play a role in determining industrial prices. Perhaps the tight correlation is expected as merchandise exports are a subset of industrial production whereas only about 25% of CPI goods are imported.Footnote 10 Footnote 11 While two graphs is insufficient evidence to make any broad claims about the price determination in the Canadian economy, they are suggestive of a tight mechanism.
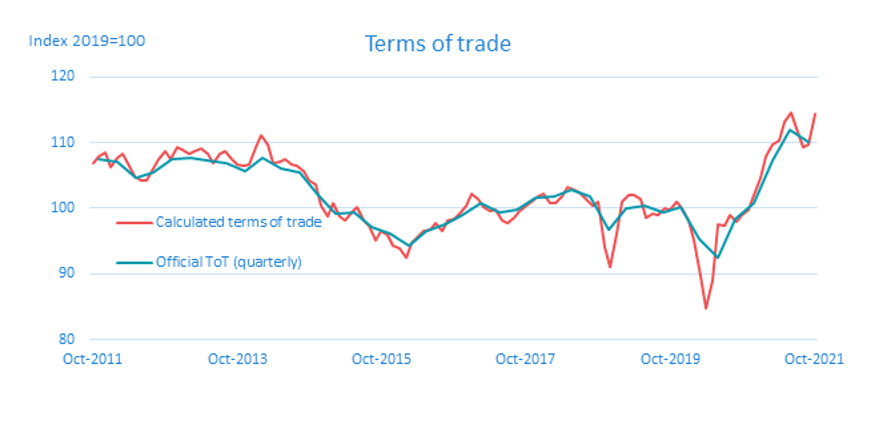
The second reason why trade prices matter is the price of exports relative to the price of imports, known as the terms of trade. If the price of exports increases faster than the price of imports, a terms of trade appreciation, then Canadians are able to consume more imports for the same quantity of exports. In other words, holding export quantities constant, a terms of trade appreciation leads to an increase in utility for Canadians. Conversely, if the price of imports increases faster than the price of exports, a terms of trade depreciation, then Canadians must reduce consumption of imports—resulting in a decrease in utility—or export a higher quantity to compensate for the lower prices. Figure 10 has the official terms of trade from the National accounts (at a quarterly basis) as well as the terms of trade implied by the monthly merchandise price series used in this paper. Footnote 12
Figure 10: Canada’s terms of trade
Text version
| Date | Calculated terms of trade | Official ToT (quarterly) | |
|---|---|---|---|
| Jan-2010 | 102.6084605 | Q1 2010 | 105.5202 |
| Feb-2010 | 102.5266556 | Q2 2010 | 103.8217 |
| Mar-2010 | 103.3777394 | Q3 2010 | 102.6539 |
| Apr-2010 | 102.5714133 | Q4 2010 | 105.2017 |
| May-2010 | 102.1698326 | Q1 2011 | 107.8556 |
| Jun-2010 | 101.8111939 | Q2 2011 | 108.5987 |
| Jul-2010 | 100.8823874 | Q3 2011 | 107.1125 |
| Aug-2010 | 101.2401155 | Q4 2011 | 107.5372 |
| Sep-2010 | 101.1594304 | Q1 2012 | 107.0064 |
| Oct-2010 | 101.6974705 | Q2 2012 | 104.5648 |
| Nov-2010 | 103.0580837 | Q3 2012 | 105.5202 |
| Dec-2010 | 104.3430892 | Q4 2012 | 107.5372 |
| Jan-2011 | 109.9154822 | Q1 2013 | 107.6433 |
| Feb-2011 | 108.1125773 | Q2 2013 | 107.2187 |
| Mar-2011 | 109.1540581 | Q3 2013 | 106.9002 |
| Apr-2011 | 111.5032254 | Q4 2013 | 105.6263 |
| May-2011 | 109.1491724 | Q1 2014 | 107.7495 |
| Jun-2011 | 109.8496733 | Q2 2014 | 106.1571 |
| Jul-2011 | 106.8172873 | Q3 2014 | 105.5202 |
| Aug-2011 | 106.5730348 | Q4 2014 | 102.1231 |
| Sep-2011 | 107.4393116 | Q1 2015 | 99.15074 |
| Oct-2011 | 106.8629414 | Q2 2015 | 99.36306 |
| Nov-2011 | 107.8709812 | Q3 2015 | 97.23992 |
| Dec-2011 | 108.5271943 | Q4 2015 | 96.07219 |
| Jan-2012 | 106.2391332 | Q1 2016 | 94.26752 |
| Feb-2012 | 107.64315 | Q2 2016 | 96.60297 |
| Mar-2012 | 108.3111291 | Q3 2016 | 97.55839 |
| Apr-2012 | 106.4236037 | Q4 2016 | 99.04459 |
| May-2012 | 104.8577221 | Q1 2017 | 100.7431 |
| Jun-2012 | 104.2082841 | Q2 2017 | 99.36306 |
| Jul-2012 | 104.3104594 | Q3 2017 | 99.78769 |
| Aug-2012 | 106.0135112 | Q4 2017 | 101.6985 |
| Sep-2012 | 107.4196258 | Q1 2018 | 101.8047 |
| Oct-2012 | 108.7953552 | Q2 2018 | 102.7601 |
| Nov-2012 | 107.4485133 | Q3 2018 | 101.8047 |
| Dec-2012 | 109.3187695 | Q4 2018 | 96.70913 |
| Jan-2013 | 108.9123463 | Q1 2019 | 99.89384 |
| Feb-2013 | 108.3427073 | Q2 2019 | 100.4246 |
| Mar-2013 | 108.7354772 | Q3 2019 | 99.46921 |
| Apr-2013 | 109.0458128 | Q4 2019 | 100.2123 |
| May-2013 | 108.1950688 | Q1 2020 | 95.32909 |
| Jun-2013 | 106.9508189 | Q2 2020 | 92.46285 |
| Jul-2013 | 108.2483464 | Q3 2020 | 98.30149 |
| Aug-2013 | 108.771687 | Q4 2020 | 100.7431 |
| Sep-2013 | 107.4709872 | Q1 2021 | 107.2187 |
| Oct-2013 | 106.689331 | Q2 2021 | 111.9958 |
| Nov-2013 | 106.4055635 | Q3 2021 | 110.1911 |
| Dec-2013 | 106.6416713 | ||
| Jan-2014 | 109.2040264 | ||
| Feb-2014 | 111.0978875 | ||
| Mar-2014 | 109.7677631 | ||
| Apr-2014 | 106.8677313 | ||
| May-2014 | 107.0447854 | ||
| Jun-2014 | 107.4096525 | ||
| Jul-2014 | 106.6748814 | ||
| Aug-2014 | 106.5243941 | ||
| Sep-2014 | 105.6277926 | ||
| Oct-2014 | 104.1863318 | ||
| Nov-2014 | 103.7074594 | ||
| Dec-2014 | 100.4835757 | ||
| Jan-2015 | 98.76261438 | ||
| Feb-2015 | 100.8780622 | ||
| Mar-2015 | 98.68947548 | ||
| Apr-2015 | 98.20285151 | ||
| May-2015 | 99.3761239 | ||
| Jun-2015 | 100.2006757 | ||
| Jul-2015 | 98.19545517 | ||
| Aug-2015 | 97.29803137 | ||
| Sep-2015 | 95.05497485 | ||
| Oct-2015 | 96.59632497 | ||
| Nov-2015 | 95.862869 | ||
| Dec-2015 | 94.21541538 | ||
| Jan-2016 | 93.8220919 | ||
| Feb-2016 | 92.40591594 | ||
| Mar-2016 | 94.6627222 | ||
| Apr-2016 | 95.63216477 | ||
| May-2016 | 96.57379556 | ||
| Jun-2016 | 96.83280051 | ||
| Jul-2016 | 97.74825623 | ||
| Aug-2016 | 96.45556779 | ||
| Sep-2016 | 98.08438267 | ||
| Oct-2016 | 98.37345203 | ||
| Nov-2016 | 99.11566843 | ||
| Dec-2016 | 100.446543 | ||
| Jan-2017 | 102.223504 | ||
| Feb-2017 | 101.3068401 | ||
| Mar-2017 | 100.1183875 | ||
| Apr-2017 | 99.6681891 | ||
| May-2017 | 99.73744835 | ||
| Jun-2017 | 98.20048942 | ||
| Jul-2017 | 97.76805062 | ||
| Aug-2017 | 98.56491591 | ||
| Sep-2017 | 99.62255216 | ||
| Oct-2017 | 100.3173625 | ||
| Nov-2017 | 101.0067552 | ||
| Dec-2017 | 101.8605562 | ||
| Jan-2018 | 102.1689234 | ||
| Feb-2018 | 100.7492933 | ||
| Mar-2018 | 100.793429 | ||
| Apr-2018 | 101.7082464 | ||
| May-2018 | 103.2398301 | ||
| Jun-2018 | 102.7478125 | ||
| Jul-2018 | 102.3474946 | ||
| Aug-2018 | 101.3804811 | ||
| Sep-2018 | 100.4109412 | ||
| Oct-2018 | 100.9598324 | ||
| Nov-2018 | 94.17145074 | ||
| Dec-2018 | 91.02036832 | ||
| Jan-2019 | 96.16237256 | ||
| Feb-2019 | 100.9940961 | ||
| Mar-2019 | 102.0696188 | ||
| Apr-2019 | 102.0441386 | ||
| May-2019 | 101.3052071 | ||
| Jun-2019 | 98.59993793 | ||
| Jul-2019 | 99.19730081 | ||
| Aug-2019 | 98.94831663 | ||
| Sep-2019 | 100.0163991 | ||
| Oct-2019 | 99.7403787 | ||
| Nov-2019 | 100.9614184 | ||
| Dec-2019 | 99.97066559 | ||
| Jan-2020 | 98.09248584 | ||
| Feb-2020 | 95.08811014 | ||
| Mar-2020 | 89.68444919 | ||
| Apr-2020 | 84.83798657 | ||
| May-2020 | 88.95966382 | ||
| Jun-2020 | 97.57221371 | ||
| Jul-2020 | 97.35314651 | ||
| Aug-2020 | 98.87474568 | ||
| Sep-2020 | 97.95153497 | ||
| Oct-2020 | 99.02315018 | ||
| Nov-2020 | 99.70569841 | ||
| Dec-2020 | 102.0682229 | ||
| Jan-2021 | 104.5650931 | ||
| Feb-2021 | 107.8979315 | ||
| Mar-2021 | 109.6975632 | ||
| Apr-2021 | 110.3775797 | ||
| May-2021 | 113.0938645 | ||
| Jun-2021 | 114.5436261 | ||
| Jul-2021 | 112.1069196 | ||
| Aug-2021 | 109.2621882 | ||
| Sep-2021 | 109.8103979 | ||
| Oct-2021 | 114.3018284 | ||
| Nov-2021 | |||
| Dec-2021 |
The calculated and official data tell identical stories. Canada’s terms of trade deteriorated half-way through the 2010’s, corresponding to the decrease in the price of oil, before partially rebounding in the latter half of the decade. During the pandemic, export prices fell more than import prices, before export prices came roaring back. According to the official statistics, the terms of trade in the second quarter of 2021 was at the highest level since the second quarter in 2008, and the second highest level ever. Complicating the narrative is that export quantities have not stayed constant; regardless, the current trade prices by themselves are good for Canadians—each unit of exports is able to buy more imports.
6. Conclusion
This paper has explored how trade prices and quantities have changed over the course of the COVID-19 pandemic. In value terms, merchandise exports have rebounded from the pandemic dip experienced at the start of the pandemic and are 13% above pre-pandemic levels. However, this is the product of export prices being 21% above their pre-pandemic level and export quantities being 6% below their pre-pandemic level. The increase in export prices and decrease in export quantities is not the consequence of any good in particular, but rather are broad based. Importantly, the high prices and low quantities are not a continuance of the initial pandemic drop—both of these trends only emerged in 2021. The import side is milder, prices are 5% above pre-pandemic levels, while import quantities are roughly equal to their pre-pandemic level.
Export prices have increased more than import prices, leading to a terms of trade appreciation and one of the highest terms of trade levels ever. This is a net benefit as Canadians can consume more imports while producing the same amount of exports. Increasing import prices raises the price for Canadian consumers and businesses—however, the correlation is only mild suggesting that factors other than import prices play important roles for determining domestic prices. Export prices, on the other hand, have a tight correlation with industrial prices suggesting that when world prices for Canadian exports increase, Canadian industrial prices increase almost the same amount.
7. Appendix 1: Largest contributions to growth
Table 3: Largest contribution to growth for export quantities
| 2019-May 2020 | May 2020-October 2021 | 2019-October 2021 | |||
|---|---|---|---|---|---|
| Amount | Product | Amount | Product | Amount | Product |
| -22% | total | 21% | total | -6.2% | total |
| Largest positive contributions | |||||
| 0.3 p.p. | pharmaceutical | 6.2 p.p. | cars and light trucks | 0.8 p.p. | crude oil/bitumen |
| 0.3 p.p. | wheat | 3.4 p.p. | auto parts | 0.6 p.p. | iron & steel products |
| 0.2 p.p. | fruit/nuts/vegetables/pulses | 3.2 p.p. | crude oil and bitumen | 0.4 p.p. | miscellaneous goods and supplies |
| 0.2 p.p. | other crop products | 1.3 p.p. | iron & steel products | 0.4 p.p. | pharmaceutical |
| 0.1 p.p. | intermediate food products | 0.7 p.p. | potash | 0.3 p.p. | iron ores and concentrates |
| 0.1 p.p. | canola | 0.7 p.p. | other machinery | 0.3 p.p. | other food products |
| 0.1 p.p. | electricity | 0.6 p.p. | iron ores and concentrates | 0.3 p.p. | potash |
| 0.1 p.p. | asphalt | 0.5 p.p. | other food products | 0.3 p.p. | other crop products |
| 0.1 p.p. | copper ores | 0.5 p.p. | medium/heavy trucks | 0.3 p.p. | plastic resins |
| 0.1 p.p. | animal feed | 0.5 p.p. | miscellaneous goods and supplies | 0.2 p.p. | electronic and electrical parts |
| Largest negative contributions | |||||
| -8.3 p.p. | cars and light trucks | -1.0 p.p. | wheat | -3.5 p.p. | cars and light trucks |
| -2.7 p.p. | auto parts | -0.9 p.p. | precious metals | -0.9 p.p. | precious metals |
| -1.7 p.p. | crude oil and bitumen | -0.7 p.p. | refined energy products | -0.7 p.p. | refined energy products |
| -0.9 p.p. | other machinery | -0.4 p.p. | fruit/nuts/vegetables/pulses | -0.5 p.p. | aircraft parts |
| -0.7 p.p. | aircraft parts | -0.3 p.p. | electricity | -0.5 p.p. | wheat |
| -0.7 p.p. | medium/heavy trucks | -0.3 p.p. | intermediate food products | -0.4 p.p. | other machinery |
| -0.6 p.p. | balance of payments adjustments | -0.2 p.p. | copper ores | -0.3 p.p. | balance of payments adjustments |
| -0.4 p.p. | lubricants/other petroleum products | -0.2 p.p. | nickel and nickel alloys | -0.3 p.p. | medium/heavy trucks |
| -0.4 p.p. | boats/transportation products | -0.1 p.p. | special transactions trade | -0.3 p.p. | boats/transportation products |
| -0.4 p.p. | furniture and fixtures | -0.1 p.p. | machinery and equipment | -0.3 p.p. | aircraft |
Table 4: Largest contribution to growth for export prices
| 2019-May 2020 | May 2020-October 2021 | 2019-October 2021 | |||
|---|---|---|---|---|---|
| Amount | Product | Amount | Product | Amount | Product |
| -12% | total | 37% | total | 21% | total |
| Largest positive contributions | |||||
| 1.3 p.p. | precious metals | 19 p.p. | crude oil/bitumen | 5.0 p.p. | crude oil/bitumen |
| 0.4 p.p. | meat products | 2.0 p.p. | natural gas | 1.4 p.p. | lumber and other sawmill products |
| 0.2 p.p. | fruit/nuts/vegetables | 1.8 p.p. | coal | 1.4 p.p. | natural gas |
| 0.2 p.p. | balance of payments adjustments | 1.5 p.p. | lumber and other sawmill products | 1.3 p.p. | coal |
| 0.2 p.p. | wheat | 1.2 p.p. | refined energy products | 0.9 p.p. | aluminum and aluminum alloys |
| 0.2 p.p. | other food products | 1.2 p.p. | aluminum/alloys | 0.7 p.p. | precious metals |
| 0.2 p.p. | miscellaneous goods and supplies | 0.8 p.p. | iron & steel products | 0.7 p.p. | iron & steel products |
| 0.1 p.p. | lumber and other sawmill products | 0.8 p.p. | natural gas liquids | 0.6 p.p. | intermediate food products |
| 0.1 p.p. | iron ores and concentrates | 0.7 p.p. | intermediate food products | 0.5 p.p. | waste and scrap of metal |
| 0.1 p.p. | aircraft | 0.7 p.p. | waste and scrap of metal | 0.5 p.p. | balance of payments adjustment |
| Largest negative contributions | |||||
| -12.1 p.p. | crude oil/bitumen | -0.7 p.p. | precious metals | -0.2 p.p. | pharmaceutical |
| -0.9 p.p. | refined energy products | -0.3 p.p. | pharmaceutical | -0.1 p.p. | electronic and electrical parts |
| -0.4 p.p. | lubricants/other petroleum products | -0.1 p.p. | aircraft parts | -0.1 p.p. | auto parts |
| -0.4 p.p. | natural gas | -0.1 p.p. | aircraft | -0.1 p.p. | fabric, fibre/ yarn/leather |
| -0.2 p.p. | coal | -0.1 p.p. | medical machinery | 0.0 p.p. | computers and computer parts |
| -0.2 p.p. | pulp and paper | -0.1 p.p. | auto parts | 0.0 p.p. | aircraft parts |
| -0.2 p.p. | asphalt | -0.1 p.p. | other food products | 0.0 p.p. | aircraft |
| -0.2 p.p. | plastic resins | -0.1 p.p. | electronic and electrical parts | 0.0 p.p. | medical machinery |
| -0.2 p.p. | natural gas liquids | -0.1 p.p. | fabric, fibre/ yarn/leather | 0.0 p.p. | alcoholic beverages |
| -0.2 p.p. | aluminum/alloys | -0.1 p.p. | computers/parts | 0.0 p.p. | tires |
Table 5: Largest contribution to growth for import quantities
| 2019-May 2020 | May 2020-October 2021 | 2019-October 2021 | |||
|---|---|---|---|---|---|
| Amount | Product | Amount | Product | Amount | Product |
| -29% | total | 41% | total | 0.2% | total |
| Largest positive contributions | |||||
| 2.2 p.p. | precious metals | 12.3 p.p. | cars and light trucks | 0.9 p.p. | miscellaneous goods and supplies |
| 0.6 p.p. | carpets, other textile prod | 4.9 p.p. | auto parts | 0.8 p.p. | special transactions trade |
| 0.4 p.p. | other metal ores and concentrates | 2.4 p.p. | clothing, footwear and accessories | 0.5 p.p. | precious metals |
| 0.4 p.p. | semi-finished non-ferrous metals | 1.7 p.p. | audio & video equipment | 0.5 p.p. | computers and parts |
| 0.2 p.p. | pharmaceutical | 1.7 p.p. | medium/heavy trucks | 0.5 p.p. | pharmaceutical |
| 0.1 p.p. | parts of rail roll stock | 1.5 p.p. | refined energy products | 0.3 p.p. | electrical components |
| 0.1 p.p. | computers and parts | 1.3 p.p. | miscellaneous goods and supplies | 0.3 p.p. | cars and light trucks |
| 0.1 p.p. | nuclear fuel and other energy products | 1.3 p.p. | parts for machinery & equipment | 0.3 p.p. | electronic and electrical parts |
| 0.1 p.p. | fertilizers, pesticides & other chemicals | 1.2 p.p. | special transactions trade | 0.3 p.p. | appliances |
| 0.1 p.p. | alcoholic beverages | 1.2 p.p. | electrical components | 0.3 p.p. | medical equipment |
| Largest negative contributions | |||||
| -8.4 p.p. | cars and light trucks | -2.4 p.p. | precious metals | -2.0 p.p. | auto parts |
| -5.4 p.p. | auto parts | -0.8 p.p. | other metal ores and concentrates | -1.0 p.p. | crude oil and bitumen |
| -1.5 p.p. | medium/heavy trucks | -0.7 p.p. | carpets, other textile | -0.8 p.p. | aircraft parts |
| -1.4 p.p. | clothing, footwear and accessories | -0.5 p.p. | semi-finished non-ferrous metals | -0.4 p.p. | other machinery |
| -1.4 p.p. | refined energy products | -0.3 p.p. | parts of rail roll stock | -0.3 p.p. | iron & steel products |
| -1.2 p.p. | other machinery | -0.3 p.p. | fertilizers, other chemicals | -0.3 p.p. | refined energy products |
| -1.2 p.p. | aircraft parts | -0.1 p.p. | other food products | -0.3 p.p. | medium/heavy trucks |
| -1.2 p.p. | audio/video equipment | -0.1 p.p. | crude oil/bitumen | -0.3 p.p. | aircraft |
| -0.9 p.p. | crude oil and bitumen | -0.1 p.p. | alcoholic beverages | -0.3 p.p. | lubricants/other petroleum products |
| -0.8 p.p. | parts for machinery & equipment | -0.1 p.p. | dyes and pigments, and petrochemicals | -0.3 p.p. | balance of payment adjustments |
Table 6: Largest contributions to growth for import prices
| 2019-May 2020 | May 2020-October 2021 | 2019-October 2021 | |||
|---|---|---|---|---|---|
| Amount | Product | Amount | Product | Amount | Product |
| -1.2% | total | 6.7% | total | 5.4% | total |
| Largest positive contributions | |||||
| 0.3 p.p. | other metal ores and concentrates | 2.2 p.p. | crude oil and bitumen | 1.1 p.p. | iron & steel products |
| 0.3 p.p. | waste and scrap of metal | 1.2 p.p. | iron & steel products | 0.6 p.p. | other metal ores and concentrates |
| 0.2 p.p. | cleaning products | 0.8 p.p. | plastic resins | 0.6 p.p. | plastic resins |
| 0.1 p.p. | computers and parts | 0.7 p.p. | refined energy products | 0.4 p.p. | refined energy products |
| 0.1 p.p. | meat products | 0.7 p.p. | lubricants/other petroleum prod | 0.4 p.p. | precious metals |
| 0.1 p.p. | aircraft parts | 0.5 p.p. | semi-finished nonferrous metals | 0.3 p.p. | lubricants/other petroleum products |
| 0.1 p.p. | fruit/nuts/vegetables/pulses | 0.5 p.p. | precious metals | 0.3 p.p. | balance of payments adjustments |
| 0.1 p.p. | auto parts | 0.5 p.p. | fertilizers, other chemical products | 0.3 p.p. | waste and scrap of metal |
| 0.1 p.p. | pharmaceutical | 0.4 p.p. | natural gas | 0.3 p.p. | fertilizers, chemicals |
| 0.1 p.p. | other machinery | 0.4 p.p. | other metal ores and concentrates | 0.3 p.p. | natural gas |
| Largest negative contributions | |||||
| -1.9 p.p. | crude oil/bitumen | -0.5 p.p. | cars & light trucks | -0.4 p.p. | cars and light trucks |
| -0.4 p.p. | semi-finished nonferrous metals | -0.3 p.p. | medical equipment | -0.3 p.p. | audio/video equipment |
| -0.3 p.p. | lubricants/other petroleum products | -0.3 p.p. | computers and parts | -0.2 p.p. | medical equipment |
| -0.3 p.p. | refined energy products | -0.3 p.p. | audio & video equipment | -0.2 p.p. | electrical components |
| -0.2 p.p. | plastic resins | -0.3 p.p. | electrical components | -0.2 p.p. | miscellaneous goods and supplies |
| -0.2 p.p. | natural gas | -0.2 p.p. | miscellaneous goods and supplies | -0.2 p.p. | computers and computer peripherals |
| -0.2 p.p. | fertilizers, other chemicals | -0.2 p.p. | pharmaceutical | -0.1 p.p. | electronic and electrical parts |
| -0.1 p.p. | precious metals | -0.2 p.p. | fruits/nuts/vegetable | -0.1 p.p. | non-metal minerals |
| -0.1 p.p. | iron & steel products | -0.1 p.p. | electronic and electrical parts | -0.1 p.p. | pharmaceutical |
| -0.1 p.p. | dyes and pigments, and petrochemicals | -0.1 p.p. | non-metallic mineral products | -0.1 p.p. | appliances |
8. Appendix 2: Index numbers
A brief description of the methodology of price and quantity indexes will be given as they are necessary to understand some of the arguments put forth in this paper. The basic index number problem is decomposing the change in value, between period t-1 and period t, into a change in quantity and a change in price. Formally:
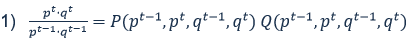
Where pt .qt is the inner product of the price and quantity vector and is equivalent to Σni pit .qit. A functional form is then needed for either the price or quantity formula, and then the other is determined implicitly. Statistics Canada chooses to use the Laspeyres formula, with a base year of 2012, for the quantity index, and a Paasche formula for the price index. Formally:

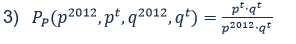
The problem with using the Laspeyres and Paasche indexes is that they ignore the substitution effect. The further away is the base year, the larger the effect tends to be. To see why this is an issue, the Laspeyres quantity index can be re-written as a share weighted average of quantity relatives:
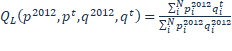

Using 2012 shares of trade to calculate trade effects in 2021 could lead to misleading results. For example, crude oil and bitumen had a 15.6% share of Canadian exports in 2012; by 2019, the share had dropped to 14.1%. By using the 2012 share, the index would be overstating the effect crude oil played on quantities, while understating other items. Likewise the Paasche price index can be written as the current period share weighted harmonic mean of price relatives:


In order to provide more relevant results to 2020, the base year was changed from 2012 to 2019. Compared to the regular price and quantity indexes, the rebased values are different, although highly correlated as expected, as seen in figure 11. One lingering issue is that the series are not completely rebased to 2019. In the construction of price and quantity indices there are two stages of aggregation. The first is taking the raw data (that is, the actual prices and actual quantities sold of various goods) and aggregating using an elementary index that does not use basket weights. We do not have access to this data. This is not an issue in and of itself. However, the issues arises once weights are introduced. For the first series, the most detailed category available is “live animals”. This by itself would require some preliminary aggregation from the elementary indexes. For example, some combination of all live animal exports combine to make this series. This is the problem, the weights to create the most detailed level available are not available and thus cannot be updated to 2019. So the underlying components will still be using outdated shares. Regardless, updating the weights where possible is likely still an improvement from the default Statistics Canada calculations.
Figure 11: Comparison of different base year in the export series
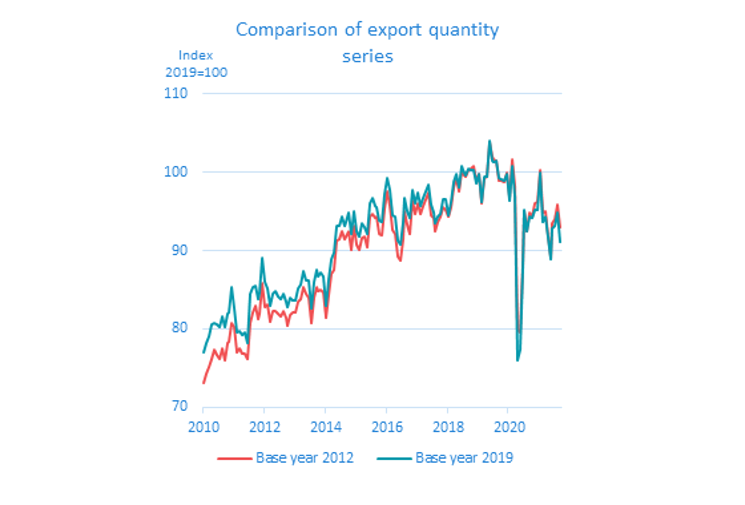
Text version
| Date | Base year 2012 | Base year 2019 |
|---|---|---|
| Jan-10 | 73.04989 | 77.00008 |
| Feb-10 | 74.27831 | 78.17253 |
| Mar-10 | 75.17915 | 79.07119 |
| Apr-10 | 76.16188 | 80.6594 |
| May-10 | 77.3903 | 80.68829 |
| Jun-10 | 76.73514 | 80.50824 |
| Jul-10 | 76.16188 | 80.159 |
| Aug-10 | 77.55408 | 81.60075 |
| Sep-10 | 75.91619 | 80.17148 |
| Oct-10 | 78.12734 | 81.99995 |
| Nov-10 | 78.29114 | 82.11975 |
| Dec-10 | 80.82986 | 85.39749 |
| Jan-11 | 80.17471 | 82.62731 |
| Feb-11 | 77.06272 | 79.58449 |
| Mar-11 | 77.47219 | 79.80108 |
| Apr-11 | 76.81703 | 79.24738 |
| May-11 | 76.81703 | 79.57921 |
| Jun-11 | 76.16188 | 78.17482 |
| Jul-11 | 80.82986 | 84.56251 |
| Aug-11 | 82.05828 | 85.28949 |
| Sep-11 | 82.95912 | 85.55649 |
| Oct-11 | 81.23933 | 83.87154 |
| Nov-11 | 81.97639 | 84.61758 |
| Dec-11 | 85.82543 | 89.14231 |
| Jan-12 | 82.79533 | 86.03919 |
| Feb-12 | 83.12291 | 85.24192 |
| Mar-12 | 80.91176 | 82.94383 |
| Apr-12 | 82.30396 | 84.53242 |
| May-12 | 82.30396 | 84.7924 |
| Jun-12 | 81.89449 | 84.19062 |
| Jul-12 | 81.56692 | 83.77701 |
| Aug-12 | 82.22207 | 84.43224 |
| Sep-12 | 81.48502 | 83.53867 |
| Oct-12 | 80.42039 | 82.84447 |
| Nov-12 | 81.73071 | 84.03428 |
| Dec-12 | 82.05828 | 83.59658 |
| Jan-13 | 82.05828 | 83.65614 |
| Feb-13 | 83.45049 | 85.11671 |
| Mar-13 | 83.85996 | 85.6065 |
| Apr-13 | 85.41595 | 87.33574 |
| May-13 | 84.51511 | 86.15511 |
| Jun-13 | 84.02375 | 86.21367 |
| Jul-13 | 80.82986 | 82.63206 |
| Aug-13 | 83.94186 | 85.96471 |
| Sep-13 | 85.33406 | 87.46877 |
| Oct-13 | 84.8427 | 86.61558 |
| Nov-13 | 85.00648 | 87.24218 |
| Dec-13 | 84.6789 | 86.66904 |
| Jan-14 | 81.40312 | 82.94767 |
| Feb-14 | 84.35133 | 86.29182 |
| Mar-14 | 86.97195 | 88.83881 |
| Apr-14 | 87.46332 | 89.77487 |
| May-14 | 91.23046 | 93.18629 |
| Jun-14 | 91.47615 | 93.23033 |
| Jul-14 | 92.45889 | 94.28082 |
| Aug-14 | 91.47615 | 93.16352 |
| Sep-14 | 91.72183 | 93.71795 |
| Oct-14 | 92.54078 | 94.84592 |
| Nov-14 | 90.08394 | 92.12994 |
| Dec-14 | 93.19593 | 95.0117 |
| Jan-15 | 90.7391 | 92.51473 |
| Feb-15 | 90.08394 | 91.85238 |
| Mar-15 | 91.63994 | 93.44329 |
| Apr-15 | 91.72183 | 93.06494 |
| May-15 | 90.41152 | 92.0725 |
| Jun-15 | 94.26056 | 96.10883 |
| Jul-15 | 94.75193 | 96.67393 |
| Aug-15 | 94.17867 | 95.67551 |
| Sep-15 | 94.42435 | 95.58212 |
| Oct-15 | 92.1313 | 93.87379 |
| Nov-15 | 91.96751 | 93.59132 |
| Dec-15 | 95.32519 | 97.2585 |
| Jan-16 | 97.61823 | 99.31249 |
| Feb-16 | 95.73466 | 97.75781 |
| Mar-16 | 92.70457 | 94.53584 |
| Apr-16 | 92.1313 | 94.30445 |
| May-16 | 89.18311 | 91.32475 |
| Jun-16 | 88.69173 | 90.84039 |
| Jul-16 | 91.39426 | 93.65966 |
| Aug-16 | 95.07951 | 96.64381 |
| Sep-16 | 93.27782 | 94.96364 |
| Oct-16 | 92.2132 | 94.15369 |
| Nov-16 | 96.30792 | 97.76821 |
| Dec-16 | 94.75193 | 96.11182 |
| Jan-17 | 95.98035 | 97.32255 |
| Feb-17 | 94.67004 | 95.71606 |
| Mar-17 | 95.65277 | 96.80349 |
| Apr-17 | 96.5536 | 97.53388 |
| May-17 | 97.45444 | 98.37907 |
| Jun-17 | 94.58814 | 95.8271 |
| Jul-17 | 94.09677 | 94.81239 |
| Aug-17 | 92.45889 | 93.53874 |
| Sep-17 | 93.6873 | 94.37807 |
| Oct-17 | 94.26056 | 94.64249 |
| Nov-17 | 95.57087 | 96.58002 |
| Dec-17 | 95.24329 | 96.50542 |
| Jan-18 | 94.26056 | 94.43024 |
| Feb-18 | 95.48898 | 96.23798 |
| Mar-18 | 98.1096 | 98.70609 |
| Apr-18 | 99.25613 | 99.81286 |
| May-18 | 97.61823 | 98.14173 |
| Jun-18 | 100.157 | 100.8021 |
| Jul-18 | 99.74749 | 100.3468 |
| Aug-18 | 99.41991 | 99.54447 |
| Sep-18 | 100.3208 | 100.4122 |
| Oct-18 | 100.4026 | 100.3565 |
| Nov-18 | 100.7302 | 100.2861 |
| Dec-18 | 98.84665 | 98.55183 |
| Jan-19 | 99.74749 | 99.80656 |
| Feb-19 | 95.98035 | 96.16789 |
| Mar-19 | 99.33802 | 99.39081 |
| Apr-19 | 99.50181 | 99.38548 |
| May-19 | 103.8422 | 104.0745 |
| Jun-19 | 101.9586 | 101.4748 |
| Jul-19 | 101.6311 | 101.3116 |
| Aug-19 | 101.5492 | 101.3921 |
| Sep-19 | 98.84665 | 99.27639 |
| Oct-19 | 98.84665 | 99.02639 |
| Nov-19 | 98.76476 | 98.86588 |
| Dec-19 | 99.99317 | 99.82893 |
| Jan-20 | 96.71739 | 96.35257 |
| Feb-20 | 101.713 | 100.8414 |
| Mar-20 | 98.27339 | 96.82265 |
| Apr-20 | 79.84713 | 76.07655 |
| May-20 | 79.60145 | 77.3713 |
| Jun-20 | 88.28226 | 87.70528 |
| Jul-20 | 94.99761 | 95.14706 |
| Aug-20 | 92.54078 | 92.52689 |
| Sep-20 | 94.83382 | 94.35945 |
| Oct-20 | 94.34245 | 94.16061 |
| Nov-20 | 96.06224 | 95.1461 |
| Dec-20 | 96.14413 | 95.20124 |
| Jan-21 | 100.2389 | 99.89643 |
| Feb-21 | 94.91572 | 93.74117 |
| Mar-21 | 95.07951 | 94.40615 |
| Apr-21 | 91.80373 | 91.61529 |
| May-21 | 89.10121 | 88.82305 |
| Jun-21 | 93.44161 | 92.76961 |
| Jul-21 | 93.93298 | 93.20233 |
| Aug-21 | 95.81656 | 94.78934 |
| Sep-21 | 92.95025 | 91.17814 |
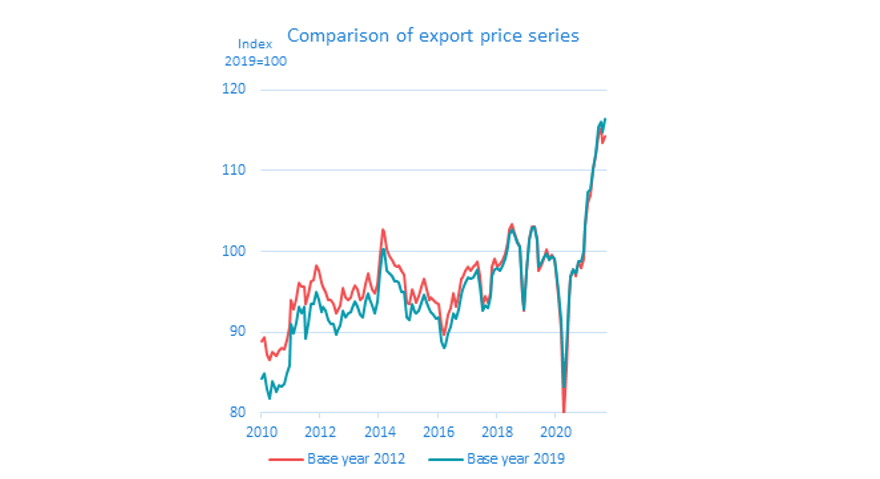
Text version
| Date | Base year 2012 | Base year 2019 |
|---|---|---|
| Jan-10 | 88.82261 | 84.23203 |
| Feb-10 | 89.38776 | 84.90898 |
| Mar-10 | 87.22135 | 82.95088 |
| Apr-10 | 86.56201 | 81.74815 |
| May-10 | 87.50392 | 83.85664 |
| Jun-10 | 87.22135 | 83.13692 |
| Jul-10 | 87.03297 | 82.63609 |
| Aug-10 | 87.7865 | 83.41308 |
| Sep-10 | 87.97488 | 83.23167 |
| Oct-10 | 87.88069 | 83.62605 |
| Nov-10 | 89.01099 | 84.84257 |
| Dec-10 | 90.70644 | 85.81757 |
| Jan-11 | 93.90895 | 91.08422 |
| Feb-11 | 92.77865 | 89.84064 |
| Mar-11 | 94.09733 | 91.26144 |
| Apr-11 | 96.07536 | 93.10031 |
| May-11 | 95.69859 | 92.32743 |
| Jun-11 | 95.60439 | 93.10323 |
| Jul-11 | 93.43799 | 89.27469 |
| Aug-11 | 94.66248 | 90.96827 |
| Sep-11 | 96.35793 | 93.44349 |
| Oct-11 | 96.45212 | 93.44425 |
| Nov-11 | 98.24176 | 95.05479 |
| Dec-11 | 97.67661 | 94.0207 |
| Jan-12 | 96.07536 | 92.43363 |
| Feb-12 | 95.60439 | 93.16949 |
| Mar-12 | 95.03925 | 92.64573 |
| Apr-12 | 94.00314 | 91.52039 |
| May-12 | 93.90895 | 91.09437 |
| Jun-12 | 93.53218 | 90.94125 |
| Jul-12 | 92.30769 | 89.77571 |
| Aug-12 | 92.68446 | 90.21114 |
| Sep-12 | 93.24961 | 90.84753 |
| Oct-12 | 95.5102 | 92.65663 |
| Nov-12 | 94.37991 | 91.76189 |
| Dec-12 | 94.00314 | 92.26453 |
| Jan-13 | 94.37991 | 92.47607 |
| Feb-13 | 94.94505 | 93.01065 |
| Mar-13 | 95.79278 | 93.75332 |
| Apr-13 | 95.22763 | 93.11463 |
| May-13 | 94.00314 | 92.20354 |
| Jun-13 | 94.37991 | 91.92175 |
| Jul-13 | 95.98116 | 93.79208 |
| Aug-13 | 97.20565 | 94.85629 |
| Sep-13 | 96.45212 | 94.08826 |
| Oct-13 | 95.32182 | 93.33903 |
| Nov-13 | 94.75667 | 92.26173 |
| Dec-13 | 95.98116 | 93.75328 |
| Jan-14 | 99.56044 | 97.6972 |
| Feb-14 | 102.6688 | 100.3356 |
| Mar-14 | 102.4804 | 100.26 |
| Apr-14 | 100.2198 | 97.61324 |
| May-14 | 99.46625 | 97.33898 |
| Jun-14 | 98.9011 | 96.99484 |
| Jul-14 | 98.33595 | 96.36244 |
| Aug-14 | 98.14757 | 96.31829 |
| Sep-14 | 98.24176 | 96.06644 |
| Oct-14 | 97.58242 | 95.04571 |
| Nov-14 | 97.11146 | 94.95757 |
| Dec-14 | 93.72057 | 91.89987 |
| Jan-15 | 93.43799 | 91.56508 |
| Feb-15 | 95.32182 | 93.5069 |
| Mar-15 | 94.37991 | 92.52945 |
| Apr-15 | 93.72057 | 92.30933 |
| May-15 | 94.4741 | 92.73167 |
| Jun-15 | 95.60439 | 93.65559 |
| Jul-15 | 96.54631 | 94.5828 |
| Aug-15 | 95.22763 | 93.66759 |
| Sep-15 | 94.00314 | 92.84323 |
| Oct-15 | 94.28571 | 92.54594 |
| Nov-15 | 93.90895 | 92.21719 |
| Dec-15 | 93.62637 | 91.72495 |
| Jan-16 | 93.53218 | 91.91919 |
| Feb-16 | 90.80063 | 88.90779 |
| Mar-16 | 89.76452 | 88.04482 |
| Apr-16 | 90.42386 | 88.33822 |
| May-16 | 92.11931 | 89.87126 |
| Jun-16 | 92.96703 | 90.76282 |
| Jul-16 | 94.75667 | 92.40923 |
| Aug-16 | 93.15542 | 91.60742 |
| Sep-16 | 94.56829 | 92.90143 |
| Oct-16 | 96.6405 | 94.57906 |
| Nov-16 | 96.7347 | 95.29566 |
| Dec-16 | 97.58242 | 96.1993 |
| Jan-17 | 98.14757 | 96.78525 |
| Feb-17 | 97.67661 | 96.60749 |
| Mar-17 | 98.05338 | 96.85031 |
| Apr-17 | 98.52433 | 97.38842 |
| May-17 | 98.80691 | 97.79156 |
| Jun-17 | 96.92308 | 95.64968 |
| Jul-17 | 93.3438 | 92.62218 |
| Aug-17 | 94.4741 | 93.39288 |
| Sep-17 | 93.72057 | 92.95296 |
| Oct-17 | 94.94505 | 94.55989 |
| Nov-17 | 98.05338 | 97.00011 |
| Dec-17 | 99.08949 | 97.81999 |
| Jan-18 | 98.14757 | 97.94234 |
| Feb-18 | 98.52433 | 97.66914 |
| Mar-18 | 98.9011 | 98.29392 |
| Apr-18 | 99.74883 | 99.08158 |
| May-18 | 101.2559 | 100.5879 |
| Jun-18 | 102.763 | 102.1238 |
| Jul-18 | 103.4223 | 102.7639 |
| Aug-18 | 102.292 | 102.0885 |
| Sep-18 | 101.2559 | 101.1108 |
| Oct-18 | 100.5965 | 100.5876 |
| Nov-18 | 94.37991 | 94.71335 |
| Dec-18 | 92.59026 | 92.85962 |
| Jan-19 | 97.67661 | 97.53745 |
| Feb-19 | 101.6327 | 101.3371 |
| Mar-19 | 103.0455 | 102.9003 |
| Apr-19 | 103.0455 | 103.0581 |
| May-19 | 101.5385 | 101.1887 |
| Jun-19 | 97.58242 | 98.03711 |
| Jul-19 | 98.33595 | 98.61741 |
| Aug-19 | 99.08949 | 99.18784 |
| Sep-19 | 100.2198 | 99.74002 |
| Oct-19 | 99.18367 | 98.93613 |
| Nov-19 | 99.65463 | 99.50801 |
| Dec-19 | 98.99529 | 99.09396 |
| Jan-20 | 97.58242 | 97.88359 |
| Feb-20 | 94.28571 | 95.04701 |
| Mar-20 | 90.23548 | 91.52081 |
| Apr-20 | 79.40345 | 83.30407 |
| May-20 | 85.62009 | 88.06623 |
| Jun-20 | 94.00314 | 94.55288 |
| Jul-20 | 97.01727 | 96.79357 |
| Aug-20 | 97.7708 | 97.77126 |
| Sep-20 | 96.92308 | 97.36909 |
| Oct-20 | 98.71272 | 98.83796 |
| Nov-20 | 97.95918 | 98.80437 |
| Dec-20 | 99.18367 | 100.1064 |
| Jan-21 | 103.0455 | 103.3287 |
| Feb-21 | 106.0597 | 107.2799 |
| Mar-21 | 107.0016 | 107.6626 |
| Apr-21 | 110.2041 | 110.3642 |
| May-21 | 111.8995 | 112.1187 |
| Jun-21 | 114.5369 | 115.3654 |
| Jul-21 | 115.2904 | 116.1571 |
| Aug-21 | 113.5008 | 114.7204 |
| Sep-21 | 114.3485 | 116.5155 |
9. Appendix 3: Generating the counter-factuals
As mentioned in the body of the paper, the counter-factuals and confidence intervals were generated using an ARIMA model over the time period January 2010-December 2019. The procedure to select the appropriate ARIMA closely followed the Hyndman-Khandakar algorithm.Footnote 13 First, all series were converted transformed by their natural log. Next, using both the augmented Dickey-Fuller test and the KPSS test, all series were determined to be stationary after the first-difference.Footnote 14 Footnote 15 Footnote 16 Next 16 ARIMA estimations were run for each series, all specified using I(1) data. Allowing the auto-regressive term to vary between 0 and 3, and allowing the moving-average component to vary between 0 and 3, and all combinations thereof. The models were compared using Akaike's Information Criterion with small-sample correction (or AICc).Footnote 17 Next, the parameter of each model was examined for unit roots. If any of the AR terms, the sum of the AR terms, any of the MA terms, or the sum of the MA terms, was exactly equal to 1 or -1, the model was rejected as having a unit-root, and the next best model (based on the AICc) was selected. That model was then checked for unit roots. This proceeded until one of the models didn’t show any signs of unit roots. The linear forecast and confidence interval was then generated using the forecast package in R on the appropriate ARIMA model.Footnote 18 Footnote 19 The last step was to de-log and graph the series and confidence intervals.
The following ARIMA models were selected:
Export values: (0,1,0)
Export prices: (1,1,1)
Export quantities: (0,1,3)
Import values: (0,1,1)
Import prices: (2,1,0)
Import quantities: (0,1,1)
10. References
Brouillette, D., & Savoie-Chabot, L. (2017). Global Factors and Inflation in Canada (No. 2017-17). Bank of Canada.
Dickey, D. A., & Fuller, W. A. (1979). Distribution of the estimators for autoregressive time series with a unit root. Journal of the American statistical association, 74(366a), 427-431.
Hurvich, C. M., & Tsai, C. L. (1993). A corrected Akaike information criterion for vector autoregressive model selection. Journal of time series analysis, 14(3), 271-279.
Hyndman R, Athanasopoulos G, Bergmeir C, Caceres G, Chhay L, O'Hara-Wild M, Petropoulos F, Razbash S, Wang E, Yasmeen F (2021). forecast: Forecasting functions for time series and linear models. R package version 8.15, https://pkg.robjhyndman.com/forecast/.
Hyndman RJ, Khandakar Y (2008). “Automatic time series forecasting: the forecast package for R.” Journal of Statistical Software, 26(3), 1–22. https://www.jstatsoft.org/article/view/v027i03.
Kwiatkowski, D., Phillips, P. C., Schmidt, P., & Shin, Y. (1992). Testing the null hypothesis of stationarity against the alternative of a unit root: How sure are we that economic time series have a unit root?. Journal of econometrics, 54(1-3), 159-178.
Scarffe, C. (2019). Canada’s Geographic Export Diversity, Global Affairs Canada.
Statistics Canada. Table 12-10-0121-01 International merchandise trade by commodity, monthly (x 1,000,000)
Statistics Canada. Table 12-10-0128-01 International merchandise trade, by commodity, price and volume indexes, monthly
Statistics Canada. Table 18-10-0004-01 Consumer Price Index, monthly, not seasonally adjusted
Statistics Canada. Table 18-10-0265-01 Industrial product price index, by major product group, monthly
Statistics Canada. Table 36-10-0105-01 Gross national income and gross domestic income, indexes and related statistics, quarterly
- Date Modified: