
The Economic Impact of the Canada-Chile Free Trade Agreement
Office of the Chief Economist
Foreign Affairs and International Trade Canada
May 30, 2013
PDF Version (1 MB)
Table of Contents
List of Figures
- Figure 1: Effects of Tariff Reductions on Economic Welfare
- Figure 2: Canada and Chile Nominal GDP, 1990-2011, US$ Billion
- Figure 3: Canada/Chile Exchange Rate, 1990-2011
- Figure 4: Value of Canada's Merchandise Trade with Chile, $ Million
- Figure 5: Growth in Value of Canada's Imports from Chile by CCFTA Tariff Reductions (%), 1996-2011
- Figure 6: Growth in Value of Canada's Exports to Chile by Extent of CCFTA Tariff Reductions (%), 1996-2011
- Figure 7: Chile's Share of Canada's Total Imports (%)
- Figure 8: Canada's Share of Chile's Total Imports (%)
- Figure 9: Total Imports of All Common Goods to Chile from Canada and the U.S. (%)
- Figure 10: Imports of Liberalized Common Goods to Chile from Canada and the U.S. (%)
- Figure 11: Difference between Estimated and Expected Welfare Gains from Trade with Chile, 1990-2010
- Figure 12: Canada's and Chile's Exports of Services, 1993-2010, $ Million
- Figure 13: Canadian Foreign Direct Investment in Chile, 1995-2011, $ Million
List of Tables
- Table 1: Key Economic Indicators for Canada, 1996 and 2011
- Table 2: Key Economic Indicators for Chile, 1996 and 2011
- Table 3: List of Bilateral/Regional Trade Agreements in Force in Canada and Chile
- Table 4: Value of Canada's Trade with Major Latin American Countries 1997-2011, $ Million
- Table 5: Growth in Value of Canada's Trade with Latin America by CCFTA Tariff Reductions, (%), 1996-2011
- Table 6: Growth in Value of Chile's Imports from Canada, Australia and the U.S. by CCFTA Tariff Reductions, 1996-2003 and 1996-2008
- Table 7: Top 10 Increases in Value of Canadian Exports to Chile by Product Category and CCFTA Tariff Reductions, 1996 and 2011, $
- Table 8: Top 10 Increases in Value of Canadian Imports from Chile by Product Category and CCFTA Tariff Reductions, 1996 and 2011, $
- Table 9: Number of Products Imported from Chile by CCFTA Tariff Reductions, 1996 and 2011
- Table 10: Values of Imports from Chile by CCFTA Tariff Reductions, 1996 and 2011, $
- Table 11: Number of Products Exported to Chile by CCFTA Tariff Reductions, 1996 and 2011
- Table 12: Values of Exports to Chile by CCFTA Tariff Reductions, 1996 and 2011, $
- Table 13: Regression Results from the Average Treatment Effect Estimation
- Table 14: Extensive and Intensive Margins of Canadian Exports to Chile, 1995-2010
- Table 15: Extensive and Intensive Margins of Canadian Imports from Chile, 1995-2011
- Table 16: Estimated Welfare Gains from Trade with Chile, 1990-2010
- Table 17: Bilateral Trade in Services between Canada and Chile, 1995-2010, $ Million
Executive Summary
The Canada-Chile Free Trade Agreement (CCFTA) entered into force on July 5, 1997, and was path-breaking in many respects for both Canada and Chile. For Canada, it was the first free trade agreement concluded with a major South American country and the most economically-significant trade agreement since the North America Free Trade Agreement (NAFTA). For Chile, it was the first comprehensive free trade agreement concluded with a leading industrialized country.
Fifteen years later, the CCFTA provides sufficient retrospective to assess what the agreement has achieved, and to what extent the agreement has delivered on its potential. During this period, there have been numerous developments in trade theory, regarding in particular the importance of variety and the impact of trade liberalization on new and existing products; hence, the CCFTA constitutes a source of empirical evidence on the significance of an FTA at the "extensive margin" (the introduction of new products into a trading relationship) as well as at the "intensive margin" (change in the volume of trade of currently traded products). Finally, Chile has been very active in signing FTAs since the CCFTA, completing 18 more FTAs after the CCFTA including those with the EU, the U.S., Mexico and China; in this regard, the CCFTA provides an interesting platform to assess the tariff preference erosion effect from the accumulation of FTAs.
In essence, the CCFTA delivered on its promises by allowing both countries to expand their bilateral trade significantly, both in terms of existing trade (intensive margin) and in terms of new trade (extensive margin), and to generate significant income gains:
- On average, bilateral trade flows between the two countries grew 12.2 percent faster than would have been the case in the absence of the CCFTA;
- Canadian exports to Chile grew by an average of 5.4 percent between 1997 and 2011, compared to only 1.7 percent for Latin America as a whole;
- Chile became the third most important destination for Canadian exports to Latin America after Mexico and Brazil in 2011, compared to seventh in 1997;
- The majority of trade gains came from new trade - products that were not traded prior to the CCFTA and for which the CCFTA reduced the entry threshold. The new products accounted for 90 percent of the net increase in the value of Canadian exports to Chile.
- The CCFTA generated benefits beyond the traditional benefits associated with tariff elimination. This suggests that measures to liberalize investment and services, which are common in today's new generation of free trade agreements, along with the added certainty following the trade deal, could have a significant effect on two-way trade in goods over and beyond the effect induced by lower tariffs.
- Canada's overall economic welfare gains from the CCFTA were approximately a quarter of a billion dollars (or $250 million) annually; and
- While Canada's market share in Chile rose after the implementation of the CCFTA, its preference advantages in Chile were eroded by subsequent FTAs between Chile and third countries.
The CCFTA is working as intended, encouraging greater trade between the two countries.
The value of Canadian exports to Chile more than doubled to reach $819 million in 2011 from $392 million in 1997, increasing at an annual rate of 5.4 percent during the past 15 years, and outperforming exports to other major South American countries such as Argentina and Brazil with which Canada did not have preferential trade arrangements. Over the same period, Canadian merchandise exports to the whole Latin American region grew only by 1.7 percent. As a result of this exceptional growth, Chile emerged as the third-most important destination for Canadian exports to Latin America only after Mexico and Brazil in 2011; whereas in 1997, Chile ranked only as the seventh-most important market in Latin America.
Growth of Canadian merchandise imports from Chile since the CCFTA was even more impressive. Total Canadian merchandise imports from Chile grew six fold to reach $1.9 billion in 2011 up from only $326 million in 1997. Even excluding precious metals, which accounted for roughly 50 percent of the total net increase in imports from Chile and were not targeted by the CCFTA, imports from Chile more than tripled.
Canada's export gains to Chile were broad-based and included ores, machinery and equipment, mineral fuels and oils, iron and steel products, plastics, animal fast and vegetable oils, chemical products, pharmaceutical products, precision and medical equipment, and tools of base metal, while import gains from Chile were concentrated in precious stones and metals, copper, fish, and edible fruits and vegetables.
Overall, the results of advanced econometric research indicate that, on average, bilateral trade flows between the two countries grew 12.2 percent faster than would have been the case in the absence of the CCFTA.
The majority of trade gains came from new trade, products that were not traded bilaterally prior to the CCFTA.
After Brazil, Chile is the second-most popular destination in South America for Canadian exporters. The number of Canadian firms that exported to Chile following the implementation of the CCFTA more than doubled to reach 1,281 in 2010 compared to pre-FTA levels.
The number of products that Canada exported to Chile also more than doubled to reach 1,759 products in 2011 from 848 products in 1996. Taking into account the fact that 267 products dropped out of the export mix, there were actually 1,178 new products added to the portfolio of Canadian exports to Chile in 2011. In terms of value, 90 percent of the net increase in the value of Canadian exports to Chile came from the new products that were not exported in 1996.
The number of products that Canada imported from Chile nearly tripled from 454 products in 1996 to 1,210 products in 2011. There was a net increase of 756 products imported from Chile, with 922 new products added and 166 discontinued. In terms of value, more than 76 percent of the net increase in the value of imports came from the new products that were not imported prior to the trade agreement.
CCFTA generated benefits beyond the traditional benefits associated with tariff elimination.
Most of trade growth occurred in products that were duty-free prior to the CCFTA and products that experienced tariff reductions of more than 10 percentage points. The expansion of trade in duty free products means that the effects of "new generation" trade agreements, such as the CCFTA, often extend beyond the traditional benefits associated with tariff elimination and reduction. Measures to liberalize investment and services, along with the improved certainty following the trade deal could have a significant effect on two-way trade in goods over and beyond the effect induced by lower tariffs.
The numerous FTAs signed by Chile following the CCFTA limited the continued expansion of Canadian exports.
Chile was very active in signing FTAs following the CCFTA, completing 18 more FTAs with, among others, the EU, the U.S., Mexico and China. While these FTAs led to an erosion of Canada's tariff preference in the Chilean market and constrained the continued expansion of Canadian exports to Chile, the effects of this erosion seemed to be largely limited to the expansion of Canada's exports of existing products and had only little inhibition on the increase of new Canadian exports to Chile.
This can be explained by the fact that consumers in both countries highly appreciated the new varieties introduced under the CCFTA. At the same time, Chile is a relatively small economy with a population of 17 million, and the expansion of the trade volume for each new Canadian product was constrained by a small Chilean market and the competitive pressures from third countries.
Canada's overall economic welfare gains from the CCFTA were around a quarter of a billion dollars (or $250 million) annually.
1. Introduction
The Canada-Chile Free Trade Agreement (CCFTA) that entered into force on July 5, 1997 was path-breaking in many respects for both Canada and Chile. For Canada, it was the first free trade agreement concluded with a major South American country and the most economically significant trade agreement since the North America Free Trade Agreement (NAFTA). For Chile, it was the first comprehensive free trade agreement concluded with a leading industrialized country.
The year 2012 marks the 15th anniversary of the implementation of the CCFTA; therefore, enough experience has been gained to allow a valid assessment of what the agreement has achieved, and the extent to which the agreement has delivered what it promised when the agreement was inaugurated more than a decade ago. This study takes up these questions.
An assessment of any preferential trade agreement (PTA) entered into prior to the wave of PTAs that have since been signed is always challenging because of the progressive erosion of preferences that were mutually accorded at the time of signing as preferences created under new trade agreements would likely overlap with preferences created under agreements with third parties. This is an important issue in assessing Canada's PTAs since Canada, like the vast majority of industrialized and developing economies, is actively pursuing new bilateral/regional trade liberalization negotiations in response to the impasse of the multilateral trade negotiations under the WTO's Doha Development Agenda.
This is a particularly important issue in the case of Chile because, since the signing of the CCFTA, it has signed PTAs with almost all of its major trading partners. These PTAs overlap extensively in terms of the preferences offered, thereby eroding the value of the concessions initially accorded to Canada and its other PTA partners (although preferences against other potential trading partners remain in place). The CCFTA thus provides a natural experiment to answer questions regarding the size and sources of gains in a world where PTAs are proliferating and swiftly reshaping the global trading system.
This study is organized as follows. The next section proposes a methodology for the CCFTA assessment based on recent literature on PTAs, which sets the stage for the quantitative evaluation on the economic impact of the CCFTA in the subsequent sections. This is followed by a brief summary of changes in the macroeconomic environments for both Canada and Chile during the period in which the implementation of the agreement took place. Then, we apply the proposed methodology to the data and present the results of the quantitative assessment. The last section summarizes the results.
2. The Assessment Methodology
2.1. Literature Review of Economic Assessment of Preferential Trade Agreements
The formal analysis of the economic impact of preferential trade agreements began with the seminal work of Jacob Viner more than a half century ago (Viner, 1950). Unlike the traditional intuition of trade liberalization being always beneficial, he argued that preferential trade agreements could be beneficial or harmful to participating countries because the preferential nature of these trade deals generates both trade creation and trade diversion effects. In Viner's view, the overall welfare gains in the signatory countries therefore depend on the extent of trade creation relative to trade diversion.
In Viner's spirit, the economic effects of preferential trade agreements can be summarized on the export and import sides (WTO, 2011). There are two effects on the export side:
- Improved market access – exporters in FTA partner countries gain market access to each other when tariffs in both home and partner countries are removed or reduced.
- Preferential advantages – the agreement gives exporters in FTA partner countries preferential advantages relative to imports from third countries, which would otherwise not exist if liberalization were carried out in a non-discriminatory multilateral fashion. However, the preferential advantages would be eroded if the partner country formed a new preferential agreement with a third country.
On the import side, the effects are ambiguous:
- Trade creation effect: This refers to the increase in imports from partner countries induced by liberalization to displace high-cost and less efficient domestic production. This type of increase in imports is economic-welfare improving. Consider a case in which home country signs a preferential free trade agreement with a partner country (See Figure 1). In such situation, imports from the partner country are no longer subject to tariffs, and the domestic price of the good falls to P. At this price, home country will import from the partner country the quantity Q2 - Q1. Assume that home country concludes a preferential trade agreement with the most efficient producer; the agreement results in pure trade creation. The gains from trade creation are measured by the shaded triangles "b", which represents gains in producer surplus, and "d", which represents gains in consumer surplus. Government loses all tariff revenues that were previously collected on imports of the product (depicted as the area "c"). Thus, the overall net effect of the preferential trade agreement for national economic welfare is positive with a gain of "b + d".
Figure 1: Effects of Tariff Reductions on Economic Welfare

- Trade diversion effect: This refers to imports diverted to a less efficient partner country from an efficient supplier due to the preferential arrangements, which is welfare decreasing. This effect would not take place if tariff liberalization were carried out in a non-discriminatory fashion.
The effects of preferential trade agreements are not limited to trade creation and diversion as defined in Viner's premise. Subsequent research in the context of the "new trade theory" in the 1980s-1990s and the "new new trade theory" in the 2000s has shed new light on the sources of gains from trade liberalization.
The "new trade theory" developed in the 1980s attempted to explain rising intra-industry trade in differentiated products among countries at similar income levels on the basis of love of variety by consumers and product differentiation by firms operating under conditions of monopolistic competition and facing increasing returns to scale Footnote 1. According to this theory, consumers' preference for variety and their willingness to pay premium for varieties is the key driver for trade in differentiated products between countries. Producers invest in developing niche products in response to consumer's desire for variety and in doing so manage to obtain monopoly profits in the niche market. However, as the market fragments into niche products, producers struggle to attain the scale of production necessary to survive. A larger marketplace can be created by liberalization through preferential trade arrangements and this allows producers to operate at a larger scale for each niche product. Trade liberalization also erodes incumbent producers' market power as it brings foreign competition into the market. The outcomes of trade liberalization are more varieties at lower prices for consumers and a larger market for producers.
The more recently emerged "new new trade theory" places its emphasis on the central role of firms in international trade Footnote 2. It singles out the "reallocation effect" at the firm level as a new source of gains from trade. This is based on the observation that firms are very different even within narrowly defined industries. Some firms can be larger, more productive or more profitable than others. When trade is liberalized, the most productive firms thrive and expand into foreign markets, while least productive firms shrink and even exit the market when facing foreign competition. As a result, average productivity in the industry increases because market shares and resources are reallocated from less-efficient firms to more-efficient firms. This generates a new source of gains from trade, in addition to the gains from comparative advantage/specialization and product varieties/increasing returns identified in the traditional and "new" trade theories.
Before the arrival of the "new trade theory", the effect of trade liberalization was generally conceptualized in terms of the expansion of the volume of trade in products that were already being traded - indeed, insofar as trade impacted on varieties, the theory of comparative advantage implied a narrowing of production palettes as each country focused on producing and exporting the things it was most efficient in producing. The possibility of a change in product mixes, in particular, entries of new products, new markets and new firms in freer trade was simply overlooked. It is now well recognized that reductions in trade costs through tariff reductions and trade facilitation lead not just to the expansion of trade flows for existing products (the so-called "intensive margin of trade") but to the creation of new trade due to the entry of new firms and new products ("extensive margin of trade").
The extensive margin effect emerges clearly under "new new trade theory" because it explicitly takes into account the fact that firms must incur up-front fixed and sunk costs Footnote 3 to establish themselves in international markets. Many firms, including some productive ones, choose not to export because they are uncertain about their ability to export enough to foreign markets to recover these large costs. PTAs facilitate the participation of these firms in international markets by lowering entry thresholds, including importantly by reducing uncertainty about market access through the various non-tariff provisions that PTAs include.
The expansion of extensive margins is particularly important to a country's economic welfare. If a country, particularly a large one, intensively exports more of each existing product, the prices of its product could be lowered in the world market, resulting in a negative terms-of-trade effect. In contrast, if it exports a broad spectrum of differentiated products at higher prices, though not so intensively for each product, it may achieve greater welfare gains. Thus, Romer (1994) argues that the welfare gains of tariff liberalization can be larger when the gains at the extensive margins of trade dominate as compared to the case when only trade in existing varieties is considered.
2.2 Empirical Evidence
Trade Creation and Trade Diversion
Much of the empirical work on the economic impact of trade agreements has been conducted using the gravity model of trade. Without embarking on complicated welfare calculations, this body of literature attempts to address a simple question: whether preferential trade agreements generate additional trade between partner countries by controlling for other factors that also affect trade flows such as size of economy, geographic proximity, similarities in cultures and languages, income growth and others. Gravity models tend to show large trade creation effects. For example, Jeffrey Bergstrand and Scott Baier, working with a dataset of 96 countries, show that on average, trade agreements double trade between partner countries after 10 years.
On the contrary, the trade diversion effects of trade agreements have been empirically shown to be less significant than expected. A recent assessment of trade creation and diversion effects of preferential trade agreements suggests that trade diversion may play a role for some agreements and for some sectors, but it does not emerge as a key effect (Freund and Ornelas, 2010). Studies focusing on the Canada-United States free trade agreement (CUSFTA) also fail to find significant trade diversion effects. Clausing (2001) finds that the CUSFTA increased U.S. imports from Canada, but did not divert U.S. importing from other U.S. trading partners. The CUSFTA study by Trefler (2004) also concurs that the trade diversion effect under CUSFTA was negligible.
Extensive Margin Impacts
Many of the ex post trade agreement assessments focus only on the intensive margin, ignoring the effects of the increased number of traded products or firms in the affected economies. However, a growing body of literature argues that expansion in extensive margins is more important than expansion in intensive margins for welfare improvement. For instance, Kehoe and Kim (2009) find significant evidence of expansion in extensive margins following a decrease in trade barriers in the wake of major trade agreements. The set of previously least-traded products which accounted for only 10 percent of trade before trade liberalization grew to account for 30 percent of trade or more following the liberalization.
Non-tariff effects
A shortcoming in many ex ante trade agreement assessments conducted using simulation models is that they are restricted to assessing the impact of the eliminations of tariffs only. This approach captures the effect of the agreements to a certain extent, but likely underestimates the potential gains from liberalization for the following reasons (Ciuriak, 2007):
- Today's "new age" FTAs often go beyond the traditional FTA approach to include services, investment, customs co-operation, facilitation, and other areas of cooperation. Assessment that focuses on the price effect from tariff reductions does not fully capture the broader implications of the economic cooperation agreement. This is particularly true in the era of the growing importance of investment and rising trade in intermediate goods and services, measures to facilitate investment and liberalize services trade in an economic partnership agreement are expected to have a significant effect on two-way trade in goods over and beyond the effect induced by lower tariffs.
- An FTA provides greater certainty about market access in partner countries. In the presence of sunk costs, greater certainty leads to a reduction of perceived business risk, and will increase the expected returns on the commercial presence established in the partner country.
- The conclusion of an agreement acts like a "wake-up" call to the private sector, drawing attention to the new business possibilities offered by the agreement (these are sometimes referred to as "announcement" or "animal spirits" effects).
Related to these arguments, Baldwin (2012) describes the deeper commitments under modern PTAs as filling the "supply chain governance gap"; these commitments restrict backsliding on contractual commitments and thus address the "hold-up" problem in international sourcing. These commitments expand trade not necessarily by reducing tariffs but by reducing uncertainty. Footnote 4
Empirical literature based on the "new new trade theory" is still evolving. Most of this body of literature focus on producers' productivity gains stemming from the reallocation of resources from less-efficient firms to more-efficient firms within the same industry in freer trade (Melitz and Trefler 2012), rather than providing a comprehensive picture of overall welfare gains. In this regard, a recent contribution by Arkolakis, Costinot, and Rodriguez-Clare (2012) shows that for a wide class of quantitative trade models, including models developed in the spirit of both "new trade theory" and "new new trade theory", the welfare gains from trade can be calculated using just two important variables: (i) share of expenditure on domestic goods; and (ii) elasticity of imports with respect to variable trade costs or "trade elasticity". This approach significantly simplifies welfare calculations on the effects of trade agreements, as it reflects the "all-in" effects of the agreements, both tariff and non-tariff.
Taking into account the theoretical and empirical developments in the assessment literature summarized above, the assessment of the CCFTA will focus on the following three issues:
- the extent to which the CCFTA increased bilateral trade between Canada and Chile;
- extensive and intensive margin effects of the CCFTA, and
- the overall welfare gains of the CCFTA.
3. Economic Conditions since the Implementation of the CCFTA
3.1 The Macroeconomic Environment
Canada is the tenth largest economy in the world measured in terms of gross domestic product (GDP) in US dollars, and is one of the wealthiest economies with a per capita GDP of C$49,907 (US$50,435) in 2011. From 1997 to 2011, the Canadian economy showed steady growth expanding at an annual rate of 3.5 percent Footnote 5
Canada is a trading nation receptive to foreign goods, services, and ideas. International trade accounted for 62.5 percent of GDP in 2011. Canada has relatively low barriers to cross-border flows of goods, services and capital. Natural-resource commodities, automobiles, and high-tech equipment represent the bulk of Canadian merchandise exports. Exports of resource-related products have been particularly strong in recent years benefiting from high demand from emerging markets and soaring commodity prices. The U.S. is Canada's major trading partner: 73.7 percent of Canadian merchandise exports were shipped to that country in 2011.
The Canadian dollar has appreciated steeply relative to the US dollar since 2003 and has remained near par with the US dollar since 2007 Footnote 6. This appreciation had a significant effect on the structure of Canada's economy and the performance of firms engaged in trade (Baldwin and Yan, 2010).
Table 1: Key Economic Indicators for Canada, 1996 and 2011
| 1996 | 2011 | Annual Growth (%) | |
|---|---|---|---|
| Population (Million) | 29.6 | 34.4 | 1.0 |
| GDP (Current Price, Billion US$) | 613.8 | 1,736.9 | 7.2 |
| GDP per Capita (Current Prices, US$) | 20,756.8 | 50,435.5 | 6.1 |
| Inflation [CPI] (Annual % change) | 1.6 | 2.9 | N/A |
| Current Account Balance (Billion US$) | 3.4 | -48.8 | N/A |
| Current Account Balance (% of GDP) | 0.6 | -2.8 | N/A |
Source: IMF World Economic Outlook Online Database April 2012
Figure 2: Canada and Chile Nominal GDP, 1990-2011, US$ Billion

Figure 2 Text Alternative
| Year | Canada GDP | Chile GDP |
|---|---|---|
| 1990 | 582.7 | 32.8 |
| 1991 | 598.2 | 37.8 |
| 1992 | 579.5 | 46.2 |
| 1993 | 563.7 | 49.5 |
| 1994 | 564.5 | 57.3 |
| 1995 | 590.5 | 74.1 |
| 1996 | 613.8 | 78.7 |
| 1997 | 637.5 | 85.9 |
| 1998 | 616.8 | 82.6 |
| 1999 | 661.3 | 75.4 |
| 2000 | 724.9 | 78.7 |
| 2001 | 715.4 | 71.3 |
| 2002 | 734.7 | 70.0 |
| 2003 | 865.9 | 76.1 |
| 2004 | 992.2 | 99.4 |
| 2005 | 1133.8 | 123.1 |
| 2006 | 1278.6 | 154.7 |
| 2007 | 1424.1 | 172.9 |
| 2008 | 1502.7 | 179.4 |
| 2009 | 1337.6 | 172.7 |
| 2010 | 1577.0 | 216.1 |
| 2011 | 1736.9 | 248.4 |
Source: IMF World Economic Outlook Online Database April 2012
Chile is the sixth largest economy in Latin America with a GDP of US$248.4 billion in 2011, which was approximately 14 percent of Canada’s GDP for that year. Over the past decade, Chile experienced impressive economic growth as a result of pro-market economic policies and strong export growth benefiting from increased demand for natural resources and high commodity prices. Its real GDP grew by 3.9 percent annually from 1997 to 2011. Per capita GDP surged strongly from US$5,663 to US$14,403 over this 15-year period. In real growth, Chile outperformed other major Latin American economies including Brazil, Mexico and Argentina. Chile experienced an economic downturn in the late 1990s, brought on by the unfavourable global economic conditions spawned by the Asian financial crisis in 1997. The economy remained sluggish until 2003, and it shifted into high gear and started to grow at an annual rate of more than eight percent since then.
Chile is widely recognized for its liberal and transparent trade and investment regime. Since 1999, it has unilaterally reduced its tariff by one percent annually. By January 1, 2003, the applied tariff was lowered to six percent. Chile's active promotion of free trade agreements during the last decade has boosted its trade performance significantly. Its merchandise trade with the world quadrupled from US$34.8 billion in 1996 to US$156.3 billion in 2011. Consequently, the relative importance of trade in Chile's GDP increased from 44.2 percent in 1996 to 62.9 percent in 2011. Unlike Canada, Chile boasts a diverse range of trading partners across the western hemisphere, Europe, and Asia.
Chile’s currency depreciated steeply, along with other developing economy currencies in the post-Asian crisis period before stabilizing around 2002. Footnote 7
Table 2: Key Economic Indicators for Chile, 1996 and 2011
| 1996 | 2011 | Annual Growth (%) | |
|---|---|---|---|
| Population (Million) | 14.4 | 17.4 | 1.3 |
| GDP (Current Price, Billion US$) | 78.7 | 248.4 | 8.0 |
| GDP per Capita (Current Prices, US$) | 5,454.8 | 14,277.7 | 6.6 |
| Inflation [CPI] (Annual % change) | 7.4 | 3.3 | N/A |
| Current Account Balance (Billion US$) | -3.1 | -3.2 | N/A |
| Current Account Balance (% of GDP) | -3.9 | -1.3 | N/A |
Source: IMF World Economic Outlook Online Database April 2012
As a result of the divergent movements of their respective currencies in the 1997-2002 period, Canada experienced a steep appreciation against the Chilean peso in nominal terms. Subsequently, the two currencies have moved more or less in line with each other in nominal terms.
Figure 3: Canada/Chile Exchange Rate, 1990-2011

Figure 3 Text Alternative
| Year | Exchange rate |
|---|---|
| 1996 | 1.00 |
| 1997 | 1.00 |
| 1998 | 1.03 |
| 1999 | 1.13 |
| 2000 | 1.20 |
| 2001 | 1.36 |
| 2002 | 1.45 |
| 2003 | 1.63 |
| 2004 | 1.55 |
| 2005 | 1.53 |
| 2006 | 1.55 |
| 2007 | 1.61 |
| 2008 | 1.62 |
| 2009 | 1.62 |
| 2010 | 1.64 |
| 2011 | 1.62 |
3.2 Trade Policy Developments since the CCFTA
Since the signings of the NAFTA and CCFTA, Canada has been working to further improve its economic and commercial performance by securing competitive terms of access to foreign markets, and increasing foreign direct investment in Canada as well as Canadian direct investment around the world. Since 1997, when both the FTAs with Chile and Israel came into force, Canada has implemented five new free trade agreements with: Costa Rica, Peru, the European Free Trade Association (EFTA) (Iceland, Liechtenstein, Norway and Switzerland), Colombia, and Jordan. With a total of eight preferential trade agreements currently in force, Canada's trade with its preferential trading partners covers 87.6 percent of its total merchandise trade. In addition, Canada continues to pursue an ambitious agenda of free-trade negotiations, both within and outside the hemisphere. In all, 12 negotiations are active including those with the European Union, India, Japan, Korea, as well as the Trans-Pacific Partnership Agreement (TPP).
Since signing its FTA with Canada in 1997, Chile has significantly expanded free trade negotiations with other countries. Bilateral and regional free trade agreements with the following countries and regions have been signed since 1997: Mexico, Central America (Costa Rica, El Salvador, Guatemala, Honduras and Nicaragua)Footnote 8, the European Community (an Economic Partnership Agreement), the Republic of Korea, the European Free Trade Association (EFTA) (Iceland, Liechtenstein Norway and Switzerland), the U.S., China, India, Panama, Peru, Colombia, Australia, Japan and Türkiye, as well as with New Zealand, Singapore and Brunei Darussalam (TPP) (Trans-Pacific Strategic Economic Partnership Agreement). Chile also has Economic Complementarity Agreements (ECAs) under the Latin American Integration Association (LAIA) with Bolivia, Ecuador Footnote 9, Venezuela and MERCOSUR (Argentina, Brazil, Paraguay and Uruguay), as well as a partial-scope agreement with Cuba.
With a total of 22 current agreements in force, Chile has one of the largest numbers of agreements and preferential partners in the world. As a result, the proportion of Chile's trade with its preferential partners covers more than 90 percent of its total merchandise trade. Owing to the wide coverage of Chile's trade agreements with its trading partners; Canadian exporters essentially do not have extra preferences in the Chilean market. The CCFTA might have provided the Canadian exporters temporary advantages in the earlier days of the implementation of the agreement, but such advantages were quickly offset by subsequent trade agreements signed by Chile with other trading partners.
Table 3: List of Bilateral/Regional Trade Agreements in Force in Canada and Chile
| Canada | Year |
|---|---|
| North American Free Trade Agreement (NAFTA) | 1994 |
| Canada-Chile (CCFTA) | 1997 |
| Canada-Israel | 1997 |
| Canada-Costa Rica | 2002 |
| Canada-Peru | 2009 |
| EFTA-Canada | 2009 |
| Canada-Colombia | 2011 |
| Jordan | 2012 |
| Chile | Year |
|---|---|
| Protocol on Trade Negotiation (PTN) | 1973 |
| Latin American Integration Association (LAIA) | 1981 |
| Global System of Trade Preferences among Developing Countries (GSTP) | 1989 |
| Canada-Chile | 1997 |
| Chile-Mexico | 1999 |
| Chile-Costa Rica (Central America) | 2002 |
| Chile-El Salvador (Central America) | 2002 |
| EU-Chile | 2003 |
| EFTA-Chile | 2004 |
| Korea, Republic of-Chile | 2004 |
| U.S.-Chile | 2004 |
| Chile-China | 2006 |
| Trans-Pacific Strategic Economic Partnership | 2006 |
| Chile-India | 2007 |
| Chile-Japan | 2007 |
| Chile-Honduras (Central America) | 2008 |
| Panama-Chile | 2008 |
| Australia-Chile | 2009 |
| Chile-Colombia | 2009 |
| Peru-Chile | 2009 |
| Chile-Guatemala (Central America) | 2010 |
| Türkiye-Chile | 2011 |
Source: World Trade Organization
4. Did the CCFTA Increase Bilateral Trade between Canada and Chile?
4.1 Interpreting Bilateral Trade Flows
If a free trade agreement is working as intended, it should be encouraging greater trade between the two countries involved. This should be the first and most fundamental question to be addressed before embarking on any welfare analysis of trade agreements. However, direct comparison of trade performance before and after an FTA does not constitute a meaningful comparison, as most countries in the world today are all experiencing positive trade growth except during periods of economic recession. To determine whether an FTA is trade-enhancing, one needs to show whether it generates more trade than would have been the case without the agreement.
One way to establish this counter-factual scenario is to consider trade with countries without preferential arrangements over the same period. Countries chosen for such a comparison should share similar economic characteristic as the FTA partner country in terms of sizes of GDP and income levels, geographic locations, and other national economic characteristics.
Figure 4 and Table 4 below enable comparisons of the value of trade growth between Canada and Chile, and between Canada and other leading South American countries with which Canada did not have FTAs. Since the implementation of the CCFTA in 1997, the value of Canadian merchandise exports to Chile more than doubled, increasing from $392 million in 1997 to $819 million in 2011. Over the past 15 years, Canadian merchandise exports to Chile expanded at a rate of 5.4 percent per year, outperforming exports to other major South American countries, such as Argentina and Brazil, with which Canada did not have preferential trade arrangements. Over the same period, Canadian merchandise exports to the whole Latin American region grew by only 1.7 percent. As a result of this exceptional growth, Chile emerged as the third-most important destination for Canadian merchandise exports in the Latin American region after Mexico and Brazil in 2011; whereas in 1997, Chile ranked as only the seventh-most important destination for Canadian merchandise exports to the region.
Figure 4: Value of Canada's Merchandise Trade with Chile, $ Million
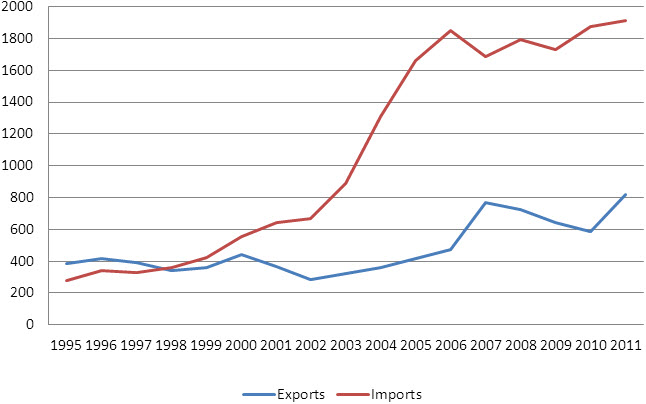
Figure 4 Text Alternative
| Year | 1995 | 1996 | 1997 | 1998 | 1999 | 2000 | 2001 | 2002 | 2003 | 2004 | 2005 | 2006 | 2007 | 2008 | 2009 | 2010 | 2011 |
|---|---|---|---|---|---|---|---|---|---|---|---|---|---|---|---|---|---|
| Exports | 387.5 | 415.5 | 392.4 | 339.0 | 360.4 | 444.4 | 369.1 | 282.7 | 324.0 | 359.6 | 417.3 | 473.0 | 768.7 | 724.0 | 644.4 | 587.5 | 818.8 |
| Imports | 278.9 | 342.2 | 325.9 | 360.1 | 421.6 | 555.3 | 640.7 | 670.5 | 886.3 | 1308.5 | 1663.1 | 1853.2 | 1686.4 | 1794.1 | 1730.8 | 1872.3 | 1910.7 |
Source: Statistics Canada
Table 4: Value of Canada's Trade with Major Latin American Countries 1997-2011, $ Million
| Exports | Imports | |||||
|---|---|---|---|---|---|---|
| 1997 | 2011 | Growth (%) | 1997 | 2011 | Growth (%) | |
| Argentina | 409 | 495 | 1.4 | 233 | 2,359 | 18.0 |
| Brazil | 1,693 | 2,841 | 3.8 | 1,320 | 3,880 | 8.0 |
| Chile | 392 | 819 | 5.4 | 326 | 1,911 | 13.5 |
| Colombia | 473 | 761 | 3.5 | 314 | 800 | 6.9 |
| Peru | 312 | 516 | 3.7 | 135 | 4,403 | 28.3 |
| Venezuela | 953 | 607 | -3.2 | 972 | 739 | -1.9 |
| Mexico | 1,277 | 5,476 | 11.0 | 7,022 | 24,573 | 9.4 |
| Latin America & the Caribbean | 6,790 | 8,635 | 1.7 | 12,060 | 18,525 | 3.1 |
| World | 298,069 | 447,501 | 2.9 | 272,946 | 445,992 | 3.6 |
Note: Growth rate is compound annual growth rate.
Source: Statistics Canada
Growth of Canadian merchandise imports from Chile since CCFTA implementation was even more impressive. The value of total Canadian merchandise imports from Chile grew six fold to reach $1.9 billion in 2011 from only $326 million in 1997. This is equivalent to annual growth of 13.5 percent, compared to the annual average growth rate of 3.1 percent for the whole Latin American region over the same period. Only Peru and Argentina surpassed Chile's performance under this measure. However, in the case of Peru and Argentina, the surge in Canadian imports was almost exclusively driven by one particular product category - precious metals. The highly skewed nature of Canada's imports from these countries highlights the need for more advanced econometric techniques to control for country-specific and sector-specific factors, and to better isolate the effect of the trade agreement.
Another approach to detecting the actual influence of the CCFTA is to compare trade flows between the sectors that are substantially liberalized and the sectors that are less liberalized (mostly because levels of protections in those sectors were not significant prior to the agreement). If trade flows are sensitive to tariff cuts, then trade flows in the sectors that experience substantial tariff reductions should grow faster than trade flows in sectors with modest tariff reductions. This is exactly what is depicted in Figures 5 and 6< below which show the growth of Canadian imports from Chile and Canadian exports to Chile by the extent of tariff reductions. In these two figures, bilateral trade between Canada and Chile is divided into several categories according to the extent of tariff reductions. The first category is for the products that were duty free prior to the implementation of the CCFTA. The second category is for the products that were not liberalized and experienced no tariff changes. The third, fourth and fifth categories are for the products that had tariff reductions of 0.1 percentage points to 5 percentage points, 5.1 percentage points to 10 percentage points and 10.1 percentage points or more, respectively.
Figure 5 shows that the value of Canadian merchandise imports from Chile in the substantially liberalized sectors grew considerably faster than the modestly liberalized sectors between 1996 and 2011. The value of imports in the sectors that had tariff cuts of more than 10 percentage points grew by 1,190 percent, as compared to only 224 percent for the sectors with tariff reductions of 5.1 to 10 percentage points. The value of imports from sectors with less than five percentage points tariff reduction decreased by 36 percent during the same period. Not surprisingly, the value of Canadian merchandise imports from Chile in the sectors that were duty-free prior to liberalization also registered strong growth (750 percent) over the same period.
Figure 5: Growth in Value of Canada's Imports from Chile by CCFTA Tariff Reductions (%), 1996-2011
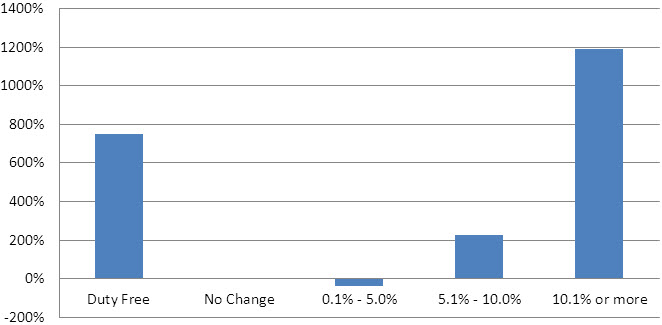
Figure 5 Text Alternative
| T-cat | Growth | 1996 | 2011 |
|---|---|---|---|
| Duty Free | 750% | 218,507,698 | 1,857,407,423 |
| No Change | 0% | 0 | 0 |
| 0.1% - 5.0% | -36% | 13,783,820 | 8,788,495 |
| 5.1% - 10.0% | 224% | 17,438,054 | 56,582,545 |
| 10.1% or more | 1190% | 958,994 | 12,369,623 |
Source: COMTRADE database, World Integrated Trade Solutions and author's own calculations
A similar pattern but in a less significant order of magnitude can be seen in the value of Chile's imports from Canada. Between 1996 and 2011, the value of Chilean imports from Canada in the sectors that had tariff reductions of more than 10 percentage points grew by 189 percent. In contrast, there was essentially no growth in value of imports in the sectors with tariff reductions of less than 10 percentage points. As in the case with Canada's imports from Chile, the value of Chilean imports from Canada in the sectors that were already duty-free prior to liberalization also registered strong growth (more than 500 percent; see Figure 6).
Figure 6: Growth in Value of Canada's Exports to Chile by CCFTA Tariff Reductions (%), 1996-2011

Figure 6 Text Alternative
| T-cat | growth | 1996 | 2011 |
|---|---|---|---|
| Duty Free | 536% | 12,549,621 | 79,772,219 |
| No Change | 0% | 0 | 0 |
| 0.1% - 5.0% | 0% | 0 | 0 |
| 5.1% - 10.0% | -9% | 98,732,611 | 89,971,494 |
| 10.1% or more | 189% | 166,146,274 | 480,211,522 |
Source: COMTRADE Database, World Integrated Trade Solutions and author's own calculations
The data comparison to detect the effect of the CCFTA could take a step further by comparing the changes in bilateral trade flows between Canada and Chile with trade between Canada, or Chile, and other non-FTA partner countries by the extent of tariff reductions under the CCFTA. If trade flows are sensitive to tariff cuts, the comparison should show that the value of trade in the sectors that experienced substantial tariff reductions grew not only faster than in the sectors with modest tariff reductions, but also faster than trade with other non-FTA partner Latin American countries in the same sectors.
Table 5 reports the growth in the value of Canadian imports by the extent of tariff reductions under the CCFTA across major Latin American countries. In the "duty free" category, the sectors that were "free" prior to the implementation of the CCFTA, it is no surprise to see that the value of Canadian imports from all Latin American countries including Chile grew between 1996 and 2011. In the sectors with "no changes in tariffs", no growth in the value of imports was detected either from Chile or from Mexico – the two countries with which Canada had FTAs more than a decade ago. No clear trends emerge in the categories with moderate tariff reductions (from 0.1 to 10 percentage points). The value of Canadian imports from Chile for the products with tariff reductions of 5.1 to 10 percentage points grew by 224.5 percent between 1996 and 2011, while over the same period, the value of Canadian imports for the same category of products from Argentina – a country without an FTA with Canada grew 759.0 percent. However, in the category of products with substantial tariff reductions (more than 10 percentage points), the value of Canadian imports from Chile grew by 1189.9 percent, well exceeding the value for other Latin American countries.
Table 5: Growth in Value of Canada's Trade with Latin America by CCFTA Tariff Reductions, (%), 1996-2011
| Category of Tariff Reductions under the CCFTA | Country | Growth in Imports |
|---|---|---|
| Duty Free | Chile | 748.9 |
| Argentina | 3,567.8 | |
| Brazil | 438.1 | |
| Colombia | 235.4 | |
| Mexico | 431.8 | |
| Peru | 6,972.3 | |
| Venezuela | 733.5 | |
| No Tariff Changes | Chile | 0.0 |
| Argentina | 94.0 | |
| Brazil | -21.2 | |
| Colombia | 388.5 | |
| Mexico | 0.0 | |
| Peru | 0.0 | |
| Venezuela | -98.2 | |
| 0.1 – percentage points | Chile | -36.2 |
| Argentina | 324.4 | |
| Brazil | 265.3 | |
| Colombia | 511.2 | |
| Mexico | 491.1 | |
| Peru | 46.5 | |
| Venezuela | -36.6 | |
| 5.1 – 10 percentage points | Chile | 224.5 |
| Argentina | 759.0 | |
| Brazil | 489.3 | |
| Colombia | 115.4 | |
| Mexico | 536.1 | |
| Peru | 937.8 | |
| Venezuela | 208.4 | |
| 10.1 percentage points or more | Chile | 1,189.9 |
| Argentina | 231.7 | |
| Brazil | 474.9 | |
| Colombia | 6.6 | |
| Mexico | 328.1 | |
| Peru | 496.8 | |
| Venezuela | -95.3 |
Note: Due to missing tariff data 1996-1999, growths in Canadian exports to Colombia are calculated using 2000 as base year.
Source: COMTRADE database, World Integrated Trade Solutions and author's own calculation
A similar trend can be seen in Canada's exports to Chile or Chile's imports from Canada when compared to the countries with which Chile did not have FTAs. However, choices for reference countries are constrained because of Chile's wide range of FTA partners. The only countries relevant to this context and sharing similar economic characteristics as Canada are the U.S. and Australia before they signed their FTAs with Chile in 2003 and 2009 respectively. Table 6 presents growth in the value of Chile's imports from Canada and Australia between 1996 and 2008 and from Canada and the U.S. between 1996 and 2003 by the extent of tariff reductions under the CCFTA.
Chile's economy experienced a significant downturn in the late 1990s and early 2000s, brought on by the Asian financial crisis starting in 1997, and remained sluggish until 2003. The value of Chile's imports from the world declined sharply between 1996 and 2003. During this period, the values of its total merchandise imports from Canada were down by 18.5 percent and from the U.S. a hefty 32.7 percent. Across all five categories of products categorized by extent of tariff reductions under the CCFTA, four categories reported more significant declines in import values from the U.S. than from Canada. The products with tariff reductions of more than 10 percentage points experienced the most significant drops in the value of imports from the U.S., while over the same period the value of imports from Canada grew. The data pattern presented in Table 6 suggests strongly that the CCFTA helped mitigate Canada's export losses in the Chilean market during the economic downturn in Chile. In other words, without the CCFTA effect, Canada's export losses might have been similar to what the U.S. experienced in the Chilean market.
Comparison between Canada and Australia presents an entirely different picture. From 1996 to 2008, Chile had increased its imports from Australia in two of the categories of products while the value of imports from Canada only increased in the products with tariff reductions of more than 10 percentage points. However, this can be explained by the fact that even though Canada and Australia share many similar economic characteristics – for example, both are major exporters of commodities – the compositions of their exports are very different. Australia's exports to Chile were mainly concentrated in two categories of products: coal and coal products as well as bovine meat, while Canada's exports to Chile were more diversified ranging from coal, wheat, mineral products, and oil seeds to machinery and equipment. This makes a direct comparison difficult. For instance, in the category of products with tariff reductions of more than 10 percentage points, the value of Chile's imports from Canada increased by106.5 percent, but Australia did not export the same products as Canada in this category.
Table 6: Growth in Value of Chile's Imports from Canada, Australia and the U.S. by CCFTA Tariff Reductions, 1996-2003 and 1996-2008
| Categories of tariff Reductions under the CCFTA | Growth in Value of Chile Imports from Canada and Australia (%, 1996-2008) | Growth in Value of Chile Imports from Canada and U.S. (%, 1996-2003) | ||
|---|---|---|---|---|
| Duty Free | Canada | 0.0 | Canada | 0.0 |
| Australia | 6,413.5 | USA | -70.6 | |
| No Tariff Change | Canada | 0.0 | Canada | 0.0 |
| Australia | 0.0 | USA | -10.7 | |
| 0.1 – 5 percentage points | Canada | 0.0 | Canada | 0.0 |
| Australia | 102.7 | USA | -32.5 | |
| 5.1 – 10 percentage points | Canada | -41.9 | Canada | -89.7 |
| Australia | 0.00 | USA | 0.0 | |
| 10.1 percentage points or more | Canada | 106.5 | Canada | 6.6 |
| Australia | 0.0 | USA | -84.7 | |
Source: COMTRADE database, World Integrated Trade Solutions and author's own calculation
At the sector level, growth in the value of Canada's exports to Chile was concentrated in two categories of products: products with tariff reductions of more than 10 percentage points and products that already had duty free access to the Chilean market prior to implementation of the CCFTA. Between 1996 and 2011, the value of Canadian exports of duty free products to Chile grew four fold to reach $252 million in 2011 with a net increase of $198 million, while the value of exports of products with tariff reductions of more than 10 percentage points more than doubled with a net increase of $248.6 million. Sectors that had marked increase in export values were broad-based and included ores, machinery and equipment, mineral fuels and oils, iron and steel products, plastics, animal fats and vegetable oils, chemical products, pharmaceutical products, precision and medical equipment, and tools of base metal.
Table 7: Top 10 Increases in Value of Canadian Exports to Chile by Product Category and CCFTA Tariff Reductions, 1996 and 2011, $
| HS02 | Description | 1996 | 2011 | Change |
|---|---|---|---|---|
| 26 | Ores, slag and ash | 0 | 94,886,155 | 94,886,155 |
| 27 | Mineral fuels and oils | 56,935 | 26,656,963 | 26,600,029 |
| 84 | Nuclear reactors, boilers and machinery | 7,073,227 | 32,325,541 | 25,252,314 |
| 36 | Explosives | 0 | 15,010,131 | 15,010,131 |
| 30 | Pharmaceutical products | 793,498 | 9,228,287 | 8,434,789 |
| 15 | Animal fats and vegetable oils | 8,732 | 6,397,224 | 6,388,493 |
| 85 | Electrical machinery and equipment | 4,537,366 | 9,804,215 | 5,266,849 |
| 25 | Mineral salts | 9,068,006 | 12,003,874 | 2,935,868 |
| 40 | Rubber and articles | 2,023,126 | 4,650,802 | 2,627,676 |
| 73 | Articles of iron or steel | 5,556,817 | 7,224,204 | 1,667,387 |
| Total | 54,493,234 | 252,133,422 | 197,640,188 |
| HS02 | Description | 1996 | 2011 | Change |
|---|---|---|---|---|
| 15 | Animal fats and vegetable oils | 116,593 | 26,047,304 | 25,930,710 |
| 84 | Nuclear reactors, boilers and machinery | 386,536 | 3,253,269 | 2,866,734 |
| 87 | Vehicles | 403,669 | 1,944,716 | 1,541,047 |
| 04 | Dairy produce | 512,451 | 1,679,942 | 1,167,491 |
| 29 | Organic chemicals | 0 | 476,106 | 476,106 |
| 94 | Furniture and bedding | 147,224 | 590,585 | 443,361 |
| 19 | Preparations of cereal or flour | 40,948 | 224,677 | 183,729 |
| 03 | Fish | 0 | 137,012 | 137,012 |
| 27 | Mineral fuels and oils | 275,819 | 397,470 | 121,651 |
| 23 | Food residues and wastes | 63,862 | 176,296 | 112,433 |
| Total | 134,619,469 | 89,029,561 | -45,589,908 |
| HS02 | Description | 1996 | 2011 | Change |
|---|---|---|---|---|
| 84 | Nuclear reactors, boilers and machinery | 48,035,957 | 120,019,137 | 71,983,180 |
| 27 | Mineral fuels and oils | 24,382,101 | 85,321,944 | 60,939,843 |
| 72 | Iron and steel | 1,321,051 | 36,181,682 | 34,860,631 |
| 39 | Plastics and articles | 6,672,045 | 38,692,543 | 32,020,498 |
| 28 | Inorganic chemicals | 1,926,773 | 18,759,499 | 16,832,726 |
| 82 | Tools of base metal | 1,605,063 | 18,076,920 | 16,471,858 |
| 90 | Precision or medical instruments | 6,102,813 | 18,086,818 | 11,984,006 |
| 02 | Meat | 1,261,426 | 8,635,253 | 7,373,827 |
| 07 | Edible vegetables | 5,293,720 | 11,762,575 | 6,468,855 |
| 95 | Toys | 718,412 | 5,489,614 | 4,771,202 |
| Total | 226,536,329 | 475,184,074 | 248,647,746 |
Source: COMTRADE database, World Integrated Trade Solutions and author's own calculations
The value of Canada's imports from Chile grew most in the category of products that were already duty free prior to implementation of the CCFTA. The total value of imports of this category surged dramatically from $298.5 million in 1996 to $1.8 billion in 2011, largely because of increased imports of precious stones and metals, copper and edible fruits. Precious stones and metals accounted for roughly 50 percent of total values of Canadian duty free imports from Chile. If precious stones and metals are excluded, the value of duty free imports from Chile still amounted to $969.6 million, more than triple the level for 1996.
The value of Canada's imports from Chile for the products with tariff reductions of 5.1 to 10 percentage points more than doubled between 1996 and 2011, but that of products with tariff reductions of more than 10 percentage points grew more than nine fold over the 1996 level, largely due to the increased imports of edible fruits and nuts.
Table 8: Top 10 Increases in Value of Canadian Imports from Chile by Product Category and CCFTA Tariff Reductions, 1996 and 2011, $
| HS02 | Description | 1996 | 2011 | Change |
|---|---|---|---|---|
| 71 | Precious stones and metals | 301,049 | 869,192,476 | 868,891,428 |
| 08 | Edible fruits and nuts | 121,076,507 | 311,995,276 | 190,918,768 |
| 74 | Copper and articles | 847,596 | 142,676,493 | 141,828,896 |
| 03 | Fish | 10,291,362 | 101,537,004 | 91,245,642 |
| 22 | Beverages | 22,434,424 | 92,387,952 | 69,953,529 |
| 44 | Wood | 2,057,975 | 63,705,296 | 61,647,321 |
| 12 | Oil seeds | 449,922 | 25,238,467 | 24,788,545 |
| 28 | Inorganic chemicals | 7,232,102 | 31,443,245 | 24,211,144 |
| 29 | Organic chemicals | 101,925 | 20,986,207 | 20,884,282 |
| 02 | Meat | 0 | 15,471,557 | 15,471,557 |
| Total | 298,482,144 | 1,838,831,316 | 1,540,349,172 |
| HS02 | Description | 1996 | 2011 | Change |
|---|---|---|---|---|
| 39 | Plastics and articles | 10,808 | 1,005,380 | 994,572 |
| 20 | Preparations of vegetables | 25,295 | 129,225 | 103,930 |
| 82 | Tools of base metal | 0 | 20,514 | 20,514 |
| 19 | Preparations of cereal or flour | 1,447 | 6,108 | 4,662 |
| 62 | Articles of non-knitted apparel | 0 | 1,988 | 1,988 |
| 61 | Articles of knitted apparel | 0 | 189 | 189 |
| 42 | Articles of leather | 0 | 109 | 109 |
| 91 | Clocks and watches | 0 | 5 | 5 |
| 30 | Pharmaceutical products | 0 | 4 | 4 |
| Total | 18,793,897 | 8,696,486 | -10,097,411 |
| HS02 | Description | 1996 | 2011 | Change |
|---|---|---|---|---|
| 08 | Edible fruits and nuts | 2,608,773 | 24,507,549 | 21,898,777 |
| 20 | Preparations of vegetables | 19,467,247 | 30,686,072 | 11,218,826 |
| 06 | Live trees and plants | 21,551 | 140,005 | 118,454 |
| 52 | Cotton | 0 | 5,198 | 5,198 |
| 60 | Knitted fabric | 0 | 4,207 | 4,207 |
| 62 | Articles of non-knitted apparel | 0 | 2,256 | 2,256 |
| 15 | Animal fats and vegetable oils | 0 | 2,219 | 2,219 |
| 64 | Footwear | 0 | 259 | 259 |
| 19 | Preparations of cereal or flour | 0 | 216 | 216 |
| Total | 23,776,355 | 55,990,169 | 32,213,814 |
| HS02 | Description | 1996 | 2011 | Change |
|---|---|---|---|---|
| 08 | Edible fruits and nuts | 255,909 | 10,789,204 | 10,533,295 |
| 07 | Edible vegetables | 24,079 | 1,125,723 | 1,101,644 |
| 15 | Animal fats and vegetable oils | 0 | 160,759 | 160,759 |
| 56 | Wadding and felt | 0 | 6,456 | 6,456 |
| 58 | Special woven fabrics | 0 | 5,609 | 5,609 |
| 63 | Other textile articles | 0 | 2,576 | 2,576 |
| 55 | Man-made fibres | 56,899 | 58,063 | 1,164 |
| 52 | Cotton | 0 | 1,319 | 1,319 |
| 11 | Mill products | 0 | 662 | 662 |
| Total | 1,307,565 | 12,240,122 | 10,932,558 |
Source: COMTRADE database, World Integrated Trade Solutions and author's own calculations.
In summary, the data analysis presented above demonstrates that tariff reductions under the CCFTA did have a strong enhancing effect on bilateral trade between Canada and Chile. The effect was more pronounced for trade flows from Chile to Canada than for trade flows from Canada to Chile. Nevertheless, for both directions of trade, most growth took place in two categories of products: those that were duty free prior to the implementation of the CCFTA and those that experienced tariff reductions of more than 10 percentage points. There was little growth in trade values in non-liberalized category, potentially because protections in these sectors remain prohibitive. The strong growth in the values of Canadian imports from Chile was clouded by the rising trade in gold between the two countries amid the rising demand and soaring prices; both of which had little to do with the trade agreement. However, the trade-enhancing effect of the agreement was still prominent even if the imports of precious stones and metals are excluded from the growth calculation. To better isolate the CCFTA effect, more sophisticated econometric techniques will be employed below to control for country-specific and sector-specific factors.
4.2 Preference Creation and Erosion under the CCFTA
The previous section demonstrates that the CCFTA had a positive trade-enhancing effect on the bilateral trade between Canada and Chile by providing simple data comparisons without using the sophisticated econometric analysis to control for other factors that also influence trade flows. Nevertheless, as it is demonstrated below, erosion of Canadian preferences in Chile did occur when Chile's agreements with third parties were subsequently implemented.
From Chile's perspective, since the implementation of the CCFTA in 1997, Chile's preference gains in the Canadian market have been noticeably evident. Since 1997 Canada has not signed any significant trade agreements with other major Central and South American countries, which gave Chile an opportunity to hold on its preferences in the Canadian market. Chile's share in Canada's total merchandise imports from the world increased steadily from 0.12 percent in 1997 to 0.43 percent in 2011. If the increase in Canadian imports from Chile is put in a context of Canada's total imports from Central and South American countries, Chile's advantages look even more pronounced. Chile's share in total Canadian merchandise imports from Central and South America (excluding Mexico) increased from seven percent in 1997 to 15.7 percent in 2004 before it slipped to 10.8 percent in 2011 (see Figure 7).Footnote 10
Figure 7: Chile's Share of Canada's Total Imports (%)
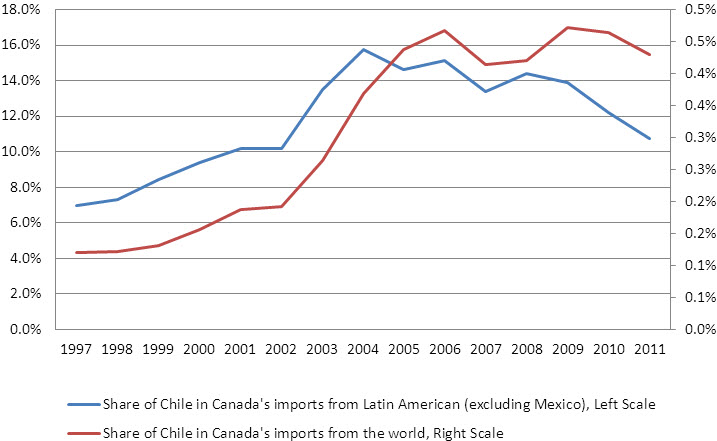
Figure 7 Text Alternative
| Year | 1997 | 1998 | 1999 | 2000 | 2001 | 2002 | 2003 | 2004 | 2005 | 2006 | 2007 | 2008 | 2009 | 2010 | 2011 |
|---|---|---|---|---|---|---|---|---|---|---|---|---|---|---|---|
| Share of Chile in Canada's imports from Latin American (excluding Mexico), Left Scale | 7.00% | 7.30% | 8.50% | 9.40% | 10.20% | 10.20% | 13.50% | 15.70% | 14.60% | 15.10% | 13.40% | 14.40% | 13.90% | 12.20% | 10.80% |
| Share of Chile in Canada's imports from the world, Right Scale | 0.10% | 0.10% | 0.10% | 0.20% | 0.20% | 0.20% | 0.30% | 0.40% | 0.40% | 0.50% | 0.40% | 0.40% | 0.50% | 0.50% | 0.40% |
Source: Statistics Canada and author's own calculations
From Canada's perspective, between 1997 and the early 2000s in the absence of preferential trade agreements between Chile and other trading partners, Canada saw its market share in Chile's total imports from the world increase from 2.4 percent in 1997 to 3.2 percent in 2000. However, as subsequent free trade agreements between Chile and other trading partners came into effect - in particular, Chile's FTA with the European Union in 2003, with the U.S. and Korea in 2004, and with China in 2006 - Canada's preferential advantages waned. By 2011, Canada's share of Chile's total imports from the world came down to only 1.6 percent (see Figure 8).
Figure 8: Canada's Shares of Chile's Total Imports (%)

Figure 8 Text Alternative
| Year | 1997 | 1998 | 1999 | 2000 | 2001 | 2002 | 2003 | 2004 | 2005 | 2006 | 2007 | 2008 | 2009 | 2010 | 2011 |
|---|---|---|---|---|---|---|---|---|---|---|---|---|---|---|---|
| Share of Canada in Chile's imports from the world | 2.4% | 2.9% | 2.8% | 3.0% | 2.6% | 2.0% | 2.0% | 1.6% | 1.4% | 1.4% | 2.3% | 1.7% | 1.9% | 1.3% | 1.3% |
| Share of Canada in Chile's imports from the world (excluding China) | 2.4% | 3.0% | 3.0% | 3.2% | 2.8% | 2.2% | 2.1% | 1.7% | 1.5% | 1.5% | 2.6% | 1.9% | 2.2% | 1.6% | 1.6% |
Source: Statistics Canada and author's own calculations
The erosion of Canada's CCFTA preferences in the Chilean market could be best illustrated by comparing the common products (under the same Harmonized Tariff Schedule codes, HS) imported by Chile from both Canada and the U.S. over the examined period. Figure 9 shows the shares of common products from Canada and the U.S. in Chile's total imports from 1995 to 2011. As can be seen, Canada's shares rose from 1996 onward until around 2000, while the shares of U.S. products moved in an opposite direction. The declines in the market shares for both countries from 2000 onward to 2003 mostly reflected the macroeconomic influences rather than actual preference changes as they moved in synch. However, when the U.S.-Chile FTA came into effect in 2004, the preferential advantages switched to the U.S. The U.S. recouped all of the losses from earlier years to reach a record high of 32 percent of Chile's total imports in 2011, while Canada's shares for the same products came down from the peak of three percent in 2000 to around two percent in 2011. The sharp spike observed in Canada's share of these common products in Chilean imports in 2007-8 was caused by a temporary surge in Chile's imports in machinery, base metals and chemicals. Afterwards, Canada's share deteriorated significantly relative to the U.S.
Figure 9: Total Imports of All Common Goods to Chile from Canada and the U.S. (%)
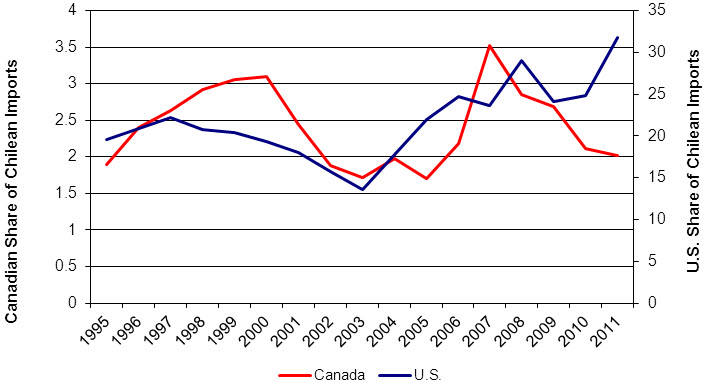
Figure 9 Text Alternative
| year | Canada | U.S. |
|---|---|---|
| 1995 | 1.895034 | 19.60757 |
| 1996 | 2.397521 | 20.94147 |
| 1997 | 2.626436 | 22.2313 |
| 1998 | 2.912868 | 20.74174 |
| 1999 | 3.061808 | 20.383 |
| 2000 | 3.098691 | 19.2728 |
| 2001 | 2.440423 | 17.97795 |
| 2002 | 1.879174 | 15.75937 |
| 2003 | 1.722253 | 13.62353 |
| 2004 | 1.979496 | 17.71987 |
| 2005 | 1.708519 | 21.92372 |
| 2006 | 2.183837 | 24.66438 |
| 2007 | 3.52262 | 23.67945 |
| 2008 | 2.851134 | 29.07246 |
| 2009 | 2.691363 | 24.14837 |
| 2010 | 2.116751 | 24.85091 |
| 2011 | 2.022800567 | 31.751853476 |
Source: COMTRADE database, World Integrated Trade Solutions and author's own calculations
A similar but more distinct pattern can be seen by removing the common duty free products from Figure 9 leaving only the common liberalized products under both trade agreements. This is because an increase in imports of duty free products might not be considered as the direct result of tariff reductions. When the duty free goods are removed from the figure, it can be seen most obviously that the temporary spike in imports from Canada in 2007 was removed, leaving a clearer pattern than Figure 8. If a ratio of 1 to 10 is used as a gauge stick (as Canada's economy is about one-tenth the size of the U.S. economy), one can see that for the common liberalized products under the CCFTA and before 2003, Canada's shares in Chile's total imports were well above the one-tenth mark; indicative of improved market access at the expense of the same U.S. products. The turning point was 2004 when Chile's imports from the U.S. surged significantly following the onset of the U.S.-Chile FTA. Since then, the U.S. recouped all of the losses of previous years relative to Canada; while Canada's relative advantages in the Chilean market started to diminish and returned to the normal 1:10 ratio relative to the U.S. in the following years.
Figure 10: Imports of Liberalized Common Goods to Chile from Canada and the U.S. (%)
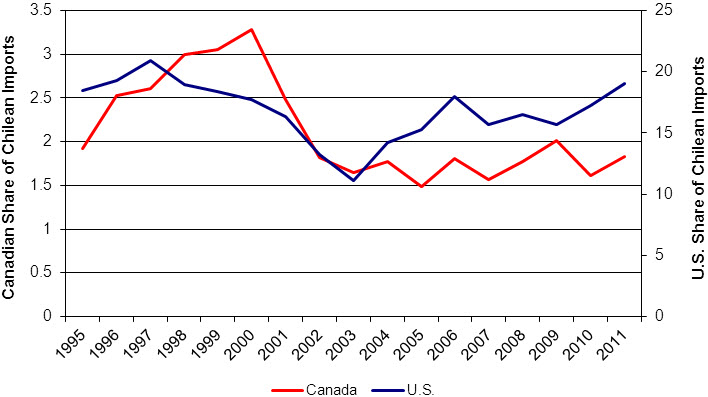
Figure 10 Text Alternative
| year | Canada | U.S. |
|---|---|---|
| 1995 | 1.9208912076 | 18.4981803247 |
| 1996 | 2.5320635054 | 19.3231502751 |
| 1997 | 2.6099552898 | 20.9272429567 |
| 1998 | 2.9941184331 | 18.9252155006 |
| 1999 | 3.05610216 | 18.3786830743 |
| 2000 | 3.2822647536 | 17.6974432076 |
| 2001 | 2.4828094628 | 16.3079902396 |
| 2002 | 1.820344713 | 13.2691353855 |
| 2003 | 1.6484431065 | 11.1400662341 |
| 2004 | 1.773652918 | 14.2230281997 |
| 2005 | 1.4913738163 | 15.2668001248 |
| 2006 | 1.8071601083 | 17.9390390706 |
| 2007 | 1.5703355863 | 15.6761888627 |
| 2008 | 1.772106162 | 16.4959241265 |
| 2009 | 2.0092703614 | 15.6694602862 |
| 2010 | 1.615282341 | 17.2714437079 |
| 2011 | 1.8280892814 | 19.0262089941 |
Source: COMTRADE database, World Integrated Trade Solutions and author's own calculations
4.3 Gains in New Trade
The data analysis presented above supports the view that the CCFTA had a significant trade-enhancing effect on bilateral trade between Canada and Chile; but at the same time, Canada's preference advantages in Chile had been diminishing since 2003 as the subsequent trade agreements between Chile and third countries ebbed Canada's existing CCFTA preferences. However, the analysis based on aggregated data might conceal the changes in product mixes such as entries of new products, new markets, and new firms, which represented an important part of business responses to trade liberalization. In recent years, the trade literature has argued strongly that failure to account for the gains in new trade could significantly underestimate the potential gains from trade liberalization. Reductions in trade costs through preferential trade arrangements lead to both the expansion of existing trade flows and the creation of new trade in products that previously were not traded bilaterally. To unearth any gains buried in the aggregate data analysis, this section decomposes bilateral trade between Canada and Chile based on contributions from existing products that were traded prior to the agreement and new products that were traded only after the CCFTA implementation. The data presentation here compares only the trade performance of existing and new products for the two referenced points: 1996, the year prior to the agreement and 2011, 15 years after the agreement. More sophisticated measurements of gains will be presented in the following section.
Table 9 shows the number of products that Canada imported from Chile in 1996 and 2011 classified by existing and new products with cross-reference to the extent of tariff reductions.Footnote 11 Since the implementation of the CCFTA, Canada had imported a larger number of products from Chile in all categories of tariff reductions. The number of products at the HS08 level that Canada imported from Chile nearly tripled from 454 products in 1996 to 1,210 products in 2011. Only 288 products that were imported prior to the agreement continued to be imported in 2011, but there was a net increase of 922 new products added to the existing portfolio of imported products from Chile. The majority of these new products came from two categories: duty free products (a total of 743) and products with tariff reductions of more than 10 percentage points (a total of 103). The net increases in the numbers of new products in the other two categories were not very significant.
Table 9: Number of Products Imported from Chile by CCFTA Tariff Reductions, 1996 and 2011
| Extent of Tariff Reduction | Number of Products in 1996 | Number of Products in 2011 | ||
|---|---|---|---|---|
| Existing Products | New Products | Total | ||
| Duty Free | 377 | 243 | 743 | 986 |
| 0.1-5 percentage points | 23 | 14 | 44 | 58 |
| 5.1-10 percentage points | 26 | 21 | 32 | 53 |
| 10.1 percentage points or more | 28 | 10 | 103 | 113 |
| Total | 454 | 288 | 922 | 1,210 |
Source: COMTRADE database, World Integrated Trade Solutions and author's own calculation
In terms of the value of new and existing products imported from Chile, Table 10 shows that 76 percent of the net increase in the value of imports came from the new products that were not imported prior to the trade deal, while the existing products that continued to be imported in 2011 were responsible for the remaining 24 percent. For all new imports, the majority of the increases came from the duty free category, that is, they were duty free even prior to the CCFTA implementation. For the products that had tariff reductions of more than 10 percentage points, as shown in Table 9, the increase in the number of new products was significant, but the net increase in the value of imports for each new product was limited; which means that the values of imports were thinly spread over a broader range of newly liberalized products.
Table 10: Values of Imports from Chile by CCFTA Tariff Reductions, 1996 and 2011, $
| Extent of Tariff Reductions | Exports in 1996 | Exports in 2011 | ||
|---|---|---|---|---|
| Existing Products | New Products | Total | ||
| Duty Free | 298,482,144 | 652,631,835 | 1,186,199,481 | 1,838,831,316 |
| 0.1-5 percentage points | 18,793,897 | 7,466,881 | 1,229,605 | 8,696,486 |
| 5.1-10 percentage points | 23,776,355 | 51,345,510 | 4,644,659 | 55,990,169 |
| 10.1 percentage points or more | 1,307,565 | 11,598,035 | 642,088 | 12,240,123 |
| Total | 342,359,961 | 723,042,261 | 1,192,715,833 | 1,915,758,094 |
Source: COMTRADE database, World Integrated Trade Solutions and author's own calculation
The situation was somewhat different for Canada's exports to Chile. The number of products that Canada exported to Chile more than doubled to reach 1,759 products in 2011from 848 products in 1996. There were 581 products exported in 1996 that continued to be active in the Chilean market in 2011, while 1,178 new products were added to the list of Canadian exports to Chile over the period. The majority of these new products (973 products) came from the category with tariff reductions of more than 10 percentage points.
Table 11: Number of Products Exported to Chile by CCFTA Tariff Reductions, 1996 and 2011
| Extent of Tariff Reduction | Number of Products in 1996 | Number of Products in 2011 | ||
|---|---|---|---|---|
| Existing Products | New Products | Total | ||
| Duty Free | 141 | 99 | 167 | 266 |
| 0.1-5 percentage points | 0 | 0 | 0 | 0 |
| 5.1-10 percentage points | 41 | 29 | 38 | 67 |
| 10.1 percentage points or more | 666 | 453 | 973 | 1,426 |
| Total | 848 | 581 | 1,178 | 1,759 |
Source: COMTRADE database, World Integrated Trade Solutions and author's own calculation
In terms of the value of new and existing products exported to Chile, about 90 percent of the net increase in the value of exports to Chile came from the new products that were not exported in 1996, while the net increase in the values of exports for the existing products was very limited, responsible for only the remaining 10 percent. As shown in Table 12, the tariff reductions under the CCFTA had strongly fostered new exports to Chile. New products associated with tariff reductions of more than 10 percentage points accounted for nearly 50 percent of the total net increase in the value of new exports. While the share of new products that were duty-free prior to the trade agreement in total new exports was not as significant as in the case of Canada's imports from Chile, they were still responsible for 43 percent in the total value of new exports to Chile.
Table 12: Values of Exports to Chile by CCFTA Tariff Reductions, 1996 and 2011, $
| Extent of Tariff Reductions | Exports in 1996 | Exports in 2011 | ||
|---|---|---|---|---|
| Existing Products | New Products | 2Total | ||
| Duty Free | 54,493,234 | 96,782,541 | 155,350,882 | 252,133,423 |
| 0.1-5 percentage points | 0 | 0 | 0 | 0 |
| 5.1-10 percentage points | 134,619,469 | 60,009,531 | 29,020,030 | 89,029,561 |
| 10.1 percentage points or more | 226,536,328 | 299,781,068 | 175,403,006 | 475,184,074 |
| Total | 415,649,031 | 456,573,140 | 359,773,918 | 816,347,058 |
Source: COMTRADE database, World Integrated Trade Solutions and author's own calculation
The disaggregated data analysis presented above argues well that trade cost reductions matter: the CCFTA was effective in expanding both the scope of products and the volume of trade for existing products in both directions of trade between Canada and Chile. Its effect on the scope of products or new products had been especially dominating compared to its effect on the volume of trade for the existing products, and such an effect seemed particularly pronounced with respect to Canada's exports to Chile. Furthermore, the effect of CCFTA went well beyond tariff reductions, as a substantial portion of new exports came from duty-free products, not from the liberalized sectors. This fact is consistent with the observation that a trade agreement is more than just tariff reductions. The increase in a large number of new products in the duty-free category should be credited as a result of services and investment liberalization, which could have had a significant effect on trade in goods, the "announcement effect": – the conclusion of an agreement acts like a "wake-up" call to the private sector, drawing attention to the new possibilities and greater certainty about market access.
Although the subsequent trade agreements signed between Chile and third parties had perturbed Canada's preferential advantages in the Chilean market, their eroding effect seemed to be concentrated in limiting the expansion of Canadian exports of existing products to Chile. They had little inhibiting effect on the increase of new Canadian exports to Chile. These are the important observations uncovered by the disaggregated data analysis and will be explored further based on more advanced techniques in the following section.
5. Assessing Effects of the CCFTA
Through the previous analyses, we see that Canada's exports to Chile and its imports from Chile both grew impressively upon trade liberalization, and we also see that a large amount of these increases consisted of new trade. However, as noticed in the previous analyses, there are always some "anomalies" that obscure the data and more advanced econometric techniques are required to obtain a more comprehensive and precise assessment of the trade-enhancing effect of the CCFTA.
Similar to other studies on assessing the effect of FTAs, the average treatment effect approach is adopted to establish a causal link between the CCFTA and the expansion of bilateral trade between Canada and ChileFootnote 12. In this case, both Canada and Chile are considered as having received a treatment (i.e., CCFTA), the average treatment effect is estimated by comparing the trade performance between the "treated" and the "untreated".
Since the level of trade for the "treated" in the absence of the CCFTA is not observable, we must compare its trade performance to countries that are not part of the CCFTA. The effect found will be the expected (average) difference in trade performance between the treated and untreated controlling for all common characteristics of each country-pair.
The estimating equation can be set up as follows,
ln yijkt = α + β1CCFTAijt + β2Tikt + β3 ln GDPit + β4 ln GDPjt + εijkt
where ln yijkt is the natural logarithm of imports in product k from country i to country j at time t, CCFTAijt is the treatment variable that equals to one when country i and country j are Canada and Chile (or vice versa) at time t ∀t ≥ 1997, Tijkt is one plus the tariff of product k that country i imposed on country j at time t , lnGDPit is the GDP of country i at time t, lnGDPjt is the GDP of country j at time t , and εijkt is random error. Applying a panel set-up (cross-sectional and time series data) with fixed effect will control for the effect between country-pair differences; for instance, different responses of different country-pairs to common macroeconomic shocks. The treatment effect found is interpreted as the average treatment effect on the treated (ATT), in this case, the country-pair Canada-Chile after 1997.
We augmented the basic specification listed above with the inclusion of control variables such as Inimrikt, the import penetration ratio of product k in country i at time t, representing import demand at the product level; ln pcgjt, productivity of country j at time t, representing country's production capacity; ln popit, the population of country i to control for the size of import markets; and ftait to control for preference erosion stemming from FTAs with third parties.
We run the regression above on the trade of Canada's top 50 trading partners over the period between 1995 and 2011 Footnote 13. In this average treatment evaluation set-up, all variables except the CCFTA are considered control variables and by doing this, the effect of the treatment variable, CCFTA is expected to be enhanced. It is expected that the treatment effect of tariff on imports would be negative because tariff is assumed to restrict or lower imports. Also expected is a negative effect of FTAs on imports because the existence of other FTAs may divert trade of CCFTA members to their other FTA partners and erodes preference advantages over time. The following table reports the estimation results:
Table 13: Regression Results from the Average Treatment Effect Estimation
Note: Superscripts ***, ** and * represent significance levels of 0.01, 0.05 and 0.1 respectively. Standard errors are presented in brackets.
| Variable | Estimated coefficient | |
|---|---|---|
| CCFTAijt | 0.115*** | 0.135*** |
| (0.005) | (0.005) | |
| Tijkt | 0.018*** | -0.010** |
| (0.004) | (0.004) | |
| ln GDPit | 0.507*** | 0.523*** |
| (0.006) | (0.006) | |
| ln GDPjt | 0.653*** | 0.542*** |
| (0.018) | (0.019) | |
| ln pcgjt | -0.692*** | -0.584*** |
| (0.019) | (0.020) | |
| ftait | -0.050*** | -0.046*** |
| (0.009) | (0.009) | |
| ln imrikt | 0.200*** | 0.201*** |
| (0.001) | (0.001) | |
| ln popit | 1.214*** | 1.031*** |
| (0.041) | (0.041) | |
| Tariff Standardization | Yes | No |
| Parametric weighing | Yes | Yes |
| Non-parametric matching | Yes | Yes |
| Panel set-up | Yes | Yes |
Source: Author's own calculations.
The estimation results of two separate specifications are presented in Table 13 and both results indicate that the treatment effect of the CCFTA is significant and confirm our expectation that the CCFTA did contribute positively to the growth of trade. In the first specification, Tijkt is standardized to represent the tariffs of other countries relative to CCFTA countriesFootnote 14. This approach allows the estimated coefficient of CCFTAijt to capture the "all-in" effect of the CCFTA including both the tariff and non-tariff effects of the CCFTA. Because of this adjustment, the coefficient of Tijkt should be interpreted as a net effect experienced only by the non-CCFTA partners in the presence of CCFTA. Normally, the effect of tariffs on imports is expected to be negative; however in this case, because CCFTA countries had more extensive tariff reductions relative to those of non-CCFTA trading partners, the standardized tariffs for the same products imported from non-CCFTA countries actually increased relative to CCFTA tariffs. Since Canada's and Chile's trade with non-CCFTA countries continued irrespective of CCFTA tariff reductions, the relation between the changes in relative tariffs of non-CCFTA countries and the growth in their trade flows can be positive. In addition to this adjustment, we apply a pre-estimation propensity score matching to ensure a balanced set of observations between the treated and the non-treated. Only the matched pairs will then be included in the regression where we apply a parametric propensity score weighing in the estimation. The treatment effect of CCFTA is estimated as 0.115. In other words, if the country-pair is composed of both CCFTA members, the import of product k by country i from country j will grow 12.2 percent (= [exp(0.115) -1]*100) faster than if the country-pair is not composed of both CCFTA members. With the presence of CCFTA, the estimated effect of relative tariffs for a non-CCFTA country pair to that of Canada-Chile on trade growth is positive. The effects of economic sizes measured in terms of GDP on trade are, as expected, strongly positive and significant. The treatment effect for the existence of other FTAs confirms the diversion effect of other FTAs on trade between CCFTA countries. Lastly, a high import penetration ratio or weak productivity performance is expected to increase more imports.
The second specification reported in Table 13 is estimated without standardization of tariffs. Thus, the effect of CCFTAijt is interpreted as a non-tariff effect, while the estimated coefficient for Tijkt represents the tariff effect including the effects for both CCFTA and non-CCFTA countries. Again, the estimation is carried out by applying both the matching and parametric weighting. The estimated effect of CCFTA is 0.135. This means that, conditional on all control variables, non-tariff effect of the CCFTA generate additional growth of trade by 14.5 percent (= [exp(0.135) -1]*100) between CCFTA countries relative to non-CCFTA countries. With the presence of CCFTA, the tariff rate has on average a negative effect on imports. The existence of other FTAs is estimated to decrease imports while a high import penetration ratio or weak productivity performance is expected to increase more imports.
The econometric results show that the effect of a free trade agreement to increase trade growth between the two countries is strong, leading to 12.2 percent growth of trade per year. Results of other specifications for robust check are reported in Annex 1.
5.1 Assessing Effect of Extensive Margin
While counting the number of, or examining the value contributed by, existing and new products as presented in Section 4.3 is a simple and useful way to gauge the gains in new trade, a more sophisticated approach is to decompose the increase in bilateral trade between Canada and Chile into contributions from greater volumes of traded product (intensive margin) and from a larger set of products (extensive margin). To this end, we follow the seminal work of Feenstra (1994) and Hummels and Klenow (2005)Footnote 15 to decompose bilateral merchandise trade data. The trade data at the HS06 product level from 1995 to 2010 are used in the estimation of extensive and intensive marginsFootnote 16.
According to Hummels and Klenow, the intensive margin of trade is defined on the basis of shares of bilateral trade in total trade within the categories of products already traded while extensive margins are defined on the basis of shares of bilateral trade in total trade across categories of products that were not traded in the initial period. Therefore, both extensive and intensive margin should always be less than one. The product of the extensive and intensive margins should be equal to a country's market share in the partner country's market (See Annex 2). The extensive margin gauges the importance of categories of products compared to that of volume of trade within categories. With all other things being equal, if a country concentrates all of its exports in a small number of product categories, it will have a higher intensive export margin and a lower extensive margin. If that country divides its exports thinly over many product categories, it will have a lower intensive export margin and a higher extensive margin.
Table 14 reports the extensive and intensive margins for Canada's exports to Chile. The imputed average index of extensive margins for Canada's exports to Chile was 0.606, much higher than the index for intensive margins of 0.036, which means that Canadian exports to Chile were mainly driven by the extensive margins of trade. Canada exported a broader spectrum of products rather than more existing products. An interesting observation from this table is that the extensive margins during the studied period increased from an average 0.57 to 0.60. This implies that the CCFTA opened opportunities for new exporters and new products by reducing the entry threshold to the Chilean market. Opposite to the upward trend of extensive margins is a gradual decline of intensive margins over the studied period, which indicates the worsening sale volume of each existing product. This observation is consistent with the data analysis presented in Section 4.3 which suggested that the erosion of Canadian CCFTA preferences in Chile curtailed the expansion of exports of existing products to Chile, but not the expansion of new products. The last column of Table 14 shows a decline in intensive margins contributed importantly to the drop in Canada's import share in the Chilean market. In other words, without the offsetting effect of the expansion of extensive margins or the continuous introduction of new products, the decline in Canada's import share in Chile would have been even more significant.
The existing literature in trade theory does not offer any compelling explanation as to what may lead to a coincidental decline of intensive margins and increase in extensive margins in the context of multiple trade agreements. Preference erosion should logically affect both extensive and intensive margins. It is highly plausible that what has been observed here is anomalous and the effect of the CCFTA on the margins is non-representative. However, given the parallel between our trade data and the international trade theory, the following explanation can be offered.
There are two opposite and competing forces affecting Canada's exports to Chile. First, consumers in both countries value variety and are willing to pay a premium for a broader range of products. The CCFTA created opportunities for new products and new firms in the partner country's market by reducing the entry thresholds. Second, Chile was a relatively small country with a population of 17 million and had a relatively small domestic market. When the subsequent FTAs between Chile and other third countries came into effect, the erosion of preferences caused the sales of existing Canadian products in Chile to be affected first. Canadian exporters continued to introduce new varieties; however, further expansion of each new Canadian variety would be constrained by the small size of the Chilean market and the competitive pressures from third countries.
Table 14: Extensive and Intensive Margins of Canadian Exports to Chile, 1995-2010
| Year | Extensive Margin | Intensive Margin | Import Share |
|---|---|---|---|
| 1995 | 0.565 | 0.037 | 0.021 |
| 1996 | 0.579 | 0.042 | 0.024 |
| 1997 | 0.613 | 0.038 | 0.023 |
| 1998 | 0.660 | 0.044 | 0.029 |
| 1999 | 0.625 | 0.046 | 0.029 |
| 2000 | 0.569 | 0.053 | 0.030 |
| 2001 | 0.573 | 0.046 | 0.026 |
| 2002 | 0.578 | 0.035 | 0.020 |
| 2003 | 0.656 | 0.030 | 0.020 |
| 2004 | 0.524 | 0.030 | 0.016 |
| 2005 | 0.558 | 0.024 | 0.013 |
| 2006 | 0.547 | 0.025 | 0.014 |
| 2007 | 0.610 | 0.037 | 0.023 |
| 2008 | 0.612 | 0.028 | 0.017 |
| 2009 | 0.610 | 0.031 | 0.019 |
| 2010 | 0.599 | 0.022 | 0.013 |
Source: Author's own calculation
The market situation for Chilean exports to Canada was completely different compared to Canadian exports to Chile (see Table 15). Chile was the only major South American country with which Canada had an FTA. Chile's products enjoyed exceptional preferences in the Canadian market that most other South American products did not have. Most importantly, the Canadian market was much bigger and broader than Chile's, and therefore more capable to absorb any new varieties of Chilean industrial and agricultural products. As a result, both extensive and intensive margins for Chilean exports to Canada increased significantly following the implementation of the CCFTA. Chile's share in total Canada's imports from the world increased from 0.1 percent before the CCFTA to 0.4 percent in 2011 with extensive and intensive margins increased by 0.25 points and 0.002 points, respectively.
Table 15: Extensive and Intensive Margins of Canadian Imports from Chile, 1995-2011
| Year | Extensive Margin | Intensive Margin | Import Share |
|---|---|---|---|
| 1995 | 0.199 | 0.006 | 0.001 |
| 1996 | 0.194 | 0.008 | 0.001 |
| 1997 | 0.226 | 0.005 | 0.001 |
| 1998 | 0.265 | 0.005 | 0.001 |
| 1999 | 0.280 | 0.005 | 0.001 |
| 2000 | 0.340 | 0.005 | 0.002 |
| 2001 | 0.344 | 0.005 | 0.002 |
| 2002 | 0.315 | 0.006 | 0.002 |
| 2003 | 0.372 | 0.007 | 0.003 |
| 2004 | 0.362 | 0.010 | 0.004 |
| 2005 | 0.380 | 0.011 | 0.004 |
| 2006 | 0.420 | 0.011 | 0.005 |
| 2007 | 0.373 | 0.011 | 0.004 |
| 2008 | 0.390 | 0.011 | 0.004 |
| 2009 | 0.444 | 0.011 | 0.005 |
| 2010 | 0.440 | 0.011 | 0.005 |
| 2011 | 0.444 | 0.010 | 0.004 |
Source: Author's own calculation
5.2 Assessing the CCFTA Effect on Economic Welfare
The analysis of the welfare effect of the CCFTA follows the approach of Arkolakis et al. (2012) by estimating Canada's overall welfare gains from the CCFTA. Estimating the contribution of welfare gains from the trade agreement could be challenging, but the recent paper by Arkolakis et al. provides an effective solution. The paper suggests that welfare prediction from all trade models could be pinned down to two key statistics:
- (i) the share of expenditure on domestic goods; and
- (ii) the elasticity of imports with respect to variable trade costs or "trade elasticity".
This approach significantly simplifies welfare calculations for trade agreements (See Annex 3).
Essentially, the welfare gain is calculated as,

where

is the change in income, λ is the share of Canada's expenditure on domestic goods, R is the import penetration ratio of imports from Chile and ε is the trade elasticity. The share of Canada's expenditure on domestic goods could be replaced by (1 - R) where R is the import penetration ratio of imports from Chile and can be calculated by the following expression,

where GDP is the gross domestic product of Canada,

is the sum of all imports from Chile and

is the sum of all exports to Chile.
Table 16 reported the estimated welfare gains from trade with Chile for the period from 1990 to 2010Footnote 17.
Table 16: Estimated Welfare Gains from Trade with Chile, 1990-2010
| Year | Estimated Welfare Gain (%) | Expected Welfare Gain without the CCFTA Effect (%) |
|---|---|---|
| 1990 | 0.008 | N/A |
| 1991 | 0.008 | N/A |
| 1992 | 0.009 | N/A |
| 1993 | 0.009 | N/A |
| 1994 | 0.009 | N/A |
| 1995 | 0.011 | N/A |
| 1996 | 0.013 | N/A |
| 1997 | 0.011 | 0.012 |
| 1998 | 0.012 | 0.013 |
| 1999 | 0.013 | 0.014 |
| 2000 | 0.016 | 0.014 |
| 2001 | 0.018 | 0.015 |
| 2002 | 0.018 | 0.016 |
| 2003 | 0.023 | 0.016 |
| 2004 | 0.031 | 0.017 |
| 2005 | 0.037 | 0.018 |
| 2006 | 0.039 | 0.018 |
| 2007 | 0.034 | 0.019 |
| 2008 | 0.035 | 0.020 |
| 2009 | 0.035 | 0.020 |
| 2010 | 0.036 | 0.021 |
Source: Author's own calculation
The import penetration ratios for imports from Chile had been rather low, which implies the calculated λ are on average about 0.999. Thus the calculated welfare gain on average equals 0.020 percent of Canada's GDP given the trade elasticity is -3.24, which was estimated based on recent tariff and trade data. It can be seen that on average Canada's welfare gains from trade with Chile before the CCFTA is only 0.009 percent of Canada's GDP while after the implementation of CCFTA, the welfare gains rose to an average of 0.025 percent.
Next, we simulate the welfare gains from any expanded trade with Chile as if there were no agreement in place to estimate the amount of net increases to Canada's welfare gains induced by the CCFTA. The first step is to perform a trend regression on λ from 1990 to 1996 to predict the expected 's if the economic conditions in 1990-1996 were to continue. In which case, the constant is found to be 0.99978 and the coefficient for the trends is -0.00002. The expected welfare gains for trade with Chile without the CCFTA effect are listed side by side with the estimated total welfare gains for trade with Chile in the above table. As can be seen, the differences between the estimated welfare gains with and without the CCFTA effect were rather large. The difference expands quite rapidly after the implementation of the CCFTA, and then stabilizes at the 0.015 percent of GDP during the period from 2007 to 2010. Based on Canada's GDP in 2010 of $1.66 trillion, Canada's overall net welfare gains from the CCFTA would be around $250 million annually.
Figure 11: Difference between Estimated and Expected Welfare Gains from Trade with Chile, 1990-2010
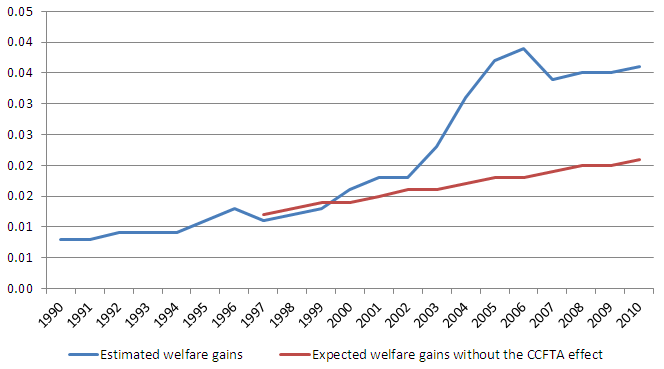
Figure 11 Text Alternative
| Year | Estimated welfare gains | Expected welfare gains without the CCFTA effect |
|---|---|---|
| 1990 | 0.008 | n/a |
| 1991 | 0.008 | n/a |
| 1992 | 0.009 | n/a |
| 1993 | 0.009 | n/a |
| 1994 | 0.009 | n/a |
| 1995 | 0.011 | n/a |
| 1996 | 0.013 | n/a |
| 1997 | 0.011 | 0.012 |
| 1998 | 0.012 | 0.013 |
| 1999 | 0.013 | 0.014 |
| 2000 | 0.016 | 0.014 |
| 2001 | 0.018 | 0.015 |
| 2002 | 0.018 | 0.016 |
| 2003 | 0.023 | 0.016 |
| 2004 | 0.031 | 0.017 |
| 2005 | 0.037 | 0.018 |
| 2006 | 0.039 | 0.018 |
| 2007 | 0.034 | 0.019 |
| 2008 | 0.035 | 0.02 |
| 2009 | 0.035 | 0.02 |
| 2010 | 0.036 | 0.021 |
Source: Author's own calculation
6. Trade in Services and Investment
The CCFTA was erected upon the template of a modern free trade agreement of the North American Free Trade Agreement (NAFTA) that covered trade in goods, and services, as well as the bilateral investment relationship. The CCFTA includes measures to liberalize trade in services with special provisions for telecommunications. However, financial services and mutual recognition of professional services designations and credentials are excluded from the original agreement.
Statistics for bilateral trade in services are extremely limited; therefore, it is hard to draw clear conclusions about the effect of services liberalization under the CCFTA based on the limited information.
Statistical analysis shows that bilateral trade in services between Canada and Chile following the implementation of the CCFTA trended modestly upward (See Figure 12). Total trade in services increased from $171 million in 1997 to $225 million in 2010. Of this amount, total Canadian service exports to Chile increased to $137 million in 2010 from $117 million in 1997 (an increase of 17 percent), while imports from Chile went up from $54 million to $88 million over the same period, which is equivalent to an increase of 63 percent. In 2010, Canada had a trade surplus with Chile in services by an amount of $49 million. Chile was the third-most important market in South America for Canadian services exports after Brazil and Colombia, and the third- most important source of imports in services after Brazil and Argentina.
Figure 12: Canada’s and Chile’s Exports of Services, 1993-2010, $ Million

Figure 12 Text Alternative
| Year | Chile's exports to canada | Canada exports to Chile |
|---|---|---|
| 1993 | 23 | 44 |
| 1994 | 24 | 48 |
| 1995 | 56 | 133 |
| 1996 | 41 | 89 |
| 1997 | 54 | 117 |
| 1998 | 28 | 65 |
| 1999 | 36 | 58 |
| 2000 | 64 | 68 |
| 2001 | 51 | 72 |
| 2002 | 86 | 173 |
| 2003 | 66 | 83 |
| 2004 | 72 | 107 |
| 2005 | 66 | 108 |
| 2006 | 67 | 83 |
| 2007 | 62 | 101 |
| 2008 | 81 | 119 |
| 2009 | 178 | 132 |
| 2010 | 88 | 137 |
Source: Statistics Canada
Canadian service exports to Chile have been consistently dominated by commercial services that include many knowledge-based computer, engineering and business services. Exports of travel and transportation services to Chile picked up over the period, but the increases were not enough to challenge the dominant position of commercial services. Canadian service imports from Chile were also led by travel and commercial services. There were signs of increased importing activities in transportation services from Chile.
Table 17: Bilateral Trade in Services between Canada and Chile, 1995-2010, $ Million
| 1995 | 1997 | 2000 | 2001 | 2005 | 2006 | 2007 | 2008 | 2009 | 2010 | |
|---|---|---|---|---|---|---|---|---|---|---|
| Total exports | 133 | 117 | 68 | 72 | 108 | 83 | 101 | 119 | 132 | 137 |
| Travel | 14 | 10 | 12 | 13 | 20 | 21 | 20 | 20 | 22 | 26 |
| Commercial services | 106 | 98 | 46 | 50 | 67 | 42 | 62 | 77 | 92 | 89 |
| Transportation and government services | 13 | 9 | 9 | 9 | 21 | 20 | 20 | 22 | 18 | 22 |
| Total imports | 56 | 54 | 64 | 51 | 66 | 67 | 62 | 81 | 178 | 88 |
| Travel | 18 | 35 | 33 | 25 | 25 | 25 | 25 | 25 | 25 | 25 |
| Commercial services | 19 | 4 | 18 | 15 | 17 | 20 | 11 | 26 | 122 | 29 |
| Transportation and government services | 19 | 15 | 13 | 11 | 25 | 23 | 26 | 31 | 31 | 34 |
Source: Statistics Canada
Chile already had a robust foreign direct investment regime prior to the implementation of the CCFTA. The investment provisions contained in the CCFTA, which are along the lines of a standard foreign investment treaty, further enhance Chile’s investment regime. Therefore, the agreement provides Canadian investors with greater confidence and certainty, which has a positive impact on Canadian direct investment flows into the Chilean economy.
Statistics for Canadian direct investment in Chile show a clear and convincing upward trend since the implementation of the CCFTA in 1997. The stock of Canadian direct investment in Chile grew four fold, up from $3.3 billion before the CCFTA 1997 to $12 billion in 2011, making Chile the ninth-most important destination for Canadian outward investment and the most important destination in South America. Similarly, according to Chile’s official source of information, total materialized Canadian direct investment in Chile amounted to US$ 14.8 billion for the period between 1974 and 2011, accounting for 18.1 percent of total materialized foreign direct investment in Chile, making Canada the third largest investor in the country after the U.S. and SpainFootnote 18.
Figure 13: Canadian Foreign Direct Investment in Chile, 1995-2011, $ Million

Figure 13 Text Alternative
| Year | FDI |
|---|---|
| 1995 | 3,281 |
| 1996 | 3,876 |
| 1997 | 4,878 |
| 1998 | 5,049 |
| 1999 | 5,421 |
| 2000 | 6,144 |
| 2001 | 6,639 |
| 2002 | 6,024 |
| 2003 | 5,636 |
| 2004 | 5,330 |
| 2005 | 4,626 |
| 2006 | 7,067 |
| 2007 | 10,856 |
| 2008 | 13,263 |
| 2009 | 12,037 |
| 2010 | 11,361 |
| 2011 | 13,726 |
Source: Statistic Canada CANSIM database table 376-0036, Mar 2012
7. Concluding Remarks
The analyses presented above confirm that the CCFTA is working as intended, encouraging greater trade between the two countries. Since the CCFTA came into force in 1997, total bilateral merchandise trade between Canada and Chile more than tripled to reach $2.7 billion in 2011 from only $718 million in 1997; of this amount, Canadian exports to Chile doubled to reach $819 million and imports from Chile grew six fold to reach $1.9 billion in 2011. Overall, on average, bilateral trade flows between the two countries grew 12.2 percent faster than would have been the case in the absence of the CCFTA. Canada's overall economic welfare gains from the CCFTA were around $250 million (or a quarter of a billion) annually.
It is noteworthy that the majority of trade gains achieved under the CCFTA came directly from new trade-products that were not traded prior to the CCFTA. There were 1,178 new Canadian products that were not exported before the CCFTA added to the product portfolio of Canadian exports to Chile in 2011. These new products contributed to 90 percent of the net increase in the value of Canadian exports to Chile. Similarly, there was a net increase of 922 new products imported from Chile that accounted for 76 percent of the net increase in the value of imports from Chile in 2011. The increase in new trade under the CCFTA means that consumers in both countries highly appreciated the new products and new varieties introduced under the CCFTA; at the same time, the CCFTA accommodated the new consumer demand by reducing entry thresholds.
It is also noteworthy that the numerous FTAs signed by Chile with third countries following the CCFTA reduced Canada's preference advantages in the Chilean market, particularly for the existing products, but they had only little inhibition on the introduction of new Canadian products to Chile. However, the size of gains from new Canadian exports to Chile was constrained by the relatively small size of the Chilean market and increased competitive pressures from third countries.
Furthermore, the CCFTA generated benefits beyond those associated with tariff elimination, as a substantial portion of new exports and new trade came from duty-free categories of products, not from the liberalized products. Measures to liberalize investment and services, which are common in today's new generation of free trade agreements, along with the improved certainty under the CCFTA, appear to have had a significant effect on two-way trade in goods over and beyond the effect induced by lower tariffs.
The agreement continues to evolve. The amendment of the CCFTA to include chapter on financial services and update chapters on government procurement, dispute settlement and customs procedures in 2012 will open new markets for exporters in both countries. In particular, an additional chapter on financial services that allows access to markets for cross-border provision of financial services and for investment in financial institutions would be a critical step to further enhance Canada's trade and direct investment in Chile. Similarly, ongoing work to update the rules of origin in the Agreement and the agreement to explore the possibility of further broadening the CCFTA will offer new opportunities for years to come.
Annex
1. Regression results from the average treatment effect estimation
Note: Superscripts ***, ** and * represent significance levels of 0.1, 0.05 and 0.01 respectively.
| Specification | ||||
|---|---|---|---|---|
| Variable | (1) | (2) | (3) | (4) |
| CCFTAijt | 0.061*** | 0.135*** | 0.115*** | 0.061*** |
| (0.020) | (0.005) | (0.005) | (0.020) | |
| Tijkt | 0.005*** | -0.010** | 0.018*** | 0.007*** |
| (0.002) | (0.004) | (0.004) | (0.002) | |
| ln GDPit | 0.788*** | 0.523*** | 0.507*** | 0.788*** |
| (0.006) | (0.006) | (0.006) | (0.006) | |
| ln GDPjt | 0.258*** | 0.541*** | 0.653*** | 0.258*** |
| (0.018) | (0.019) | (0.018) | (0.018) | |
| ln pcgji | -0.179*** | -0.584*** | -0.692*** | -0.179*** |
| (0.019) | (0.020) | (0.020) | (0.019) | |
| ftait | -0.058*** | -0.048*** | -0.052*** | -0.058*** |
| (0.009) | (0.009) | (0.009) | (0.010) | |
| ln imrikt | 0.244*** | 0.201*** | 0.200*** | 0.244*** |
| (0.001) | (0.001) | (0.001) | (0.001) | |
| ln popit | 0.390*** | 1.032*** | 1.214*** | 0.390*** |
| (0.036) | (0.041) | (0.041) | (0.036) | |
| Tariff standardization | No | No | Yes | Yes |
| Parametric weighing | No | Yes | Yes | No |
| Non-parametric matching | No | No | No | Yes |
| Panel set-up | Yes | Yes | Yes | Yes |
Source: Author s own calculation
2. Deriving the Margins
Following from Hummels and Klenow (2005), consider there are h = 1,...,H countries in the world. Each country produces many types of goods and all of them can be exported. Assume that the set of goods produced and exported by country h at time t is

For each

the quantity of good i is

and thus the vector of each type of good produced in country h at time t is

There are some goods that common to countries h and j, which we name as common goods set, It. Next we further assume the production function in country h follows a CES transformation function with aggregate resources

then the total outputs of country h equals,

where ω > 0 is the elasticity of transformation between goods.
The ratio of two CES functions across two countries h and j at time t is the product of the price index of the common goods,

to both countries

multiplied by the terms that indicate the revenue share of the non-common goods.

Here,

are weights calculated using the revenue shares of countries h and j .

The weights sum to unity over the common goods set It.
Now the revenue shares of the non-common goods are,


Note that the revenue shares are always calculated relative to the common goods set, It . Unless

we always have

As long as there are goods not in the common goods set that country h produces,

This means if country h produces certain goods that country j does not produce, then

will be strictly less than 1. In other words, the higher is

(the total value of the non-common goods country h produces), the lower is the ratio of the revenue shares

Therefore, the inverse of

represents the relative export variety of country h to country j.
Now if we add the world F as reference, then

represents all the varieties that the world produces at time t and considering the pair-wise comparison between country h and country j, we have the extensive margin of the exports from country h to country j equals to,

Estimated extensive margin of exports is within the range of 0 to 1, and its value can be interpreted as how much of the exports by country h to country j can be explained by export varieties. It can also be taken as a weighted count of country h's product set relative to the world's product set.
Applying similar logic, we derive the intensive margin of the exports from country h to country j as,

The estimated intensive margin of exports is also within the range of 0 to 1, and its value can be interpreted as how much of the exports by country h to country j can be explained by the volume.
The product of the extensive and intensive margins equals to country h's share of exports in country j,

Essentially, the above equals to the amount of exports from country h to country j divided by the total imports by country j, i.e. the import share of country h in country j.
3. Theoretical Set-up of Arkolakis et al. (2009)
Consider a traditional Armington (1969) model, there are i = 1,...,n countries, each produces a differentiated good using labour. The labour supply is inelastic and given by Li . There is a representative agent in each country that has the following Dixit-Stigliz utility function,

where qij is the quantity of country j's good consumed by country i and

is the elasticity of substitution between goods. The associated price index in country j is then given by,

where

is country i's wage and

are the trade costs between country i and country j.
When the Dixit-Stigliz utility equation is maximized with respect to the price index, the total imports from country i is then equal to,

with

being country j's total expenditure and

is the partial elasticity of relative imports with respect to the variable trade costs (i.e. the trade elasticity). Also, trade is balanced as

Assume that there is a shock that affects foreign labour endowment,

and trade cost,

but not those of country j's. The change in real income is then,

where λij is the country j's share of expenditure on goods from country i. By simple manipulation, we can see that the change in relative imports would be,

Combining the last two equations together, i.e. substituting the relative imports equation into the equation for change in real income, we have the change in real income as,

This gives rise to the final expression for changes in income,

The above expression equals to the change of income in the initial equilibrium and the new equilibrium. The interpretation of this result is straight forward; change in real income is dependent on terms of trade changes which in turn are dependent on changes of relative import demand. Thus, the system can be reduced to an expression with two sufficient statistics, λ and σ. Arkolakis et al. (2009) also demonstrate that under various assumptions on preferences, technologies of production and market structures, this expression still holds.
References
Anderson, James E. and Eric van Wincoop, "Gravity with Gravitas: A Solution to the Border Puzzle", American Economic Review, 93(1), 2003, p.170-92.
Antràs, Pol, "Firms, Contracts, and Trade Structure," Quarterly Journal of Economics 118(4), 2003: 1375-1418.
Antràs, Pol and Elhanan Helpman, "Global Sourcing," Journal of Political Economy 112(3) 2004: 552-580.
Antràs, Pol and Elhanan Helpman, "Contractual Frictions and Global Sourcing," in: Elhanan Helpman, Dalia Marin and Thierry Verdier (eds.), The Organization of Firms in a Global Economy. Cambridge Mass.: Harvard University Press, 2008: 9-54.
Arkolakis, Costas, Arnaud Costinot and Andrés RodrÍguez-Clare , "New Trade Models, Same Old Gains?" American Economic Review 102(1), 2012: 94-130.
Arkolakis, Costas, "Market Penetration Costs and the New Consumers Margin in International Trade," Journal of Political Economy, 118(6), 2010, p. 1151 - 1199.
Armington, Paul, "A Theory of Demand for Products Distinguished by Place of Production," International Monetary Fund Staff Papers, 16(1), 1969.
Baier, Scott L. and Jeffrey H. Bergstrand, "Economic Determinants of Free Trade Agreements," Journal of International Economics, 64(1), 2004, p. 29-63.
Baier, Scott L. and Jeffrey H. Bergstrand, "Do Free Trade Agreements Actually Increase Members' International Trade?" Journal of International Economics, 71, 2007, p. 72-95.
Baldwin, John and Beiling Yan, "Export Market Dynamics and Plant-level Productivity: Impact of Tariff Reductions and Exchange Rate Cycles," in D. Ciuriak (ed.), Trade Policy Research 2010: Exporter Dynamics and Productivity. (Ottawa: Foreign Affairs and International Trade Canada, 2010): 19-62.
Baldwin, Richard, "WTO 2.0: Global governance of supply chain trade," CEPR Policy Insight No. 64, December 2012.
Broda, Christian, Joshua Greenfield and David Weinstein, "From Groundnuts to Globalization: A Structural Estimate of Trade and Growth," National Bureau of Economic Research Working Paper No. 12512, 2006.
Broda, Christian and David E Weinstein, "Globalization and the Gains from Variety," The Quarterly Journal of Economics, 121(2), 2006, p.541-85.
Ciuriak, Dan, Beverly Lapham, and Robert Wolfe, with Terry Collins-Williams and John M. Curtis. "New-new trade policy," QED Working Paper, Queen's Economics Department, 2011.
Ciuriak, Dan, "Assessing the Impacts of FTAS; Issues for the Small, Open and Regionally Integrated Country", in D. Ciuriak (ed.), Trade Policy Research 2007. (Ottawa: Department of Foreign Affairs and International Trade, 2008): 101-122.
Clausing, Kimberly A., "Trade Creation and Trade Diversion in the Canada - United States Free Trade Agreement," The Canadian Journal of Economics, 34(3), 2001, p. 677-96.
Copeland, Brian R., "Is There a Case for Trade and Investment Promotion Policy?" in D. Ciuriak (ed.), Trade Policy Research 2007. Ottawa: Foreign Affairs and International Trade Canada, 2008: 1-64.
Dixit, Avinash K. and Victor Norman. Theory of International Trade. Cambridge: Cambridge University Press, 1980.
Ethier, Wilfred J., "National and International Returns to Scale in the Modern Theory of International Trade," American Economic Review 72(3), 1982: 389-405.
Feenstra, Robert C., "New Product Varieties and the Measurement of International Prices," The American Economic Review, 84(1), 1994, p.157-77.
Feenstra, Robert C. and Hiau Looi Kee, "Trade Liberalisation and Export Variety: A Comparison of Mexico and China," The World Economy, 30(1), 2007, p. 5-21.
Feenstra, Robert C., "Measuring the Gains from Trade under Monopolistic Competition," The Canadian Journal of Economics, 43(1), 2010, p. 1-28.
Felbemayr, G. and W. Kohler, "Exploring the Intensive and Extensive Margins of World Trade", Review of World Economics, 127(4), 2006, p.642-74.
Freund, Caroline L. and Emanuel Ornelas, Regional Trade Agreements, World Bank Policy Research Working Paper Series, 2010.
Grossman, Gene M. and Elhanan Helpman, Innovation and growth in the Global Economy, Cambridge, MA, MIT Press, 1991.
Head, Keith and John Ries, "Increasing Returns versus National Product Differentiation as an Explanation for the Pattern of U.S.-Canada Trade," The American Economic Review, 91(4), 2001, p. 858-76.
Helpman, Elhanan and Paul R. Krugman, Market Structure and Foreign Trade, MIT Press, Cambridge, MA, 1985.
Helpman, Elhanan, "International Trade in the Presence of Product Differentiation, Economies of Scale and Monopolistic Competition: A Chamberlin-Heckscher-Ohlin Approach," Journal of International Economy 11(3), 1981: p.305-340.
Hummels, David and Peter J. Klenow, "The Variety and Quality of a Nation's Exports," The American Economic Review, 95(3), 2005, p.704-23.
Kehoe, Timothy J. and Kim J. Ruhl, "How Important is the New Goods Margin in International Trade?" Staff Report 324, Federal Reserve Bank of Minneapolis, 2009.
Krugman, Paul R., "Increasing Returns, Monopolistic Competition, and International Trade," Journal of International Economics, 9, 1979, p. 469-79.
Krugman, Paul R., "Scale Economies, Product Differentiation and the Pattern of Trade," American Economic Review 70(5), 1980: p. 950-59.
Krugman, Paul R "Intra-industry Specialization and the Gains from Trade," Journal of Political Economy, 89(5), 1981, p. 959-73.
Lai, Huiwan and Daniel Trefler, "On Estimating the Welfare Gains from Trade Liberalization", University of Toronto Working Paper, 2004.
Lancaster, Kelvin J., "Intra-industry Trade under Perfect Monopolistic Competition," Journal of International Economics 10(2), 1980: p. 151-175.
Magee, Chris, "Endogenous Preferential Trade Agreements: An Empirical Analysis," Contributions to Economic Analysis and Policy, 2(1), Berkeley Electronic Press, 2003.
Melitz, M.J., "The Impact of Trade on Intra-industry Reallocations and Aggregate Industry Productivity," Econometrica, 71(6), 2003, p.1695-1725.
Melitz, Marc J. and Daniel Trefler, "Gains from Trade when Firms Matter", Journal of Economic Perspectives, 26(2), 2012, p.91-118.
Redding, Stephen J.,. "Theories of Heterogeneous Firms and Trade," Annual Review of Economics 3, 2011, p.77-105.
Romer, Paul M., "Endogenous Technological Change," Journal of Political Economy, 98, 1990, S71-102.
Tinbergen, Jan, Shaping the World Economy – Suggestions for an International Economic Policy, New York: Twentieth Century Fund, 1962.
Trefler, Daniel, "The Long and Short of Canada-US Free Trade Agreement," The American Economic Review, 94(4), 2004, p.870-95.
Viner, Jacob, The Customs Union Issue, New York: Carnegie Endowment for International Peace, 1950.
World Trade Organization, World Trade Report 2011: The WTO and Preferential Trade Agreements: From Co-existence to Coherence, 2011. Yi, Kei-Mu, "Can Vertical Specialization Explain the Growth of World Trade?"Journal of Political Economy, 111(1), 2003, p.52-102.
- Date Modified: