
Canada’s Merchandise Trade Performance with the EU after the Entry into Force of CETA
June 22th, 2020
PDF version (1,225 KB)Highlights
- In the two years since the Canada-European Union (EU) Comprehensive Economic and Trade Agreement (CETA) has provisionally come into effect, Canadian merchandise exports to the EU including the United Kingdom (UK) averaged $46.6 billion in 2018 and 2019, up 16.6 percent compared to the pre-CETA level of $40.0 billion in 2016. Over the same period, merchandise imports from the EU rose 24.1 percent.
- The products that experienced the largest tariff reductions had stronger export growth. For instance, the products that were given between 5 and 10 percentage points reductions in EU tariffs saw exports growth of 40.6 percent, while exports of products that were given less than 5 percentage points reductions in EU tariffs grew only 2.4 percent.
- Utilization of CETA preferences showed moderate improvements in the second year of CETA. The utilization rate for Canadian exports to the EU reached 53.1 percent in 2019, up from 49.9 percent in 2018.
- On the import side, the utilization rate for Canadian imports from the EU improved noticeably from 37.1 percent in 2018 to 45.9 percent in 2019.
- Utilization of CETA preferences varied widely across countries. The utilization rate for Canadian exports to Denmark was 86.8 percent; but it was lower for some large EU economies: Germany (30.7 percent), the UK (49.9 percent) and Italy (47.6 percent).
- Even within sectors, utilization of CETA preferences varied across countries. For instance, in the motor vehicles and parts sector, the utilization rate for Canadian exports to the UK was 65.9 percent, but for exports to Germany it was only 5.2 percent.
Overview
On September 21, 2017, the Canada-European Union Comprehensive Economic and Trade Agreement (CETA), Canada’s most ambitious trade agreement since the North American Free Trade Agreement (NAFTA), provisionally entered into force. The 27 European Union members and the United Kingdom (referred as the EU hereafter), as a group, represent Canada’s second largest merchandise trading partner after the United States. In 2019, the EU accounted for over 8 percent of Canada’s merchandise exports and nearly 13 percent of Canada’s merchandise imports.
This report aims to present Canada’s merchandise trade performance in the two years since the implementation of CETA. It provides historical comparisons of trade performances before and after CETA and comparisons between the products that directly benefit from CETA concessions (affected products) and products that were already duty-free, and for a limited number of agricultural products that were exempted from concessions (non-affected products).
However, this presentation of post-CETA trade performance should not be considered a causal effect of CETA. Given the short time series of trade data available since CETA was implemented, the analysis does not use advanced econometric techniques to establish causality and to control for macroeconomic fluctuations and other industry- and product-specific factors that also influence post-CETA bilateral trade flows. A more sophisticated analysis would be undertaken to isolate CETA’s effect when a longer time series becomes available.
The analysis is presented in three parts: 1) Canada-EU trade performance based on Statistics Canada’s trade data; 2) Canada-EU trade performance based on respective import statistics from Statistics Canada and Eurostat, which allows for splitting trade according to tariff concessions under CETA; and 3) the utilization of CETA preferences.
Part One: Canada-EU Trade Performance
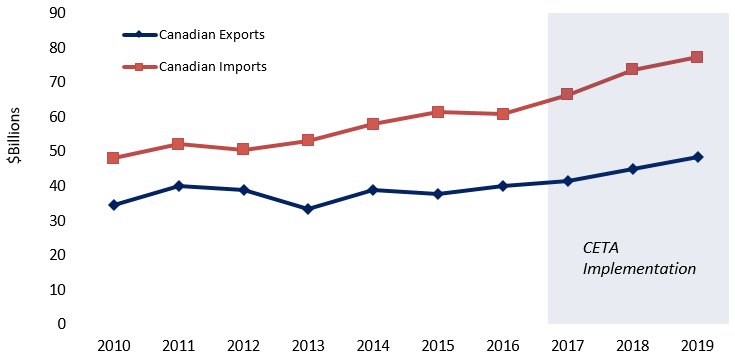
The following data analysis is based on merchandise exports and imports statistics from Statistics Canada. CETA has been provisionally in effect for over two years. In 2018, the first full year of its implementation, Canadian merchandise trade with the EU totalled $118.6 billion, representing an increase of 9.8 percent over 2017 and of 17.6 percent compared to 2016. Building on this momentum, Canadian merchandise trade with the EU continued growing in the second year after CETA’s implementation, advancing by 6.0 percent over 2018 to reach $125.7 billion in 2019.
Figure 1: Bilateral Merchandise Trade between Canada and the EU, 2010-2019
Text version
| Year | Canadian exports, in billions | Canadian imports, in billions | CETA implementation |
|---|---|---|---|
| 2010 | 34.595 | 48.009 | 2017 |
| 2011 | 40.110 | 52.095 | 2017 |
| 2012 | 38.919 | 50.564 | 2017 |
| 2013 | 33.265 | 53.145 | 2017 |
| 2014 | 38.753 | 57.860 | 2017 |
| 2015 | 37.771 | 61.438 | 2017 |
| 2016 | 39.993 | 60.867 | 2017 |
| 2017 | 41.588 | 66.443 | 2017 |
| 2018 | 44.923 | 73.674 | 2017 |
| 2019 | 48.303 | 77.364 | 2017 |
Data: Statistics Canada
Sources: Office of the Chief Economist Global Affairs Canada
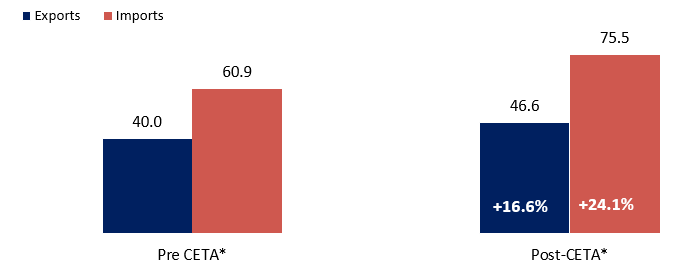
Canadian merchandise exports to the EU averaged $46.6 billion annually since CETA entered into force, up 16.6 percent, or $6.6 billion, compared to exports in 2016 – the last full year before preferential tariff treatment under CETA became applicable. At the same time, Canadian merchandise imports from the EU averaged $75.5 billion, up 24.1 percent, or $14.7 billion, over the same period.
Figure 2: Canadian Merchandise Trade with the EU since CETA, in $Billions
Text version
| Pre-CETA | Post-CETA | Growth | |
|---|---|---|---|
| Exports, in billions | 40.0 | 46.6 | 16.6% |
| Imports, in billions | 60.9 | 75.5 | 24.1% |
*Pre-CETA refers to 2016. Post-CETA refers to the annual average trade value in 2018 and 2019
Data: Statistics Canada
Source: Office of the Chief Economist, Global Affairs Canada
At the sectoral levelFootnote 1, four out of the top five Canadian export sectors registered rapid growth. Exports of mineral fuels and oils rose 161.3 percent, mainly on higher exports of crude oil. Moreover, exports of precious stones and metals, machinery, and mineral ores all improved, supported by strong growth in gold, gas turbines, and iron ores. Conversely, exports of aircraft and parts fell 16.6 percent.
Table 1: Canadian Merchandise Exports to the EU, Top 5 Sectors, in $Millions
| Sector | Pre-CETA* | Post-CETA* | Growth ($M) | Growth (%) |
|---|---|---|---|---|
| Precious stones and metals | 13,174 | 14,108 | 933 | 7.1 |
| Mineral fuels and oils | 1,727 | 4,512 | 2,785 | 161.3 |
| Machinery | 3,725 | 4,036 | 311 | 8.4 |
| Mineral ores | 2,749 | 3,843 | 1,094 | 39.8 |
| Aircrafts and parts | 3,355 | 2,797 | -558 | -16.6 |
| Other | 15,263 | 17,317 | 2,054 | 13.5 |
| Total | 39,993 | 46,613 | 6,620 | 16.6 |
* Pre-CETA refers to 2016. Post-CETA refers to the annual average trade value in 2018 and 2019.
Data: Statistics Canada
Source: Office of the Chief Economist, Global Affairs Canada
On the import side, the top five imports from the EU all rose since the implementation of CETA. Machinery, the top product sector, led all products and expanded 28.7 percent or $3.3 billion, driven by gas turbines and combustion engines. Imports of motor vehicles and parts and pharmaceutical products also posted strong growth.
Table 2: Canadian Merchandise Imports from the EU, Top 5 Sectors, in $Millions
| Sector | Pre-CETA* | Post-CETA* | Growth ($M) | Growth (%) |
|---|---|---|---|---|
| Machinery | 11,575 | 14,895 | 3,319 | 28.7 |
| Motor vehicles and parts | 8,306 | 9,987 | 1,682 | 20.2 |
| Pharmaceutical products | 6,132 | 8,034 | 1,902 | 31.0 |
| Mineral fuels and oils | 3,385 | 4,294 | 909 | 26.8 |
| Electronics | 4,067 | 4,254 | 187 | 4.6 |
| Other | 27,402 | 34,056 | 6,654 | 24.3 |
| Total | 60,867 | 75,519 | 14,652 | 24.1 |
* Pre-CETA refers to 2016. Post-CETA refers to the annual average trade value in 2018 and 2019.
Data: Statistics Canada
Source: Office of the Chief Economist, Global Affairs Canada
Canada’s trade performance with individual EU member states
The expansion in Canadian merchandise exports to the EU since the implementation of CETA was mainly due to growing exports to the Netherlands, Germany and the United Kingdom (UK). The Netherlands, Canada’s third largest export destination in the EU (after the UK and Germany), posted the strongest growth at $2.1 billion, mainly caused by higher exports of mineral fuels and oils and aluminum. It should be noted that the Netherlands is a transhipment point for EU trade. Many products exported by Canada to the Netherlands may be shipped further to other EU countries.
Broad-based increases of various products led to a surge of $1.5 billion in exports to Germany, while precious stones and metals, and mineral fuels and oils supported growth in exports to the UK. Other EU members that saw strong Canadian export growth include Latvia (led by aircraft and parts), Ireland (mineral fuels and oils, and cereals), and Italy (pharmaceutical products, and mineral fuels and oils). On the other hand, a decline in exports to Malta, Bulgaria, Denmark, and Luxembourg tempered overall gains.
Table 3: Canadian Merchandise Exports to the EU, Top 10 Destinations, in $Millions
| Country | Pre-CETA* | Post-CETA* | Growth ($M) | Growth (%) |
|---|---|---|---|---|
| United Kingdom | 17,098 | 18,207 | 1,109 | 6.5 |
| Germany | 4,065 | 5,566 | 1,501 | 36.9 |
| Netherlands | 2,843 | 4,967 | 2,124 | 74.7 |
| France | 3,400 | 3,540 | 140 | 4.1 |
| Belgium | 3,214 | 3,504 | 289 | 9.0 |
| Italy | 2,340 | 3,176 | 836 | 35.7 |
| Spain | 1,805 | 1,825 | 21 | 1.2 |
| Ireland | 496 | 820 | 325 | 65.4 |
| Finland | 671 | 779 | 108 | 16.1 |
| Poland | 617 | 744 | 128 | 20.7 |
* Pre-CETA refers to 2016. Post-CETA refers to the annual average trade value in 2018 and 2019.
Data: Statistics Canada
Source: Office of the Chief Economist, Global Affairs Canada
Canada also recorded substantial growth in imports from the EU since the implementation of CETA. Imports from Belgium registered the largest expansion, up by $2.5 billion, or 112.5 percent, mainly due to motor vehicles and parts, and organic chemicals. At the same time, imports from France (aircrafts), Germany (machinery), and Italy (machinery) also posted strong growth.
Table 4: Canadian Merchandise Imports from the EU, Top 10 Sources, in $Millions
| Country | Pre-CETA* | Post-CETA* | Growth ($M) | Growth (%) |
|---|---|---|---|---|
| Germany | 17,223 | 19,186 | 1,964 | 11.4 |
| Italy | 7,539 | 9,234 | 1,695 | 22.5 |
| United Kingdom | 8,258 | 9,223 | 966 | 11.7 |
| France | 5,932 | 7,943 | 2,011 | 33.9 |
| Belgium | 2,215 | 4,706 | 2,492 | 112.5 |
| Netherlands | 3,674 | 4,596 | 921 | 25.1 |
| Spain | 2,357 | 3,235 | 878 | 37.3 |
| Ireland | 1,935 | 2,990 | 1,054 | 54.5 |
| Sweden | 2,054 | 2,330 | 276 | 13.4 |
| Poland | 1,919 | 2,224 | 305 | 15.9 |
* Pre-CETA refers to 2016. Post-CETA refers to the annual average trade value in 2018 and 2019.
Data: Statistics Canada
Source: Office of the Chief Economist, Global Affairs Canada
Trade performance by province and territory
Nine out of the thirteen Canadian provinces and territories posted an increase in exports to the EU since CETA’s implementation. Newfoundland and Labrador led all regions as its exports to the EU more than doubled compared to the pre-CETA year, mainly due to stronger exports of mineral fuels and oils,. and mineral ores. Ontario (gold and motor vehicles and parts) and Quebec (aluminum) also recorded strong exports growth. In contrast, exports to the EU from Saskatchewan fell moderately (with a decline in durum wheat exports), the Northwest Territories (diamonds), and Manitoba (nickel).
Table 5: Canadian Merchandise Exports to the EU by Province and Territory, in $Millions
| Province / Territory | Pre-CETA* | Post-CETA* | Growth ($M) | Growth (%) |
|---|---|---|---|---|
| Ontario | 21,566 | 23,539 | 1,973 | 9.2 |
| Quebec | 9,872 | 10,636 | 764 | 7.7 |
| Newfoundland and Labrador | 1,962 | 4,317 | 2,355 | 120.0 |
| British Columbia | 1,989 | 2,610 | 621 | 31.2 |
| Alberta | 1,142 | 1,506 | 364 | 31.9 |
| Saskatchewan | 1,131 | 995 | -135 | -12.0 |
| Northwest Territories | 1,042 | 810 | -232 | -22.3 |
| Nunavut | 0.4 | 571 | 571 | ∞ |
| Nova Scotia | 442 | 554 | 112 | 25.3 |
| Manitoba | 598 | 536 | -62 | -10.3 |
| New Brunswick | 122 | 366 | 244 | 199.8 |
| Prince Edward Island | 127 | 173 | 46 | 36.2 |
| Yukon | 0.5 | 0.4 | 0 | -6.6 |
* Pre-CETA refers to 2016. Post-CETA refers to the annual average trade value in 2018 and 2019.
Data: Statistics Canada. Source: Office of the Chief Economist, Global Affairs Canada
Nearly all Canadian provinces and territories reported increases in imports post-CETA. Ontario recorded the strongest growth, up by $6.5 billion, mainly due to pharmaceutical products, machinery, and organic chemicals. Quebec (machinery), Nova Scotia (motor vehicles and parts), and British Columbia (machinery) also experienced strong imports growth.
Table 6: Canadian Merchandise Imports from the EU by Province and Territory, in $Millions
| Province / Territory | Pre-CETA* | Post-CETA* | Growth ($M) | Growth (%) |
|---|---|---|---|---|
| Ontario | 27,481 | 33,939 | 6,458 | 23.5 |
| Quebec | 19,600 | 23,140 | 3,540 | 18.1 |
| Nova Scotia | 5,359 | 7,292 | 1,933 | 36.1 |
| British Columbia | 3,328 | 4,762 | 1,434 | 43.1 |
| Alberta | 2,304 | 2,727 | 422 | 18.3 |
| Manitoba | 1,150 | 1,525 | 375 | 32.6 |
| New Brunswick | 444 | 1,071 | 627 | 141.2 |
| Saskatchewan | 531 | 739 | 208 | 39.2 |
| Newfoundland and Labrador | 659 | 308 | -351 | -53.3 |
| Prince Edward Island | 7.9 | 11 | 2.7 | 34.4 |
| Nunavut | 0.6 | 3.9 | 3.3 | 543.1 |
| Yukon | 1.7 | 1.0 | -0.7 | -41.8 |
| Northwest Territories | 0.0 | 0.0 | 0 | - |
* Pre-CETA refers to 2016. Post-CETA refers to the annual average trade value in 2018 and 2019.
Data: Statistics Canada
Source: Office of the Chief Economist, Global Affairs Canada
Part Two: Dutiable Trade between Canada and the EU
Data used in this part come from respective import statistics, i.e., Canadian exports to the EU are derived from the EU imports from Canada, provided by Eurostat. They are matched to the tariff concessions under CETA that allows for splitting the data into dutiable imports (products that are MFN dutiable and given tariff reduction under CETA) and duty-free imports.
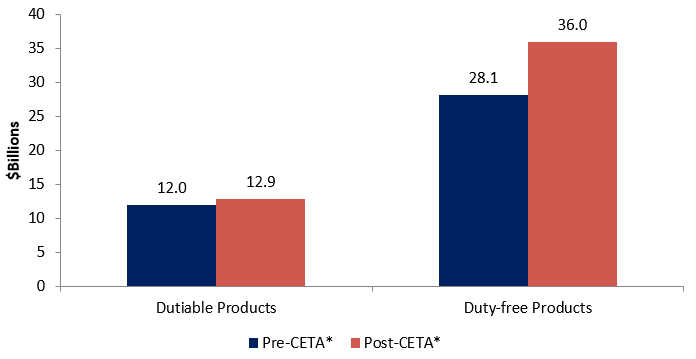
Approximately 26.2 percent of total average Canadian exports to the EU ($12.9 billion, or €8.6 billion)Footnote 2 were considered dutiable. Dutiable exports increased 8.1 percent since the implementation of CETA, mainly driven by increases in turbo propellers and unwrought aluminum. At the same time, duty-free exports to the EU, while not benefiting directly from tariff reductions under CETA, increased 27.8 percent compared to 2016, due to increases in exports of crude oil from bituminous minerals, medicaments of mixed amino acids, and semi-manufactured forms of gold.
Figure 3: Dutiable Exports from Canada to the EU, in $Billions
Text version
| Dutiable products, in billions | Duty-free products, in billions | |
|---|---|---|
| Pre-CETA | 12.0 | 28.1 |
| Post-CETA | 12.9 | 26.0 |
* Pre-CETA refers to 2016. Post-CETA refers to the annual average trade value in 2018 and 2019.
Data: Eurostat
Source: Office of the Chief Economist, Global Affairs Canada
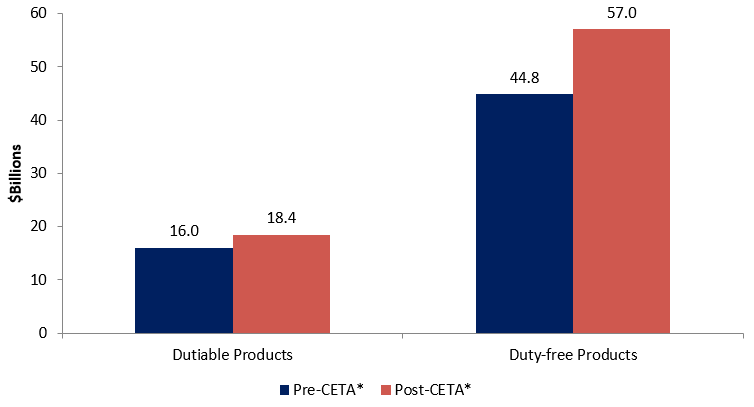
On the other hand, total annual average merchandise imports by Canada from the EU in 2018 and 2019 reached $75.5 billion, which represents an increase of 19.3 percent compared to total imports of $60.9 billion in 2016. Dutiable imports by Canada from the EU averaged $18.4 billion in 2018 and 2019, or 24.5 percent of total merchandise imports. This represents an increase of 15.0 percent compared to 2016. The rise in imports was driven by passenger cars of medium cylinder capacity and special purpose vehicles, and jewelry parts of precious metals. Annual average duty-free imports in 2018 and 2019 stood at $57.0 billion. Although not directly benefiting from CETA, this represents an increase of 27.0 percent compared to 2016, mainly driven by large increases in tanks and armoured fighting vehicles, steroidal hormones, and medicaments of mixed amino acids.
Figure 4: Dutiable Imports by Canada from the EU, in $Billions
Text version
| Dutiable products, in billions | Duty-free products, in billions | |
|---|---|---|
| Pre-CETA | 16.0 | 44.8 |
| Post-CETA | 18.4 | 57.0 |
* Pre-CETA refers to 2016. Post-CETA refers to the annual average trade value in 2018 and 2019.
Data: Statistics Canada
Source: Office of the Chief Economist, Global Affairs Canada
Tables 5 and 6 show the sectors that experienced the highest growth in Canadian exports of dutiable and duty-free products to the EU by valueFootnote 3. The sectors that saw their dutiable exports grew the most are machinery, aluminum and articles, motor vehicles and parts, plastics, and electronics. Total growth of dutiable exports by these sectors made up as much as 64.8 percent of total growth in exports of dutiable products.
Table 5: Sectors with Highest Growth of Dutiable Exports by Canada to the EU, in $Millions
| HS 02 | Sector | Pre-CETA* | Post-CETA* | Growth ($M) | Growth (%) |
|---|---|---|---|---|---|
| 84 | Machinery | 3,465 | 4,303 | 838 | 24.2 |
| 76 | Aluminum and articles | 217 | 566 | 350 | 161.4 |
| 87 | Motor vehicles and parts | 469 | 710 | 241 | 51.4 |
| 39 | Plastics and articles | 266 | 450 | 184 | 69.1 |
| 85 | Electronics | 507 | 671 | 164 | 32.3 |
* Pre-CETA refers to 2016. Post-CETA refers to the annual average trade value in 2018 and 2019.
Data: Eurostat
Source: Office of the Chief Economist, Global Affairs Canada
Exports that grew the most in the duty-free category are ores, slag and ash, mineral fuels and oils, pharmaceutical products, precious stones and metals, and medical instruments. Total growth in duty-free exports by these sectors made up approximately 86.9 percent of total growth of duty-free exports.
Table 6: Sectors with Highest Growth of Duty-free Exports by Canada to the EU, in $Millions
| HS 02 | Sector | Pre-CETA* | Post-CETA* | Growth ($M) | Growth (%) |
|---|---|---|---|---|---|
| 26 | Mineral ores | 2,723 | 4,887 | 2,164 | 79.5 |
| 27 | Mineral fuels and oils | 1,898 | 4,037 | 2,139 | 112.7 |
| 30 | Pharmaceutical products | 973 | 2,417 | 1,443 | 148.3 |
| 71 | Precious stones and metals | 13,678 | 14,884 | 1,206 | 8.8 |
| 90 | Medical instruments | 920 | 1,175 | 255 | 27.7 |
* Pre-CETA refers to 2016. Post-CETA refers to the annual average trade value in 2018 and 2019.
Data: Eurostat
Source: Office of the Chief Economist, Global Affairs Canada
Tables 7 and 8 show the sectors that experienced the highest growth in imports of dutiable and duty-free products from the EU by value. The sectors where dutiable imports grew the most are railway, locomotives and parts, products of milling industry, aircrafts and parts, meat, and preparations of meat or fish. Total growth of dutiable imports in these sectors made up as much as 93.2 percent of total growth of dutiable imports.
Table 7: Sectors with Highest Growth of Dutiable Imports by Canada from the EU, in $Millions
| HS 02 | Sector | Pre-CETA* | Post-CETA* | Growth ($M) | Growth (%) |
|---|---|---|---|---|---|
| 86 | Railway, locomotives and parts | 27.1 | 55.7 | 28.6 | 105.7 |
| 11 | Products of milling industry | 19.2 | 25.2 | 6.0 | 31.3 |
| 88 | Aircrafts and parts | 1.4 | 6.8 | 5.4 | 376.4 |
| 02 | Meat | 40.2 | 45.2 | 5.0 | 12.4 |
| 16 | Preparations of meat or fish | 54.7 | 57.1 | 2.4 | 4.5 |
* Pre-CETA refers to 2016. Post-CETA refers to the annual average trade value in 2018 and 2019.
Data: Statistics Canada
Source: Office of the Chief Economist, Global Affairs Canada
The sectors where duty-free imports grew the most are motor vehicles and parts, nickel and articles, essential oils and cosmetic preparations, wood pulps, and prepared feathers and down and articles. Total growth of duty-free imports in these sectors made up almost all the total growth in imports of duty-free products.
Table 8: Sectors with Highest Growth of Duty-free Imports by Canada from the EU, in $Millions
| HS 02 | Sector | Pre-CETA* | Post-CETA* | Growth ($M) | Growth (%) |
|---|---|---|---|---|---|
| 87 | Motor vehicles and parts | 1,986 | 2,036 | 50 | 2.5 |
| 75 | Nickel and articles | 193 | 220 | 27 | 13.8 |
| 33 | Essential oils and cosmetic preparations | 92 | 111 | 19 | 20.7 |
| 47 | Wood pulps | 2 | 4 | 1 | 49.0 |
| 67 | Prepared feathers and down | 0 | 1 | 1 | 488.3 |
* Pre-CETA refers to 2016. Post-CETA refers to the annual average trade value in 2018 and 2019.
Data: Statistics Canada
Source: Office of the Chief Economist, Global Affairs Canada
At the individual country level, Canada had positive growth in dutiable exports to 17 out of the 28 EU member states. The largest increase in the value of exports was to Latvia, which grew by as much as $904 million (equivalent to 12,415.3 percent growth over the value reported in 2016); the increases were mostly in aircraft parts, chemical products, and process control systems. The biggest decline in value was to Malta where dutiable exports from Canada fell by $751 million, due to large decreases in exports of aircrafts, inflatable boats, and automatic data processing units.
Table 9: Dutiable Exports to Individual EU Member States by Canada, in $Millions
| Member state | Pre-CETA* | Post-CETA* | Growth ($M) | Growth (%) |
|---|---|---|---|---|
| Austria | 223 | 242 | 19 | 8.5 |
| Belgium | 597 | 576 | -21 | -3.5 |
| Bulgaria | 21 | 32 | 11 | 51.0 |
| Croatia | 7 | 14 | 7 | 99.5 |
| Cyprus | 2 | 7 | 5 | 296.3 |
| Czechia | 107 | 221 | 114 | 106.8 |
| Denmark | 193 | 241 | 48 | 25.0 |
| Estonia | 27 | 12 | -15 | -55.3 |
| Finland | 137 | 166 | 30 | 21.6 |
| France | 1,715 | 1,833 | 117 | 6.8 |
| Germany | 2,033 | 2,575 | 541 | 26.6 |
| Greece | 36 | 26 | -10 | -27.4 |
| Hungary | 48 | 51 | 3 | 7.0 |
| Ireland | 316 | 183 | -133 | -42.1 |
| Italy | 624 | 738 | 114 | 18.3 |
| Latvia | 7 | 912 | 904 | 12,415.3 |
| Lithuania | 8 | 21 | 13 | 173.4 |
| Luxembourg | 295 | 107 | -188 | -63.8 |
| Malta | 847 | 96 | -751 | -88.6 |
| Netherlands | 874 | 1,457 | 583 | 66.7 |
| Poland | 147 | 213 | 66 | 44.8 |
| Portugal | 66 | 66 | 1 | 0.8 |
| Romania | 27 | 38 | 11 | 40.9 |
| Slovakia | 53 | 22 | -31 | -58.6 |
| Slovenia | 49 | 29 | -21 | -41.7 |
| Spain | 744 | 598 | -146 | -19.7 |
| Sweden | 307 | 218 | -89 | -28.9 |
| United Kingdom | 2,461 | 2,245 | -216 | -8.8 |
* Pre-CETA refers to 2016. Post-CETA refers to the annual average trade value in 2018 and 2019.
Data: Eurostat
Source: Office of the Chief Economist, Global Affairs Canada
Canada had positive growth in duty-free exports to all but three EU member states post-CETA. The largest increases in value were to the UK (jewelry of precious metals, crude oil from bituminous minerals, and unworked diamonds), the Netherlands (iron ores, cobalt mattes, and titanium ores), Germany (silver and iron ores) and Belgium (medicaments of amino acids, iron ores, and unwrought nickel). Canada exported $1 billion more to these states by comparison with 2016.
Table 10: Duty-free Exports to Individual EU Member States by Canada, in $Millions
| Member state | Pre-CETA* | Post-CETA* | Growth ($M) | Growth (%) |
|---|---|---|---|---|
| Austria | 83 | 107 | 24 | 29.0 |
| Belgium | 2,712 | 3,888 | 1,176 | 43.4 |
| Bulgaria | 47 | 45 | -1 | -3.2 |
| Croatia | 8 | 46 | 37 | 438.5 |
| Cyprus | 7 | 11 | 4 | 58.7 |
| Czechia | 72 | 186 | 114 | 158.3 |
| Denmark | 158 | 126 | -32 | -20.3 |
| Estonia | 28 | 52 | 24 | 83.5 |
| Finland | 411 | 663 | 253 | 61.5 |
| France | 1,651 | 1,971 | 320 | 19.4 |
| Germany | 2,492 | 3,825 | 1,333 | 53.5 |
| Greece | 70 | 105 | 35 | 49.6 |
| Hungary | 64 | 55 | -9 | -13.8 |
| Ireland | 301 | 598 | 297 | 98.8 |
| Italy | 1,482 | 1,696 | 214 | 14.4 |
| Latvia | 5 | 15 | 10 | 210.2 |
| Lithuania | 10 | 15 | 5 | 53.0 |
| Luxembourg | 10 | 11 | 1 | 7.9 |
| Malta | 2 | 3 | 1 | 31.3 |
| Netherlands | 1,489 | 2,830 | 1,340 | 90.0 |
| Poland | 133 | 194 | 61 | 45.7 |
| Portugal | 172 | 186 | 13 | 7.7 |
| Romania | 75 | 108 | 33 | 43.7 |
| Slovakia | 53 | 109 | 56 | 106.8 |
| Slovenia | 108 | 85 | -23 | -21.2 |
| Spain | 987 | 1,681 | 694 | 70.3 |
| Sweden | 295 | 348 | 53 | 17.8 |
| United Kingdom | 15,219 | 17,005 | 1,786 | 11.7 |
* Pre-CETA refers to 2016. Post-CETA refers to the annual average trade value in 2018 and 2019.
Data: Eurostat
Source: Office of the Chief Economist, Global Affairs Canada
Canada has increased its imports of dutiable products from 25 out of the 28 EU member states. The largest increase in value was imports from Italy, up by as much as $625 million, equivalent to a 21.9 percent growth compared to 2016. The growth was largely generated by increases in imports of motor vehicles of large cylinder capacity, and jewelry of precious metals. The biggest decline in value was reported for imports from Romania, which decreased by $122 million, due to lower imports of vehicle steering parts, footwear, and furniture.
Table 11: Dutiable Imports by Canada from Individual EU Member States, in $Millions
| Member state | Pre-CETA* | Post-CETA* | Growth ($M) | Growth (%) |
|---|---|---|---|---|
| Austria | 119 | 196 | 77 | 65.0 |
| Belgium | 318 | 425 | 107 | 33.8 |
| Bulgaria | 57 | 61 | 4 | 6.7 |
| Croatia | 13 | 48 | 35 | 260.5 |
| Cyprus | 1 | 2 | 1 | 90.5 |
| Czechia | 111 | 137 | 26 | 23.3 |
| Denmark | 100 | 136 | 36 | 36.2 |
| Estonia | 12 | 14 | 2 | 18.2 |
| Finland | 81 | 89 | 8 | 10.1 |
| France | 1,710 | 2,237 | 526 | 30.8 |
| Germany | 5,504 | 5,434 | -70 | -1.3 |
| Greece | 88 | 112 | 24 | 27.1 |
| Hungary | 239 | 300 | 61 | 25.7 |
| Ireland | 152 | 159 | 7 | 4.4 |
| Italy | 2,945 | 3,590 | 645 | 21.9 |
| Latvia | 16 | 20 | 4 | 22.0 |
| Lithuania | 35 | 56 | 21 | 59.7 |
| Luxembourg | 12 | 12 | 0 | -1.1 |
| Malta | 2 | 3 | 2 | 86.4 |
| Netherlands | 290 | 502 | 212 | 73.1 |
| Poland | 417 | 435 | 17 | 4.2 |
| Portugal | 264 | 343 | 78 | 29.7 |
| Romania | 301 | 179 | -122 | -40.6 |
| Slovakia | 409 | 628 | 220 | 53.8 |
| Slovenia | 17 | 33 | 16 | 91.6 |
| Spain | 678 | 775 | 97 | 14.3 |
| Sweden | 329 | 422 | 93 | 28.4 |
| United Kingdom | 1,809 | 2,092 | 283 | 15.6 |
* Pre-CETA refers to 2016. Post-CETA refers to the annual average trade value in 2018 and 2019.
Data: Statistics Canada
Source: Office of the Chief Economist, Global Affairs Canada
Canada increased its duty-free imports from all but three EU member states post-CETA. The largest increase in value were imports from Belgium which grew by more than $2 billion compared to 2016, mainly due to increased imports of tanks and armoured fighting vehicles, steroidal hormones, and light oils.
Table 12: Duty-free Imports by Canada from Individual EU Member States, in $Millions
| Member state | Pre-CETA* | Post-CETA* | Growth ($M) | Growth (%) |
|---|---|---|---|---|
| Austria | 1,631 | 1,997 | 365 | 22.4 |
| Belgium | 1,897 | 4,281 | 2,384 | 125.7 |
| Bulgaria | 83 | 132 | 48 | 58.1 |
| Croatia | 43 | 43 | 0 | -0.1 |
| Cyprus | 3 | 3 | 0 | -7.7 |
| Czechia | 432 | 658 | 227 | 52.5 |
| Denmark | 917 | 1,381 | 465 | 50.7 |
| Estonia | 156 | 159 | 3 | 1.7 |
| Finland | 774 | 1,089 | 315 | 40.7 |
| France | 4,222 | 5,703 | 1,481 | 35.1 |
| Germany | 11,719 | 13,719 | 2,001 | 17.1 |
| Greece | 154 | 164 | 10 | 6.6 |
| Hungary | 365 | 549 | 184 | 50.3 |
| Ireland | 1,783 | 2,830 | 1,047 | 58.7 |
| Italy | 4,594 | 5,610 | 1,017 | 22.1 |
| Latvia | 20 | 29 | 8 | 39.6 |
| Lithuania | 347 | 183 | -164 | -47.3 |
| Luxembourg | 143 | 152 | 9 | 6.1 |
| Malta | 44 | 32 | -13 | -28.3 |
| Netherlands | 3,384 | 4,093 | 709 | 20.9 |
| Poland | 1,502 | 1,789 | 288 | 19.2 |
| Portugal | 289 | 299 | 10 | 3.3 |
| Romania | 222 | 309 | 87 | 38.9 |
| Slovakia | 111 | 125 | 14 | 12.6 |
| Slovenia | 150 | 168 | 18 | 12.3 |
| Spain | 1,678 | 2,446 | 768 | 45.8 |
| Sweden | 1,725 | 1,908 | 182 | 10.6 |
| United Kingdom | 6,448 | 7,105 | 657 | 10.2 |
* Pre-CETA refers to 2016. Post-CETA refers to the annual average trade value in 2018 and 2019.
Data: Statistics Canada
Source: Office of the Chief Economist, Global Affairs Canada
Trade growth by preference marginsFootnote 4
Table 13 shows the growth in Canadian exports to the EU by preference margin. Products are divided into categories based on CETA tariff concessions in percentage points. Exports increased in all categories of preference margin. The group that was given between 5 and 10 percentage points of tariff reductions had the strongest growth of 40.6 percent. The next is the group with more than 10 percentage points of tariff reductions had the strongest growth at 40.6 percent. Next is the group that received more than 10 percentage points of tariff reductions with a 20.0 percent growth. Duty-free products also advanced as much as 27.8 percent.
Table 13: Canada’s Exports to the EU by Preference Margin, in $Millions
| Preference margin (percentage points) | Pre-CETA* | Post-CETA* | Growth($M) | Growth (%) |
|---|---|---|---|---|
| Duty-free | 28,145 | 35,963 | 7,818 | 27.8 |
| Between 0 and 5 | 9,700 | 9,934 | 234 | 2.4 |
| Between 5 and 10 | 1,357 | 1,907 | 550 | 40.6 |
| More than 10 | 912 | 1,095 | 183 | 20.0 |
| All affectedFootnote 5 | 11,969 | 12,936 | 967 | 8.1 |
| All non-affected | 28,383 | 36,434 | 8,051 | 28.4 |
| Total | 40,351 | 49,370 | 9,019 | 22.4 |
* Pre-CETA refers to 2016. Post-CETA refers to the annual average trade value in 2018 and 2019.
Data: Eurostat
Source: Office of the Chief Economist, Global Affairs Canada
Table 14 shows the growth in imports by Canada from the EU by preference margin. All categories of tariff reduction experienced increases in imports from the EU. The products that were given more than 10 percentage points of tariff reductions had the strongest growth at 24.8 percent. The next group is made up of products that received between 5 to 10 percentage points of tariff reductions, with 21.1 percent growth. Duty-free products also experienced a large increase of 27.0 percent.
Table 14: Canada’s Imports from the EU by Preference Margin, in $Millions
| Preference margin (percentage points) | Pre-CETA* | Post-CETA* | Growth($M) | Growth (%) |
|---|---|---|---|---|
| Duty-free | 44,837 | 56,954 | 12,117 | 27.0 |
| Between 0 and 5 | 8,281 | 9,004 | 723 | 8.7 |
| Between 5 and 10 | 6,147 | 7,443 | 1,296 | 21.1 |
| More than 10 | 1,600 | 1,996 | 397 | 24.8 |
| All affected | 16,027 | 18,442 | 2,415 | 15.1 |
| All non-affected | 44,840 | 56,956 | 12,116 | 27.0 |
| Total | 60,867 | 75,398 | 14,531 | 23.9 |
* Pre-CETA refers to 2016. Post-CETA refers to the annual average trade value in 2018 and 2019.
Data: Statistics Canada
Source: Office of the Chief Economist, Global Affairs Canada
Part Three: Utilization of CETA Preferences
Aggregate utilization for Canadian exports to the EU
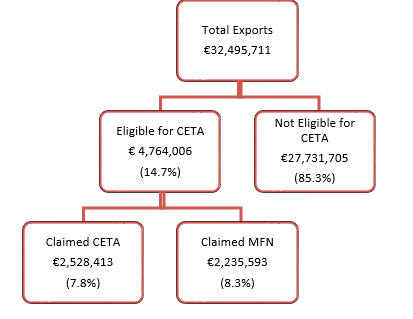
For Canadian exports to the EU, utilization dataFootnote 6 include information of the proportion of CETA-eligible exports entering the EU that claimed CETA preferential treatments. If the proportion of exports is compared to total exports, it is a coverage rate, not the utilization rate. Total Canadian exports in 2019 amounted to €32.5 billionFootnote 7; of which €4.7 billion (14.7 percent) were CETA-eligible and approximately €2.3 billion (or 53.1 percent of total CETA-eligible exports) entered the EU by claiming CETA preferential treatments (see breakdown in Figure 5). The utilization rate of CETA preferences for Canadian exports to the EU is therefore 53.1 percent in 2019, a modest increase over the 49.9 percent utilization rate observed in 2018.
Figure 5: Utilization Rates of CETA Preferences in Canadian Exports to the EU, 2019
Text version
| Value | Share | |
|---|---|---|
| Total exports, in thousand euros | €32,495,711 | |
| Eligible for CETA, in thousand euros | €4,764,006 | 14.7% |
| Not eligible for CETA, in thousand euros | €27,731,705 | 85.3% |
| Eligible for CETA and claimed CETA, in thousand euros | €2,528,413 | 7.8% |
| Eligible for CETA and claimed MFN, in thousand euros | €2,235,593 | 8.3% |
Data: EU DG Trade, Unit of the Office of Chief Economist
Source: Office of the Chief Economist, Global Affairs Canada
Table 15: Utilization Rates of CETA Preferences in Canadian Exports to the EU, 2018 and 2019
| Year | Utilization rate (%) |
|---|---|
| 2018 | 49.9 |
| 2019 | 53.1 |
Data: EU DG Trade, Unit of the Office of the Chief Economist
Source: Office of the Chief Economist, Global Affairs Canada
At the sector level, the utilization rate of CETA preferences varied vastly, from as high as 97.1 percent to as low as 0 percent. Table 16 shows the sectors with the highest utilization rates of CETA preferences in Canadian exports to the EU. As can be seen, the zinc and articles sector has the highest utilization rate at 97.1 percent. Other sectors with high utilization rates are mostly food and minerals.
Table 16: EU Sectors with the Highest CETA Utilization in Canadian Exports, 2019, in € Thousands
| HS02 | Sector | Total eligible exports | Eligible exports that used CETA | Utilization rate (%) |
|---|---|---|---|---|
| 79 | Zinc and articles | 9,501 | 9,223 | 97.1 |
| 46 | Manufactures of straw | 723 | 698 | 96.5 |
| 17 | Sugar and confectionery | 72,814 | 69,470 | 95.4 |
| 19 | Preparations of cereals | 44,057 | 41,833 | 95.0 |
| 03 | Fish and crustaceans | 346,386 | 327,570 | 94.6 |
| 20 | Preparations of vegetables and fruit | 60,408 | 56,482 | 93.5 |
| 36 | Explosives | 2,750 | 2,491 | 90.6 |
| 76 | Aluminum and articles | 256,982 | 228,352 | 88.9 |
| 27 | Mineral fuels and oils | 199,666 | 173,459 | 86.9 |
| 07 | Edible vegetables | 3,172 | 2,751 | 86.7 |
| 25 | Mineral salts | 4,110 | 3,525 | 85.8 |
| 72 | Iron and steel | 1,383 | 1,167 | 84.3 |
| 38 | Misc. chemical products | 99,761 | 83,803 | 84.0 |
| 28 | Inorganic chemicals | 27,379 | 22,646 | 82.7 |
| 21 | Misc. edible preparations | 74,286 | 61,353 | 82.6 |
Data: EU DG Trade, Unit of the Office of Chief Economist
Source: Office of the Chief Economist, Global Affairs Canada
Table 17 shows the EU sectors that have the lowest utilization rates of CETA preferences in Canadian exports. Four sectors had the lowest utilization rate (0.0 percent), including silk, gums and resins, raw hides and leather.
Table 17: EU Sectors with the Lowest CETA Utilization in Canadian Exports, 2019, in € Thousands
| HS02 | Sector | Total eligible exports | Eligible exports that used CETA | Utilization rate (%) |
|---|---|---|---|---|
| 05 | Products of animal origin | 0 | 0 | 0.0 |
| 50 | Silk | 19 | 0 | 0.0 |
| 13 | Gums and resins | 1 | 0 | 0.0 |
| 41 | Raw hides and leather | 439 | 0 | 0.0 |
| 37 | Photographic goods | 181 | 0 | 0.2 |
| 43 | Furskins | 2,750 | 14 | 0.5 |
| 45 | Cork and articles | 8 | 0 | 0.8 |
| 75 | Nickel and articles | 10,544 | 116 | 1.1 |
| 52 | Cotton | 832 | 11 | 1.3 |
| 91 | Clocks, watches and parts | 1,075 | 54 | 5.0 |
| 86 | Railway, locomotives and parts | 1,319 | 80 | 6.1 |
| 01 | Live animals | 1,710 | 110 | 6.5 |
| 74 | Copper and articles | 5,203 | 344 | 6.6 |
| 88 | Aircrafts and parts | 70,647 | 9,639 | 13.6 |
| 51 | Wool | 180 | 26 | 14.7 |
Data: EU DG Trade, Unit of the Office of the Chief Economist
Source: Office of the Chief Economist, Global Affairs Canada
Aggregate utilization for Canadian imports from the EU
Data on the utilization of CETA preferences for imports from the EU come from Statistics Canada, and include information of the proportion of affected imports entering Canada that claimed CETA preferential treatments and the proportion of imports that claimed MFN rates.
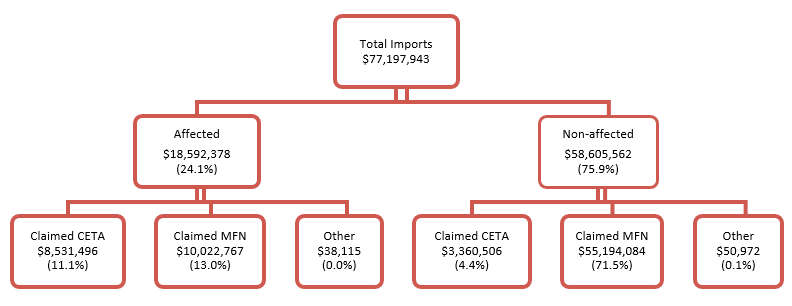
In 2019, total Canadian imports from the EU amounted to $77.2 billion, of which $18.6 billion (24.1 percent) were imports affected or covered by CETA and $58.6 billion (75.9 percent) were non-affected imports. Among affected imports, approximately $8.5 billion (45.9 percent of total affected imports) entered Canada by claiming CETA preferential treatment (see Figure 6 for breakdown). A small portion of non-affected imports, representing $3.4 billion (5.7 percent of total non-affected imports) also claimed CETA preferential treatment. The utilization rate of CETA preferences for Canadian imports in 2019 is therefore 45.9 percent; an increase of 8.8 percentage points compared to the 37.1 percent rate observed in 2018.
Figure 6: Utilization Rates of CETA Preferences for Canadian Imports from the EU, 2019
Text version
| Value | Share | |
|---|---|---|
| Total imports, in thousand dollars | $77,187,843 | |
| Affected by CETA, in thousand dollars | $18,592,378 | 24.1% |
| Affected by CETA and claimed CETA, in thousand dollars | $8,531,496 | 11.1% |
| Affected by CETA and claimed MFN, in thousand dollars | $10,022,767 | 13.0% |
| Affected by CETA and claimed other, in thousand dollars | $38,115 | 0.0% |
| Imports not affected by CETA, in thousand dollars | $58,605,562 | 75.9% |
| Not affected by CETA and claimed CETA, in thousand dollars | $3,360,506 | 4.4% |
| Not affected by CETA and claimed MFN, in thousand dollars | $55,194,084 | 71.5% |
| Not affected by CETA and claimed other, in thousand dollars | $50,972 | 0.0% |
Data: Statistics Canada
Source: Office of the Chief Economist, Global Affairs Canada
Table 18: Utilization Rates of CETA Preferences for Canadian Imports from the EU, 2018 and 2019
| Year | Utilization rate (%) |
|---|---|
| 2018 | 37.1 |
| 2019 | 45.9 |
Data: Statistics Canada
Source: Office of the Chief Economist, Global Affairs Canada
Table 19 shows the sectors with the highest utilization rates of CETA preferences for imports from the EU. As can be seen, the meat sector has the highest utilization rate at 99.0 percent. Other sectors with high utilization rates are also mostly food.
Table 19: Canadian Imports from the EU for Sectors with the Highest CETA Utilization, 2019, in $ Thousands
| HS02 | Sector | Total affected imports | Affected imports that used CETA | Utilization rate (%) |
|---|---|---|---|---|
| 02 | Meat | 56,882 | 56,317 | 99.0 |
| 19 | Preparations of cereals and flour | 344,589 | 319,416 | 92.7 |
| 18 | Cocoa and cocoa preparation | 288,495 | 263,249 | 91.2 |
| 08 | Edible fruit and nuts | 6,983 | 6,343 | 90.8 |
| 17 | Sugar and confectionery | 117,694 | 106,460 | 90.5 |
| 86 | Railway, locomotives and parts | 79,158 | 69,652 | 88.0 |
| 06 | Live trees and plants | 15,088 | 13,106 | 86.9 |
| 11 | Products of milling industry | 33,550 | 29,073 | 86.7 |
| 04 | Dairy produce and eggs | 302,210 | 259,365 | 85.8 |
| 68 | Articles of stone | 141,887 | 119,120 | 84.0 |
| 69 | Ceramic products | 277,348 | 230,064 | 83.0 |
| 03 | Fish and crustaceans | 1,056 | 862 | 81.7 |
| 40 | Rubber and articles | 460,757 | 354,463 | 76.9 |
| 21 | Misc. edible preparations | 169,522 | 130,325 | 76.9 |
| 46 | Coffee and tea | 1,324 | 971 | 73.3 |
Data: Statistics Canada
Source: Office of the Chief Economist, Global Affairs Canada
Table 20 shows Canadian import sectors that have the lowest utilization rates. Sectors with low utilization rates are largely textiles and mineral goods.
Table 20: Canadian Imports from the EU for Sectors with the Lowest CETA Utilization 2019, in $ Thousands
| HS02 | Sector | Total affected imports | Affected imports that used CETA | Utilization rate (%) |
|---|---|---|---|---|
| 58 | Special woven fabrics | 19 | 0 | 0.0 |
| 10 | Cereals | 16 | 0 | 1.4 |
| 75 | Nickel and articles | 20,086 | 442 | 2.2 |
| 88 | Aircrafts and parts | 3,455 | 141 | 4.1 |
| 30 | Pharmaceutical products | 926 | 65 | 7.1 |
| 90 | Medical instruments | 140,670 | 21,151 | 15.0 |
| 24 | Tobacco and substitutes | 28,440 | 4,591 | 16.1 |
| 37 | Photographic goods | 2,100 | 399 | 19.0 |
| 87 | Motor vehicles and parts | 7,758,213 | 1,838,245 | 23.7 |
| 79 | Zinc and articles | 2,449 | 618 | 25.2 |
| 07 | Edible vegetables | 1,718 | 474 | 27.6 |
| 54 | Man-made filaments | 31 | 9 | 27.7 |
| 59 | Industrial use coated textiles | 13,081 | 3,848 | 29.4 |
| 74 | Copper and articles | 9,438 | 2,961 | 31.4 |
| 38 | Misc. chemical products | 14,204 | 4,626 | 32.6 |
Data: Statistics Canada. Source: Office of the Chief Economist, Global Affairs Canada
Utilization of CETA preferences for Canadian exports to the EU across countries and sectors
Utilization of CETA preferences for Canadian exports to the EU varies considerably among individual EU member states. Denmark, Ireland and the Netherlands are the three member states that utilized CETA preferences the most, with utilization rates of 86.8, 85.5, and 78.3 percent, respectively. On the opposite end are Malta, Lithuania and Croatia, which have low utilization rates of 2.9, 8.0 and 15.2 percent, respectively.
Table 21: Utilization of CETA Preferences for Canadian Exports by EU Member State, 2019, in € Thousands
| Member state | Total exports | Eligible exports | Eligible exports that used CETA | Utilization rate (%) |
|---|---|---|---|---|
| Austria | 278,703 | 42,261 | 13,922 | 32.9 |
| Belgium | 3,133,157 | 291,888 | 175,051 | 60.0 |
| Bulgaria | 44,271 | 17,291 | 9,124 | 52.8 |
| Croatia | 20,444 | 10,345 | 1,621 | 15.7 |
| Cyprus | 12,021 | 2,310 | 992 | 42.9 |
| Czechia | 298,534 | 63,564 | 31,252 | 49.2 |
| Denmark | 215,314 | 140,330 | 121,860 | 86.8 |
| Estonia | 49,178 | 8,071 | 4,965 | 61.5 |
| Finland | 568,050 | 102,285 | 59,867 | 58.5 |
| France | 2,624,069 | 385,137 | 231,781 | 60.2 |
| Germany | 4,712,871 | 1,257,878 | 386,490 | 30.7 |
| Greece | 84,648 | 15,855 | 7,563 | 47.7 |
| Hungary | 71,767 | 20,777 | 8,015 | 38.6 |
| Ireland | 527,125 | 139,353 | 119,123 | 85.5 |
| Italy | 1,747,300 | 227,354 | 108,184 | 47.6 |
| Latvia | 598,227 | 7,234 | 1,627 | 22.5 |
| Lithuania | 17,115 | 9,905 | 795 | 8.0 |
| Luxembourg | 97,839 | 30,422 | 17,491 | 57.5 |
| Malta | 80,820 | 1,262 | 36 | 2.9 |
| Netherlands | 2,876,713 | 753,669 | 590,268 | 78.3 |
| Poland | 258,305 | 44,284 | 19,340 | 43.7 |
| Portugal | 131,307 | 28,194 | 13,840 | 49.1 |
| Romania | 70,164 | 25,024 | 9,226 | 36.9 |
| Slovakia | 84,017 | 13,469 | 7,097 | 52.7 |
| Slovenia | 113,764 | 5,499 | 3,041 | 55.3 |
| Spain | 1,383,732 | 219,749 | 133,658 | 60.8 |
| Sweden | 374,995 | 118,900 | 61,842 | 52.0 |
| United Kingdom | 14,371,375 | 781,704 | 390,286 | 49.9 |
Data: EU DG Trade, Unit of the Office of the Chief Economist
Source: Office of the Chief Economist, Global Affairs Canada
Utilization of CETA preferences for Canadian exports to the EU at the sectoral level varied widely by member states. Table 22 shows the sectors with the most CETA-eligible Canadian exports to the EU. Eligible exports from these sectors made up 88.5 percent of all CETA-eligible exports from Canada to the EU.
Table 22: Sectors with the Largest CETA-eligible Exports to the EU, 2019, in € Thousands
| HS 02 | Sector | Eligible exports | Eligible exports that used CETA | Utilization rate (%) |
|---|---|---|---|---|
| 84 | Machinery | 1,181,668 | 372,925 | 31.6 |
| 85 | Electronics | 408,670 | 158,139 | 38.7 |
| 87 | Motor vehicles and parts | 391,138 | 122,797 | 31.4 |
| 03 | Fish and crustaceans | 346,386 | 327,570 | 94.6 |
| 39 | Plastics and articles | 288,931 | 181,739 | 62.9 |
| 76 | Aluminum and articles | 256,982 | 228,352 | 88.9 |
| 27 | Mineral fuels and oils | 199,666 | 173,459 | 86.9 |
| 73 | Articles of iron or steel | 145,772 | 57,371 | 39.4 |
| 90 | Medical instruments | 112,858 | 27,137 | 24.0 |
| 16 | Preparations of meat or fish | 108,102 | 82,392 | 76.2 |
| 38 | MIsc. chemical products | 99,761 | 83,803 | 84.0 |
| 29 | Organic chemicals | 86,454 | 43,803 | 50.7 |
| 62 | Articles of apparel, not knitted | 83,513 | 50,727 | 60.7 |
| 21 | Misc. edible preparations | 74,286 | 61,353 | 82.6 |
| 17 | Sugar and confectionery | 72,814 | 69,470 | 95.4 |
| 61 | Articles of apparel, knitted | 70,746 | 52,851 | 74.7 |
| 88 | Aircrafts and parts | 70,647 | 9,639 | 13.6 |
| 20 | Preparations of vegetables | 60,408 | 56,482 | 93.5 |
| 19 | Preparations of cereals | 44,057 | 41,833 | 95.0 |
| 95 | Toys | 43,940 | 23,568 | 53.6 |
Data: EU DG Trade, Unit of the Office of the Chief Economist
Source: Office of the Chief Economist, Global Affairs Canada
As can be seen, some sectors have relatively high utilization rates (more than 80 percent), while others have utilization rates of less than 30 percent. All three top sectors in terms of CETA-eligible exports have only around 30 percent CETA utilization, even though their total eligible exports were more than $1.8 billion. Total savings on tariffs if these sectors had otherwise fully utilized CETA preferential rates could have been massive.
Tables 23 to 25 focus on the first three sectors and show utilization rates of CETA preferences across countries within each sector. There is no clear pattern of how member states utilize CETA preferential rates; however, certain member states and sectors seem to be consistently under-utilizing CETA even when more savings could have been achieved.
In the machinery sector (HS 84), Germany and the UK received 52.6 percent and 11.4 percent of total eligible exports from Canada, yet their utilization rates are only 19.1 percent and 28.7 percent, respectively. Considering that the average preference margin on exports to the EU for HS 84 is approximately 1.8 percent, if these two member states had fully utilized CETA (if all €755.0 million of CETA-eligible exports to these two states had utilized the tariff savings of 1.8 percent), the total gain from tariff reductions would have been €10.8 million largerFootnote 8.
Table 23: Utilization of CETA for Exports of the Machinery Sector, 2019, in € Thousands
| Member state | Share in EU eligible exports (%) | CETA-eligible exports | Eligible exports that used CETA | Utilization rate (%) |
|---|---|---|---|---|
| Germany | 52.6 | 620,997 | 118,521 | 19.1 |
| United Kingdom | 11.4 | 134,988 | 38,741 | 28.7 |
| Belgium | 4.6 | 53,927 | 30,972 | 57.4 |
| Italy | 4.4 | 51,495 | 16,304 | 31.7 |
| Netherlands | 4.4 | 52,064 | 23,294 | 44.7 |
| Other | 22.6 | 268,196 | 145,092 | 0.0 – 84.8 |
Data: EU DG Trade, Unit of the Office of the Chief Economist
Source: Office of the Chief Economist, Global Affairs Canada
In the electronics sector (HS 85), Germany, the UK and the Netherlands accounted for 31.4 percent, 18.2 percent and 12.9 percent, respectively, of total eligible exports from Canada. Their utilization rates are 43.6, 23.4 and 51.5 percent, respectively. Considering that the average preference margin on exports to the EU for HS 85 is approximately 1.5 percent, if these three member states had fully utilized CETA preferences (if all €255.0 million of CETA-eligible exports to these three states had utilized the tariff savings of 1.5 percent), the total tariff saving could have been €2.3 million larger.
Table 24: Utilization of CETA for Exports of the Electronics Sector, 2019, in € Thousands
| Member state | Share in EU eligible exports (%) | CETA-eligible exports | Eligible exports that used CETA | Utilization rate (%) |
|---|---|---|---|---|
| Germany | 31.4 | 128,451 | 56,051 | 43.6 |
| United Kingdom | 18.2 | 74,239 | 17,398 | 23.4 |
| Netherlands | 12.9 | 52,881 | 27,256 | 51.5 |
| France | 8.3 | 33,736 | 16,185 | 48.0 |
| Italy | 6.7 | 27,197 | 3,202 | 11.8 |
| Other | 22.5 | 92,166 | 38,046 | 0.0 – 71.9 |
Data: EU DG Trade, Unit of the Office of the Chief Economist
Source: Office of the Chief Economist, Global Affairs Canada
In the motor vehicles and parts sector, Germany, Belgium, the UK and Finland took in 32.8 percent, 14.6 percent, 13.1 percent and 12.8 percent of total eligible exports, respectively. Their utilization of CETA preferences varied widely, with only 5.2 percent for Germany, but 39.8 percent for Belgium, 65.9 percent for the UK, and 66.8 percent for Finland. A more in-depth examination of the composition of exports may be needed to better explain the large variations observed in CETA preferences utilization. However, considering that the average preference margin on exports to the EU for HS 87 is approximately 5.2 percent, if these member states had fully utilized CETA (if all €286.0 million of CETA-eligible exports had utilized the tariff savings of 5.2 percent), the total tariff saving could have been €10.5 million larger.
Table 25: Utilization of CETA for Exports of the Motor Vehicles and Parts Sector, 2019, in € Thousands
| Member state | Share in EU eligible exports (%) | CETA-eligible exports | Eligible exports that used CETA | Utilization rate (%) |
|---|---|---|---|---|
| Germany | 32.8 | 128,239 | 6,626 | 5.2 |
| Belgium | 14.6 | 56,979 | 22,664 | 39.8 |
| United Kingdom | 13.1 | 51,094 | 33,681 | 65.9 |
| Finland | 12.8 | 50,195 | 33,522 | 66.8 |
| Netherlands | 4.5 | 17,695 | 1,692 | 9.6 |
| Other | 22.2 | 86,937 | 24,613 | 0.0 – 72.6 |
Data: EU DG Trade, Unit of the Office of the Chief Economist
Source: Office of the Chief Economist, Global Affairs Canada
Utilization of CETA preferences for Canadian imports from the EU across countries and sectors
Table 26: Utilization Rates of CETA Preferences for Canadian Imports from EU Member States, 2019, in $ Thousands
| Member state | Total imports | Affected imports | Affected imports that used CETA | Utilization rate (%) |
|---|---|---|---|---|
| Austria | 2,284,241 | 221,813 | 70,630 | 31.8 |
| Belgium | 4,963,122 | 518,135 | 347,181 | 67.0 |
| Bulgaria | 199,488 | 61,901 | 24,784 | 40.0 |
| Croatia | 70,773 | 28,681 | 21,479 | 74.9 |
| Cyprus | 4,687 | 1,922 | 1,754 | 91.3 |
| Czechia | 817,844 | 154,931 | 88,008 | 56.8 |
| Denmark | 1,550,984 | 145,325 | 107,909 | 74.3 |
| Estonia | 123,653 | 12,449 | 8,013 | 64.4 |
| Finland | 1,064,202 | 94,256 | 66,241 | 70.3 |
| France | 8,687,800 | 2,377,347 | 1,237,466 | 52.1 |
| Germany | 19,224,431 | 5,200,692 | 1,460,832 | 28.1 |
| Greece | 279,934 | 113,631 | 69,741 | 61.4 |
| Hungary | 921,263 | 345,353 | 63,863 | 18.5 |
| Ireland | 3,019,230 | 176,122 | 117,818 | 66.9 |
| Italy | 9,452,564 | 3,644,145 | 2,347,736 | 64.4 |
| Latvia | 47,057 | 19,038 | 3,874 | 20.3 |
| Lithuania | 266,282 | 58,529 | 24,482 | 41.8 |
| Luxembourg | 164,969 | 11,413 | 2,618 | 22.9 |
| Malta | 34,420 | 3,300 | 1,336 | 40.5 |
| Netherlands | 4,663,742 | 497,852 | 199,897 | 40.2 |
| Poland | 2,338,235 | 441,517 | 172,684 | 39.1 |
| Portugal | 657,626 | 348,409 | 251,854 | 72.3 |
| Romania | 467,864 | 178,967 | 99,672 | 55.7 |
| Slovakia | 724,977 | 603,346 | 242,097 | 40.1 |
| Slovenia | 212,010 | 34,784 | 23,659 | 68.0 |
| Spain | 3,477,458 | 784,587 | 548,642 | 69.9 |
| Sweden | 2,287,150 | 352,698 | 271,329 | 76.9 |
| United Kingdom | 9,191,936 | 2,161,233 | 655,897 | 30.3 |
Data: Statistics Canada
Source: Office of the Chief Economist, Global Affairs Canada
Table 27 shows the sectors with the largest affected imports in Canada from the EU. Affected imports from these sectors made up 87.0 percent of all affected imports that entered Canada from the EU. The aggregate utilization rate ranges from 23.7 percent to 92.7 percent. The motor vehicles and parts sector by itself made up as much as 41.7 percent of total affected imports and yet has the lowest CETA utilization among those sectors with largest affected imports.
Table 27: Sectors with the Largest Affected Imports in Canada, 2019, in $ Thousands
| HS 02 | Sector | Affected Imports | Affected Imports that used CETA | Utilization rate (%) |
|---|---|---|---|---|
| 87 | Motor vehicles and parts | 7,758,213 | 1,838,245 | 23.7 |
| 22 | Beverages | 1,626,110 | 1,133,009 | 69.7 |
| 33 | Essential oils and cosmetics preparations | 1,026,636 | 568,277 | 55.4 |
| 94 | Furniture | 624,440 | 254,994 | 40.8 |
| 64 | Footwear | 507,723 | 364,545 | 71.8 |
| 62 | Articles of apparel, not knitted | 473,149 | 247,628 | 52.3 |
| 42 | Articles of leather | 463,981 | 235,248 | 50.7 |
| 40 | Rubber and articles | 460,757 | 354,463 | 76.9 |
| 39 | Plastics and articles | 424,146 | 212,388 | 50.1 |
| 19 | Preparations of cereals | 344,589 | 319,416 | 92.7 |
| 61 | Articles of apparel, knitted | 327,399 | 191,301 | 58.4 |
| 71 | Precious stones and metals | 309,267 | 168,376 | 54.4 |
| 85 | Electronics | 306,508 | 148,216 | 48.4 |
| 04 | Dairy produce and eggs | 302,210 | 259,365 | 85.8 |
| 18 | Cocoa and preparations | 288,495 | 263,249 | 91.2 |
| 69 | Ceramic products | 277,348 | 230,064 | 83.0 |
| 89 | Ships and boats | 267,925 | 110,894 | 41.4 |
| 20 | Preparations of vegetables | 230,728 | 165,885 | 71.9 |
| 73 | Articles of iron or steel | 228,375 | 102,902 | 45.1 |
| 34 | Soap and washing preparations | 197,738 | 109,520 | 55.4 |
Data: Statistics Canada
Source: Office of the Chief Economist, Global Affairs Canada
Tables 28 to 30 focus on the first three sectors and show the share of affected imports from EU member states, with the CETA utilization rate. Again, there is no clear pattern as to how CETA preferential rates were utilized; however, imports from certain member states are consistently under-utilizing CETA preferences.
In the motor vehicles and parts sector (HS 87), Canada imported from Germany and the UK respectively about 48.2 percent and 18.0 percent of total affected imports, but the utilization rates for these imports are only 17.0 percent and 13.2 percent. Considering that the average preference margin on imports from the EU for HS 87 is approximately 5.6 percent, if imports from these two member states had fully utilized CETA preferences (if all $5.0 billion of affected imports had claimed CETA preferential rates), then the total savings from tariff reductions could have been $241.0 million largerFootnote 9.
Table 28: Utilization of CETA for Imports of the Motor Vehicles and Parts Sector, 2019, in $ Thousands
| Member state | Share in affected imports (%) | Affected imports | Affected imports that used CETA | Utilization rate (%) |
|---|---|---|---|---|
| Germany | 48.2 | 3,737,420 | 633,502 | 17.0 |
| United Kingdom | 18.0 | 1,397,495 | 184,355 | 13.2 |
| Slovakia | 7.0 | 543,442 | 207,395 | 38.2 |
| France | 6.2 | 483,130 | 19,838 | 4.1 |
| Italy | 5.4 | 420,690 | 274,024 | 65.1 |
| Other | 15.2 | 1,176,037 | 519,133 | 0.2 – 93.3 |
Data: Statistics Canada
Source: Office of the Chief Economist, Global Affairs Canada
In the beverages sector (HS 22), imports by Canada from France and Italy accounted for 34.7 percent and 32.0 percent of total affected imports, respectively. Utilization rates for these imports are higher, 72.7 percent and 65.7 percent, respectively. The higher utilization rate may be an indication that imports fulfill the rule of origin requirements, most likely due to the fact that beverages, in particular wine, have fewer components from different sources. Considering that the average preference margin on imports from the EU for HS 22 is approximately 12.0 percent, if imports from these two member states had fully utilized CETA (if all $1.1 billion affected imports from these two member states had claimed CETA preferential rates), then total savings from tariff reductions could have been an additional $40.2 million.
Table 29: Utilization of CETA for Imports of the Beverages Sector, 2019, in $ Thousands
| Member state | Share in affected imports (%) | Affected imports | Affected imports that used CETA | Utilization rate (%) |
|---|---|---|---|---|
| France | 34.7 | 563,788 | 370,407 | 72.7 |
| Italy | 32.0 | 520,027 | 378,157 | 65.7 |
| Spain | 8.1 | 132,169 | 94,387 | 71.4 |
| United Kingdom | 6.1 | 99,046 | 76,614 | 77.4 |
| Ireland | 4.7 | 76,433 | 61,852 | 80.9 |
| Other | 14.4 | 234,647 | 151,592 | 0.0 – 100.0 |
Data: Statistics Canada
Source: Office of the Chief Economist, Global Affairs Canada
In the essential oils and cosmetic preparations sector (HS 33), imports by Canada from France, Italy and the UK accounted for 44.4 percent, 22.7 percent and 11.6 percent of total affected imports, respectively. Utilization rates for these imports are 65.5 percent, 36.5 percent and 68.3 percent, respectively. Considering that the average preference margin on imports from the EU for HS 33 is approximately 6.3 percent, if imports from these three member states had fully utilized CETA (if all $817.0 million imports had claimed the CETA preferential rate), then total savings from tariff reductions would have been $21.6 million higher.
Table 30: Utilization of CETA for Imports of the Essential Oils and Cosmetic Preparations Sector, 2019, in $ Thousands
| Member state | Share in affected imports (%) | Affected imports | Affected imports that used CETA | Utilization rate (%) |
|---|---|---|---|---|
| France | 44.4 | 456,021 | 298,767 | 65.5 |
| Italy | 22.7 | 233,530 | 85,299 | 36.5 |
| United Kingdom | 11.6 | 118,657 | 80,993 | 68.3 |
| Germany | 8.5 | 87,469 | 37,447 | 42.8 |
| Spain | 3.9 | 40,086 | 18,027 | 45.0 |
| Other | 8.9 | 90872 | 47744 | 3.6 – 99.3 |
Data: Statistics Canada
Source: Office of the Chief Economist, Global Affairs Canada
Conclusion
For the two full years since CETA has been implemented, bilateral trade has shown impressive gains. Canadian merchandise exports to the EU averaged $46.6 billion annually, up 16.6 percent from 2016. At the same time, merchandise imports from the EU rose 24.1 percent. Products exported to the EU that received tariff concessions under CETA grew by 8.1 percent compared to 2016, while duty-free products also grew by an impressive 27.8 percent.
Utilization of CETA preferences showed moderate improvement in the second year of implementation of the agreement. The utilization rate for Canadian exports to the EU that were eligible for CETA preferences and claimed the preferences was 53.1 percent in 2019, up from 49.9 percent in 2018. On the other hand, the utilization of CETA preferences for Canadian imports from the EU improved noticeably, going from 37.1 percent in 2018 to 45.9 percent in 2019.
Nevertheless, utilization of CETA preferences for Canadian exports to the EU varied widely by country and by sector. About 86.8 percent of Canadian exports to Denmark that were eligible for CETA preferences claimed these preferences; yet only 30.7 percent of eligible Canadian exports to Germany utilized CETA preferences.
Even within a given sector, such as motor vehicles and parts, CETA preferences utilization for Canadian exports can vary considerably. Utilization of CETA for Canadian exports to the UK in this sector was high (65.9 percent), while the utilization rate for Canadian exports to Germany in the same sector was only 5.2 percent.
- Date Modified: