This is a past issue of the State of Trade. For the latest report, please visit Canada’s State of Trade reports.
ISSN 2562-8321

Canada's State of Trade 2019
20th Edition
About this document
This report provides a comprehensive summary of the main developments in Canada’s commercial activities during the previous year. It describes the events that took place in the global economy and trade in 2018, the main developments in Canada’s economy and those of its most important partner economies and regions. It reports the developments in Canada’s trade in goods and services, as well as flows and stocks of foreign direct investment and Canadian direct investment abroad.
A special chapter is dedicated to Canada’s trade diversification effort, its importance, evolution and prospects, as well as the different dimensions of trade diversification. In addition, the chapter describes various potential paths for further diversification, by summarizing the numerous research and analyses undertaken by the Office of the Chief Economist at Global Affairs Canada and elsewhere.
Copyrights
Cette publication est aussi disponible en français sous le titre : Le point sur le commerce 2019 – 20e édition
Information contained in this publication or product may be reproduced, in part or in whole, and by any means, for personal or public non-commercial purposes without charge or further permission, unless otherwise specified. Commercial reproduction and distribution are prohibited except with written permission from Global Affairs Canada.
For more information, contact:
Global Affairs Canada
125 Sussex Drive
Ottawa ON K1A 0G2
Canada
Website: www.international.gc.ca
Email: info@international.gc.ca
© Her Majesty the Queen in Right of Canada, as represented by Global Affairs Canada, 2019.
Cat. No.: FR2-8E-PDF
ISSN: 2562-8321
Table of Contents
- Message from the Minister
- Executive Summary
- Part 1.0 Global performance highlights
- Part 2.0 Canada’s performance highlights
- Part 3.0 Diversifying Canadian exports

As Canada’s Minister of International Trade Diversification, I am delighted to present the 20th annual edition of the State of Trade Report for 2019.
Trade has been at the centre of the world’s attention during the past year. Globally, trade tensions, tariffs and uncertainty among many economies led to weaker economic growth and a slight slowdown in merchandise trade growth last year. However, in the midst of all this turbulence, Canada’s exports and imports both rose in 2018, with the total value of trade in goods and services reaching a record high of $1.5 trillion.
More trade and investment means more economic growth and good-paying jobs to help further strengthen Canada’s middle class. While Canadian investment flows abroad fell, total inflows of foreign direct investment into Canada increased by 70% to $55 billion.
This year’s State of Trade Report reflects our government’s efforts to expand and diversify Canada’s trade and investment and build bridges to dynamic markets. While the United States continues to be our most important trading partner, trade with other countries grew at a quicker pace. This bodes well for expanding global partnerships.
Diversification abroad means not only expanding our trading efforts with all regions, but also taking advantage of opportunities in emerging sectors. At home, diversification means making sure all regions of Canada and all members of our society can compete and succeed on international markets. Canada has led the way in advancing gender equality and women’s empowerment through our international engagement. Our government is also playing a leading role in helping more Indigenous people, members of the LGBTQ2+ community and youth succeed in today’s economy.
The 2019 State of Trade Report highlights results for both women- and Indigenous-owned exporting businesses: the numbers are very encouraging, with gains from trade spreading throughout Canada to all Canadians.
We strongly support free trade as a means to open foreign markets to Canadian goods and services, grow Canadian businesses, create good-paying jobs and contribute to middle-class prosperity. For this reason, we are working on increasing our overseas exports by 50% by 2025
The numbers for small and medium-sized businesses (SMEs) exporting goods and services outside of Canada show the most potential for expansion. As part of Canada’s trade diversification strategy, we want to help SMEs navigate international markets and capitalize on market access gains achieved under Canada’s trade agreements.
Canada currently has 14 free trade agreements in force with 51 countries, totalling a combined gross domestic product of US$52 trillion. When the Comprehensive and Progressive Agreement for Trans-Pacific Partnership (CPTPP) came into force at the end of last year, Canada became the only G7 country with free trade links to all of the other partners. The impacts of the CPTPP as well as the Canada-European Union Comprehensive Economic and Trade Agreement (CETA) are highlighted in this report. For both agreements, the report shows Canadian exports expanding after they came into force.
Our approach is to ensure that increased trade and investment and our trade diversification strategy support meaningful and sustainable growth for Canadian citizens, businesses and communities.
The Honourable Jim Carr, Minister of International Trade Diversification

Executive summary
After a period of broad-based and synchronized growth that lasted throughout 2017 and into early 2018, the global economy started to ease up. Global trade tensions combined with waning cyclical forces reduced economic momentum worldwide. Deceleration was widespread, even in countries like China and India. A notable exception was the United States, where tight labour market conditions and broad-based expansion bolstered the economy.
Against this backdrop of weaker economic growth, the expansion in global merchandise trade volumes slowed across both developed and emerging markets. Global merchandise trade value grew 10% in 2018, a slight slowdown from the 11% increase in the previous year. However, annual world merchandise trade still grew faster than at any time between 2012 and 2016, and global commercial services trade expanded by 7.4% in 2018, a little more than an extra one percentage point over 2017.
This backdrop coupled with global trade tensions, political uncertainty and U.S. tax reforms had an important impact on global foreign direct investment (FDI) flows. FDI flows declined by 13% in 2018, with developed European economies experiencing the largest regional decrease at 55%.
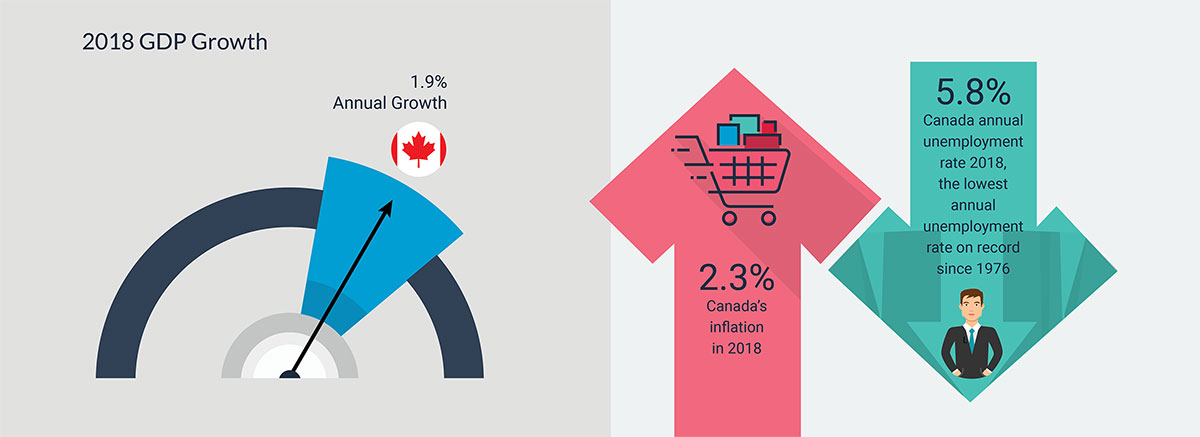
As with most major economies, Canada’s growth cooled to 1.9% in 2018, after reaching 3% in 2017. A major factor was the slowdown in household consumption growth, weighed down by household debt. Non-residential business investment made a very small positive contribution, while residential investment negatively impacted growth due to tighter mortgage guidelines. An acceleration in the growth of real exports along with a deceleration in real imports allowed trade to contribute marginally to growth in 2018, after being a drag in 2017. The Canadian labour market continued to display tight conditions, with the annual unemployment rate (5.8%) reaching record lows dating back to at least 1976, while inflation stood at 2.3% for 2018, its highest level since 2011.
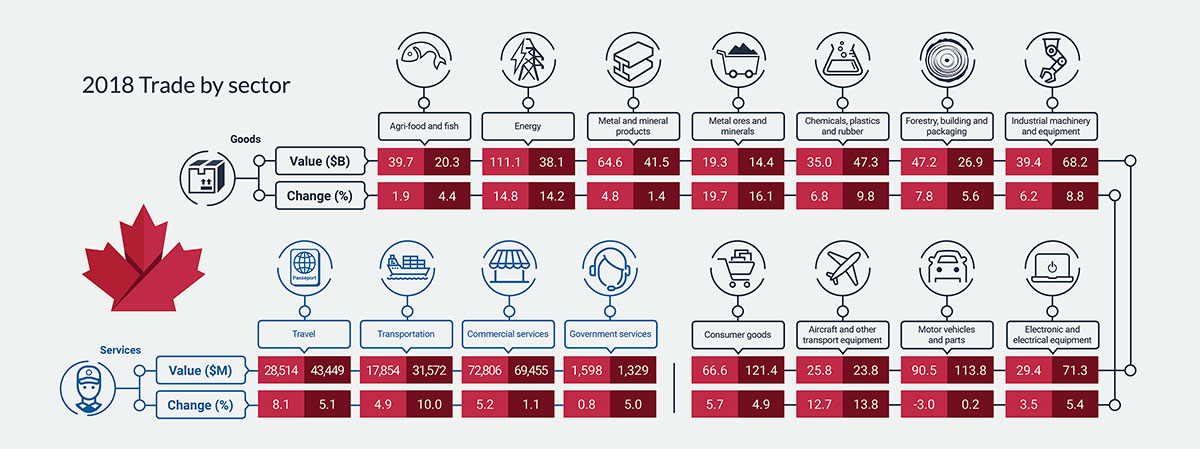
On the trade front, Canada’s exports of goods and services increased 6.2% in 2018, while imports rose 5.4%. The total value of trade in goods and services reached a record high of $1.5 trillion. Canada’s goods exports played an important role in the increase, growing at 6.5% in 2018 to reach $585 billion. Energy led the way, advancing $14 billion (15%) to $111 billion, followed by consumer goods ($3.6 billion) and forestry, building and packaging products ($3.4 billion). By destination, goods exports to the United States climbed 5.4% to $433 billion in 2018. However, exports to non-U.S. destinations grew even faster, up 9.8% to $153 billion. Canadian services exports grew for the ninth consecutive year, up 5.8% to $121 billion.
Canada’s goods imports rose 5.8% to $607 billion in 2018, with increases in all sectors, led by metal ores and minerals, energy products, and aircraft and other transportation equipment. Regionally, goods imports from the United States were up 5.4% to $391 billion in 2018, while imports from non-U.S. sources grew 6.5% to $216 billion. Since Canadian goods exports expanded at a faster rate than Canadian goods imports, the goods trade deficit narrowed by $2.7 billion to $22 billion. Services imports expanded by 4.2% to reach $146 billion. Canada continued to run a services trade deficit with every broad region and most major trading partners; nearly half of the deficit was due to the United States.
Total inflows of FDI into Canada for 2018 increased by 70% to $55 billion, in contrast to the decrease experienced by most other developed economies, due to a $24-billion increase in FDI from non-U.S. sources. Strong inflows of investment in Canada’s manufacturing sector (+45%) made up for declines in trade and transportation (-41%) and finance and insurance (-13%).
By contrast, Canadian direct investment abroad (i.e. FDI from Canada to other countries) fell by 38% to $64 billion, notably due to investment in the United States contracting by 60%. CDIA flows to the rest of the world increased by 48% or $10 billion. Overall, Canadian investors favoured the energy and mining, and manufacturing sectors, which were up by $13 billion and $10 billion, respectively.
Looking forward, continued weakness in Western Canada’s resource sector, elevated household debt, and a backlash against trade and globalization are factors that could dampen Canadian economic, trade, and investment growth. However, the Bank of Canada expects economic growth to pick up in the second half of 2019 and be sustained into 2020.
Whether the global economic context is stable or uncertain, having multiple export destinations and/or many different products to export can certainly help Canadian companies prosper by hedging risk and taking advantage of high-growth markets. This year’s State of Trade report also takes stock of research undertaken by the Office of the Chief Economist on trade diversification, both in its conventional sense as well as from the angle of diversity among exporter firms. It also features results from Export Development Canada’s research.
In terms of geographic diversification (e.g. destinations of exports), Canada has room to further diversify, as Canadian exports are currently considered to be concentrated. In fact, data show that Canada’s exports are the fourth most concentrated by destination out of 113 countries, principally due to a large share of exports going to the United States. This is not particularly surprising given Canada’s close trade connections with its Southern neighbour. Recognizing the country’s high export concentration, the federal government has set a target of increasing Canada’s overseasFootnote 1 exports by 50% to $284 billion by 2025. This objective requires an annual average growth rate of 5.2% from 2017, which is higher than the trend from recent years (2011-2017).
Free trade agreements (FTAs) are one way the government can help and encourage Canadian exporters to diversify into new markets as FTAs open opportunities by reducing trade barriers such as tariffs, quotas, and non-tariff barriers. Analysis shows Canadian exports increase after FTAs come into effect, especially for products benefiting from higher tariff declines. While Canada already has an extensive list of FTA partners,Footnote 2 signing new agreements and deepening existing FTAs could help further diversify Canadian trade, particularly in faster-growing emerging markets. Preliminary research results indicate that a one percentage point increase in the growth rate of an import market caused the level of Canadian exports to expand by 0.11%, with an additional gain of 0.16% if Canada was already active in that market prior to the growth. That said, encouraging Canadian firms to first export to emerging markets may not always be appropriate. A large majority of new exporters start with the U.S. and only later expand beyond that market. It is estimated that 20% of exporters to the United States expand or move into new markets each year on average. Therefore, encouraging firms to explore overseas markets might require them to first test the waters of the closer and more familiar U.S. market. Incidentally, some sixteen American cities are projected to be among the top 40 cities worldwide for Canadian business opportunities by 2030.
Although some traditional destinations will remain, the ways firms can sell their goods and services are changing with the Internet and digital technologies. Digital technologies facilitate transactions and reduce costs, for example, by optimizing route planning, reducing storage time, and improving distribution networks. Such improvements reduce the distance barrier for exporters. On the other hand, the Internet is increasingly being exploited for cross-border delivery of digital products.
Encouraging the use of these technologies could further advance the diversification agenda. This could be particularly important for small and medium-sized enterprises (SMEs). Despite accounting for 99.8% of employer businesses and 89% of all private-sector jobs, only 12% of SMEs exported goods and services outside of Canada. Government programs aimed at helping SMEs navigate international markets could be another way to reach Canada’s 2025 overseas exports exports goal.
As mentioned above, diversity in who exports is also worth paying attention to. Diversification in ownership of Canadian exporters is important to ensure that gains from trade are spread throughout Canada to all Canadians. One dimension is women-owned exporting firms. Research shows that the proportion of women-owned exporting SMEs in Canada doubled from 7.4% of all SME exporters in 2011 to 15% in 2017. Furthermore, within women-owned SMEs in Canada, the share of firms that export rose from 8.4% in 2014 to 11% in 2017. The other ownership dimension explored is that of Indigenous-owned exporters. The results of a survey of Indigenous entrepreneurs show that in 2014, the proportion of Indigenous exporting SMEs was twice that of Canadian non-Indigenous exporting SMEs—24% versus 12%, respectively. Diversity thus exists within the exporting community and this diversity is slowly growing.
Diversification hedges risks from shocks to Canada from abroad and allows Canadian businesses to take advantage of opportunities in fast-growing markets. There are various avenues to greater geographical diversification. These include using free trade agreements to give Canadian exporters better access to foreign markets; accessing fast-growing markets early; using the U.S. market as a stepping stone to overseas markets; leveraging digital technologies; increasing SME participation in international trade; and focusing on the future growth of cities to identify new export opportunities. Moreover, the gains from trade can be spread more evenly throughout Canada, notably through diversification of exporter ownership.


Global performance highlights
Global economic performance

At a
glance

Long description
2018 economic indicators for selected regions and economies
| GDP Growth (%) | Unemployment (%) | Real Exports Growth* (%) | Real Imports Growth* (%) | |
|---|---|---|---|---|
| Advanced Economies | ||||
| Canada | 1.8 | 5.8 | 3.3 | 2.9 |
| Japan | 0.8 | 2.4 | 3.1 | 3.2 |
| United Kingdom | 1.4 | 4.1 | 0.1 | 0.7 |
| United States | 2.9 | 3.9 | 3.9 | 4.6 |
| France | 1.5 | 9.1 | 3.0 | 1.2 |
| Germany | 1.5 | 3.4 | 2.2 | 3.4 |
| Italy | 0.9 | 10.6 | 1.9 | 2.3 |
| Emerging Markets and Developing Economies | ||||
| Brazil | 1.1 | 12.3 | 7.1 | 6.8 |
| Mexico | 2.0 | 3.3 | 5.7 | 6.2 |
| China | 6.6 | 3.8 | 4.0 | 7.9 |
| India | 7.1 | 9.1 | 9.6 | |
| Russia | 2.3 | 4.8 | 6.3 | 3.8 |
| Sub-Saharan Africa | 3.0 | 3.0 | 6.2 |

Long description
| 2018 Energy Price Index | |
|---|---|
| January, 2018 | 156.1 |
| February, 2018 | 148.2 |
| March, 2018 | 148.0 |
| April, 2018 | 152.7 |
| May, 2018 | 163.6 |
| June, 2018 | 163.9 |
| July, 2018 | 165.3 |
| August, 2018 | 163.9 |
| September, 2018 | 174.1 |
| October, 2018 | 173.8 |
| November, 2018 | 149.3 |
| December, 2018 | 133.3 |
| January, 2019 | 133.3 |
| February, 2019 | 136.0 |
| March, 2019 | 138.3 |
| April, 2019 | 143.8 |
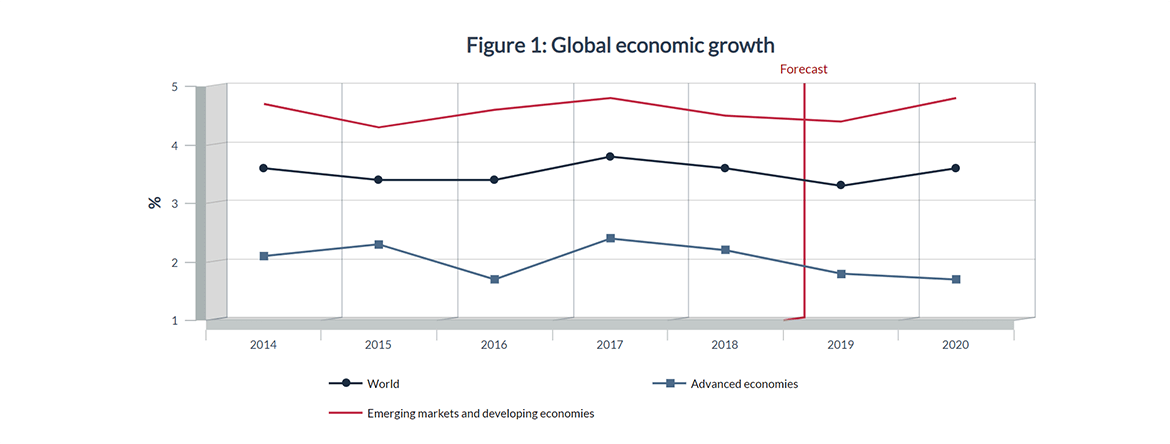
After a broad-based upswing in growth that lasted nearly two years, the global economy started to decelerate in the second half of 2018, causing global growth in 2018 (3.6%) to be slightly lower than that for 2017 (3.8%). The deceleration in 2018 was fairly evenly spread between advanced economies and emerging economies.
Rising trade tensions, lower business confidence, tightening of financial conditions, higher policy uncertainty across many economies and waning cyclical forces were some of the factors behind the slowdown in global activities.
Source: International Monetary Fund, World Economic Outlook, April 2019; retrieved on 20-06-2019
Long description
Figure 1: Global economic growth (in %)
| 2014 | 2015 | 2016 | 2017 | 2018 | 2019 | 2020 | |
|---|---|---|---|---|---|---|---|
| World | 3.6 | 3.4 | 3.4 | 3.8 | 3.6 | 3.4 | 3.6 |
| Advanced economies | 2.1 | 2.3 | 1.7 | 2.4 | 2.2 | 1.8 | 1.7 |
| Emerging markets and developing economies | 4.7 | 4.3 | 4.6 | 4.8 | 4.5 | 4.4 | 4.8 |
Growth among major advanced economies slowed in 2018, with the exception of the United States. Weakening consumer and business sentiment throughout 2018, along with other country-specific issues, caused 2018 gross domestic product (GDP) growth in the Euro area to decline to 1.8% from 2.4% in 2017. Germany grew 1.5% in 2018, compared to 2.5% in 2017, as subdued foreign demand from major trading partners and delays related to new fuel emission standards for diesel vehicles weighed on economic activity. In Italy, an elevated sovereign spreadFootnote 3 continued to put downward pressure on the economy, and growth declined to 0.9% in 2018 from 1.6% in 2017.
In France, street protests against rising fuel prices and high costs of living disrupted retail sales and consumption growth, and France’s economic growth slipped to 1.5% in 2018 from 2.2% in 2017. Uncertainty surrounding Brexit negotiations weighed on the United Kingdom, and growth weakened to 1.4% in 2018, down from 1.8% a year earlier. In Japan, economic growth declined to 0.8% in 2018 from 1.9% in 2017. Notably, however, the United States bucked the trend of decelerating growth, advancing 2.9% last year compared to 2.2% a year earlier. A tight labour market, strong consumption growth, and fiscal stimulus from tax reforms supported the acceleration in economic growth.
Table 1: 2018 Economic indicators for selected regions and economies
| GDP Growth (%) | Unemployment (%) | Real Exports Growth* (%) | Real Imports Growth* (%) | |
|---|---|---|---|---|
| Advanced economies | 2.2 | 5.1 | 3.1 | 3.3 |
| Canada | 1.8 | 5.8 | 3.3 | 2.9 |
| Japan | 0.8 | 2.4 | 3.1 | 3.2 |
| United Kingdom | 1.4 | 4.1 | 0.1 | 0.7 |
| United States | 2.9 | 3.9 | 3.9 | 4.6 |
| Euro area | 1.8 | 8.2 | 3.1 | 3.0 |
| France | 1.5 | 9.1 | 3.0 | 1.2 |
| Germany | 1.5 | 3.4 | 2.2 | 3.4 |
| Italy | 0.9 | 10.6 | 1.9 | 2.3 |
| Emerging markets and developing economies | 4.5 | 4.3 | 5.6 | |
| Commonwealth of Independent States | 2.8 | 5.6 | 3.9 | |
| Russia | 2.3 | 4.8 | 6.3 | 3.8 |
| Emerging and developing Asia | 6.4 | 5.5 | 8.5 | |
| China | 6.6 | 3.8 | 4.0 | 7.9 |
| India | 7.1 | 9.1 | 9.6 | |
| ASEAN-5 | 5.2 | 7.3 | 9.7 | |
| Emerging and developing Europe | 3.6 | 6.5 | 2.6 | |
| Latin America and the Caribbean | 1.0 | 3.0 | 4.3 | |
| Brazil | 1.1 | 12.3 | 7.1 | 6.8 |
| Mexico | 2.0 | 3.3 | 5.7 | 6.2 |
| Middle East and North Africa | 1.4 | -1.0 | -0.6 | |
| Sub-Saharan Africa | 3.0 | 3.0 | 6.2 | |
| Nigeria | 1.9 | 22.6 | -0.7 | 17.7 |
| South Africa | 0.8 | 27.1 | 1.4 | 2.5 |
Source: International Monetary Fund, World Economic Outlook, April 2019; retrieved on 20-06-2019
*Volume of exports and imports of goods and services
Growth in emerging markets and developing economies also slowed slightly in 2018, dropping to 4.5% from 4.8% in 2017. In China, economic growth slowed to 6.6% in 2018 from 6.8% the previous year. The slowdown was due to regulatory tightening, which led to slower growth in fixed asset investment, as the government attempted to put economic growth on a more sustainable path. Declines in automobile sales, along with U.S. tariff actions also weighed on the Chinese economy in 2018. India experienced a slight slowdown in economic growth in 2018 (7.1%) relative to 2017 (7.2%). Mexico, Canada’s third-largest merchandise trade partner, saw a slight decline in economic growth in 2018, at 2.0%, from 2.1% in 2017. By the end of 2018, Mexico’s sovereign spreadFootnote 4 rose as economic sentiment weakened due to policy uncertainty from the new administration that cancelled a planned airport, in addition to the lack of clarity with regard to energy and education reforms.
According to the International Monetary Fund (IMF) in April 2019, the momentum of slower growth globally in the second half of 2018 is expected to carry over into the first half of 2019, with a pickup in economic activity afterward. The IMF expects economic growth to slow to 3.3% in 2019, from 3.6% in 2018, before returning to 3.6% in 2020. The outlook reflects waning cyclical forces, a return to weak potential growth from advanced economies, and an uncertain recovery in emerging markets. Risks to the forecast tilt toward the downside as trade tensions between United States and various trading partners, uncertainty surrounding Brexit negotiations, stress on Italian banks, and other geo-political issues weigh heavily on the economic outlook. On the other hand, with growing evidence of slowing activity, many central banks have signalled a less aggressive path of monetary policy tightening.
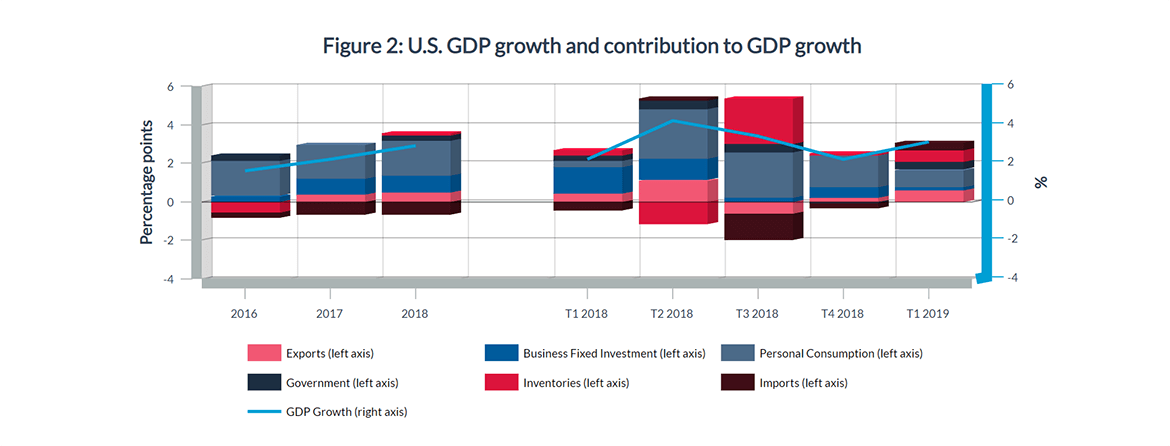
In 2018, while economic growth slowed in many advanced economies, it accelerated in the United States over the previous year. The U.S. expansion was broad-based, as personal consumption, investment, and exports all contributed to growth.
However, beginning in the second half of 2018, there were signs of softening investment brought about by increased uncertainty surrounding rising trade tensions with China.
Source: U.S. Bureau of Economic Analysis, May 30, 2019; retrieved on 20-06-2019
Long description
Figure 2 : U.S. GDP growth and contribution to GDP growt
| 2016 | 2017 | 2018 | _ | T1 2018 | T2 2018 | T3 2018 | T4 2018 | T1 2019 | |
|---|---|---|---|---|---|---|---|---|---|
| Exports (Percentage Point) | -0.01 | 0.36 | 0.47 | 0.43 | 1.12 | -0.62 | 0.22 | 0.58 | |
| Business Fixed Investment (Percentage Point) | 0.29 | 0.81 | 0.9 | 1.34 | 1.10 | 0.21 | 0.54 | 0.18 | |
| Personal Consumption (Percentage Point) | 1.85 | 1.73 | 1.8 | 0.36 | 2.57 | 2.37 | 1.66 | 0.90 | |
| Government (Percentage Point) | 0.25 | -0.01 | 0.26 | 0.27 | 0.43 | 0.44 | -0.07 | 0.42 | |
| Inventories (Percentage Point) | -0.53 | 0 | 0.12 | 0.27 | -1.17 | 2.33 | 0.11 | 0.6 | |
| Imports (Percentage Point) | -0.28 | -0.67 | -0.68 | -0.45 | 0.1 | -1.37 | -0.3 | 0.39 | |
| GDP Growth (%) | 1.6 | 2.2 | 2.9 | 2.2 | 4.2 | 3.4 | 2.2 | 3.1 |
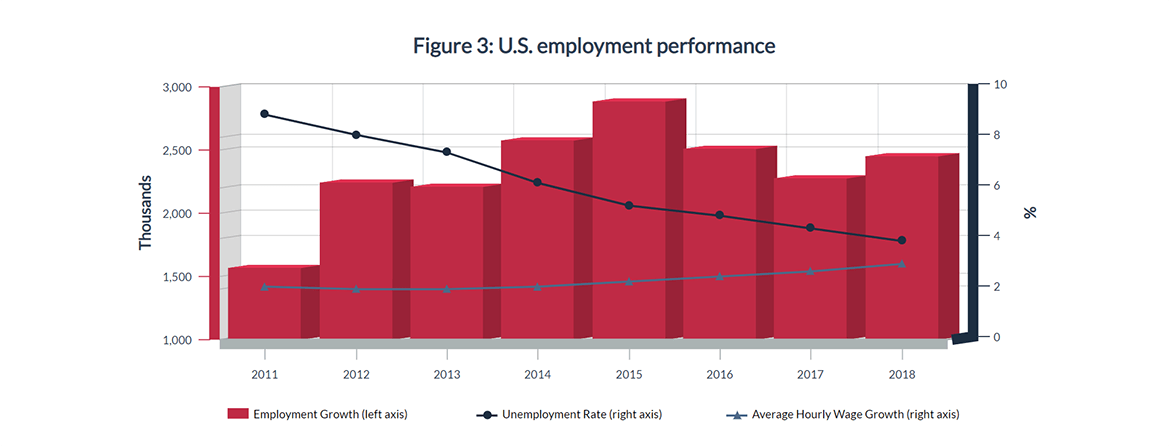
Consumption in the United States continued to be supported by a tight labour market (3.9% unemployment rate in 2018) and a slight pickup in wage growth (3.0% in 2018). According to the IMF forecast released in April 2019, U.S. economic growth is expected to decelerate to 2.3% in 2019 and 1.9% in 2020. The decline in growth reflects the negative impact of trade and political uncertainties, global cyclical forces and the waning positive impacts of fiscal stimulus.
Furthermore, there are risks to U.S. economic growth, which include further escalation of trade tensions with China and the slow ratification process for the new Canada-United States-Mexico Agreement (CUSMA). The U.S. economic outlook from the Organisation for Economic Co-operation and Development (OECD, May 2019) is slightly more positive, 2.8% in 2019 and 2.3% in 2020. The OECD believes that a strong labour market and increasing wages will support consumption growth.
Source: U.S. Bureau of Labor Statistics and IMF, World Economic Outlook, April 2018; retrieved on 20-06-2019
Long description
Figure 3 : U.S. employment performance
| 2011 | 2012 | 2013 | 2014 | 2015 | 2016 | 2017 | 2018 | |
|---|---|---|---|---|---|---|---|---|
| Employment Growth (in thousands) | 1570 | 2243 | 2206 | 2577 | 2885 | 2509 | 2272 | 2450 |
| Unemployment Rate (in %) | 8.93 | 8.08 | 7.36 | 6.16 | 5.28 | 4.88 | 4.35 | 3.89 |
| Average Hourly Wage Growth (in %) | 2.08 | 2.00 | 2.00 | 2.13 | 2.25 | 2.48 | 2.69 | 2.96 |
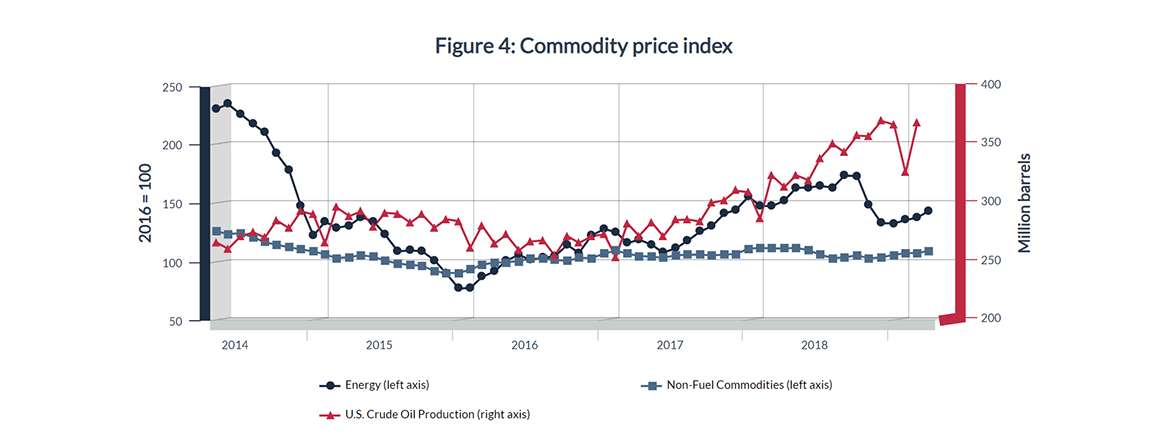
Global energy prices started to decline in the latter part of 2018; the IMF energy price index dropped 23% between September and December 2018. Slowing global growth, supply factors such as the temporary waiver of U.S. sanctions on Iranian oil exports to certain countries, and record high U.S. crude oil production were the main reasons for the decline.
The average monthly West Texas Intermediate crude oil price was US$70.75 per barrel in October 2018, but plunged to US$49.52 per barrel in December 2018. In recent months, crude oil prices have picked up slightly (to US$60.83 per barrel in May 2019), but still remain below their October 2018 level. Excluding energy, overall commodity prices have remained relatively stable.
Source: IMF Primary Commodity Price System and U.S. Energy Information Administration; retrieved on 20-06-2019
Long description
Figure 4: Commodity price index
| Mai 2014 | Juin 2014 | Juillet 2014 | Aug 2014 | Sept. 2014 | Oct. 2014 | Nov. 2014 | Déc. 2014 | Janv. 2015 | Feb 2015 | Mars 2015 | Apr 2015 | Mai 2015 | Jun 2015 | Juillet 2015 | Aug 2015 | Sept. 2015 | Oct 2015 | Nov. 2015 | Dec 2015 | Janv. 2016 | Feb 2016 | Mars 2016 | Apr 2016 | Mai 2016 | Jun 2016 | Juillet 2016 | Aug 2016 | Sept. 2016 | Oct 2016 | Nov. 2016 | Dec 2016 | Janv. 2017 | Feb 2017 | Mars 2017 | Apr 2017 | Mai 2017 | Jun 2017 | Juillet 2017 | Aug 2017 | Sept. 2017 | Oct 2017 | Nov. 2017 | Dec 2017 | Janv. 2018 | Feb 2018 | Mars 2018 | Apr 2018 | Mai 2018 | Jun 2018 | Juillet 2018 | Aug 2018 | Sept. 2018 | Oct 2018 | Nov. 2018 | Dec 2018 | Janv. 2019 | Feb 2019 | Mars 2019 | Apr-2019 | |
|---|---|---|---|---|---|---|---|---|---|---|---|---|---|---|---|---|---|---|---|---|---|---|---|---|---|---|---|---|---|---|---|---|---|---|---|---|---|---|---|---|---|---|---|---|---|---|---|---|---|---|---|---|---|---|---|---|---|---|---|---|
| Energy (2016 is set as baseline at 100) | 231.32 | 235.19 | 226.54 | 218.06 | 210.91 | 193.02 | 178.46 | 148.55 | 122.68 | 134.81 | 129.40 | 131.38 | 138.45 | 135.12 | 123.66 | 109.45 | 110.02 | 109.52 | 101.65 | 90.45 | 77.53 | 78.14 | 87.46 | 92.26 | 101.39 | 106.42 | 102.00 | 103.77 | 105.17 | 114.81 | 108.00 | 123.05 | 128.33 | 126.00 | 116.32 | 119.42 | 114.94 | 108.24 | 112.04 | 118.29 | 126.23 | 130.80 | 141.56 | 144.91 | 156.13 | 148.24 | 147.97 | 152.74 | 163.58 | 163.93 | 165.27 | 163.92 | 174.09 | 173.77 | 149.34 | 133.35 | 133.30 | 136.05 | 138.256 | 143.768 |
| Non-Fuel Commodities (in millions of barrels) | 126.3 | 124.3 | 124.7 | 121.3 | 117.2 | 114.9 | 112.9 | 111 | 109.3 | 106.6 | 103.6 | 104.4 | 106 | 104.7 | 101.4 | 99 | 97.7 | 97.1 | 92.4 | 90.8 | 90.8 | 93.8 | 97.9 | 99.7 | 100 | 100.9 | 103.4 | 102.9 | 102.1 | 101.1 | 103.8 | 103.6 | 107.4 | 110 | 107.3 | 105.4 | 104.7 | 103.9 | 106 | 106.4 | 106.5 | 105.9 | 106.5 | 107.1 | 111.6 | 112.3 | 111.8 | 111.8 | 112.4 | 110.3 | 106.4 | 103.6 | 104.1 | 106 | 103.4 | 104.3 | 106.3 | 107.8 | 107.8 | 109.8 |
| U.S. Crude Oil Production (in millions of barrels) | 267 | 261.5 | 272.3 | 275.5 | 271.2 | 285.8 | 279.1 | 293.5 | 290.9 | 266.3 | 296.9 | 289.5 | 293.4 | 280.3 | 292.3 | 291.4 | 283.8 | 291 | 279.5 | 286.8 | 285.1 | 262.6 | 281.5 | 266 | 273.5 | 260.1 | 267.7 | 268.8 | 255.6 | 272.4 | 266.6 | 272.1 | 274 | 254.3 | 283.3 | 272.5 | 284.2 | 272.2 | 286.1 | 286.6 | 284.9 | 300.8 | 303.1 | 311.3 | 309.8 | 287 | 324.3 | 314.3 | 324.4 | 320.2 | 339 | 351.1 | 344.1 | 358.3 | 357.8 | 370.9 | 367.7 | 326.6 | 369 | 0 |

Chapter 1.2
Global trade performance

At a
glance
Long description
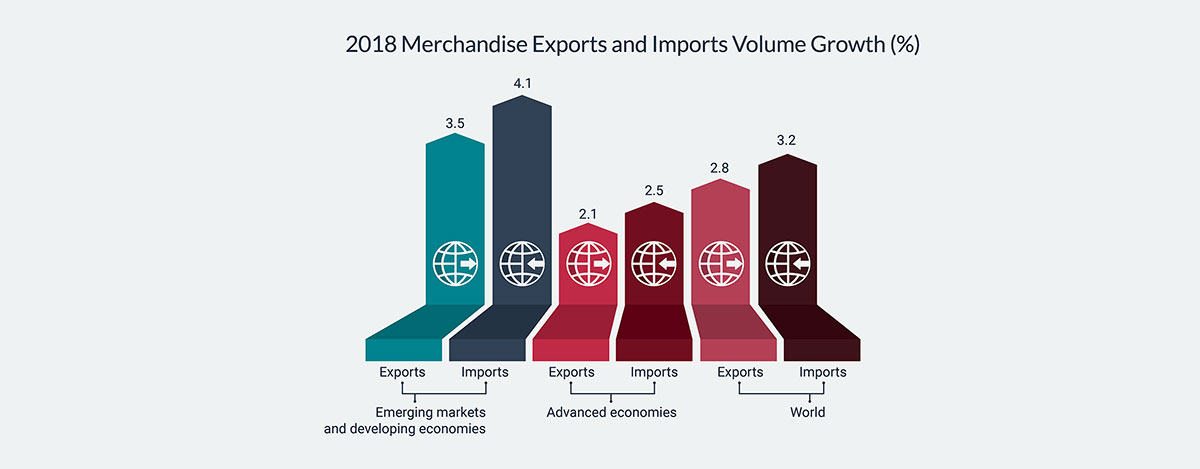
2018 Merchandise Exports and Imports Volume Growth
| Exports Volume Growth (%) | Imports Volume Growth (%) | |
|---|---|---|
| World | 2.8 | 3.2 |
| Advanced economies | 2.1 | 2.5 |
| Emerging markets and developing economies | 3.5 | 4.1 |

Long description
2018 Merchandise Exports
| Value (US$B) | World share (%) | Growth (%) | |
|---|---|---|---|
| World | 19,475 | 100 | 9.8 |
| North America | 2,565 | 13.2 | 7.9 |
| South and Central America and the Caribbean | 635 | 3.3 | 8.2 |
| Europe | 7,112 | 36.5 | 9.3 |
| Africa | 479 | 2.5 | 13.6 |
| Commonwealth of Independent States | 640 | 3.3 | 23.5 |
| Middle East | 1,140 | 5.9 | 21.5 |
| Asia | 6,905 | 35.5 | 8.2 |
2018 Merchandise Imports
| Value (US$B) | World share (%) | Growth (%) | |
|---|---|---|---|
| World | 19,866 | 100.0 | 10.1 |
| North America | 3,561 | 17.9 | 8.4 |
| South and Central America and the Caribbean | 645 | 3.2 | 11.2 |
| Europe | 7,151 | 36.0 | 9.5 |
| Africa | 574 | 2.9 | 11.1 |
| Commonwealth of Independent States | 435 | 2.2 | 8.4 |
| Middle East | 737 | 3.7 | 0.9 |
| Asia | 6,764 | 34.0 | 12.7 |
2018 Commercial Services Exports
| Value (US$B) | World share (%) | Growth (%) | |
|---|---|---|---|
| World | 5,770 | 100.0 | 7.7 |
| North America | 930 | 16.1 | 4.1 |
| South and Central America and the Caribbean | 159 | 2.8 | 1.0 |
| Europe | 2,764 | 47.9 | 8.1 |
| Africa | 112 | 1.9 | 9.9 |
| Commonwealth of Independent States | 117 | 2.0 | 12.1 |
| Middle East | 219 | 3.8 | 5.4 |
| Asia | 1,470 | 25.5 | 9.9 |
2018 Commercial Services Imports
| Value (US$B) | World share (%) | Growth (%) | |
|---|---|---|---|
| World | 5,485 | 100.0 | 7.4 |
| North America | 686 | 12.5 | 3.2 |
| South and Central America and the Caribbean | 181 | 3.3 | 0.8 |
| Europe | 2,346 | 42.8 | 8.4 |
| Africa | 170 | 3.1 | 13.4 |
| Commonwealth of Independent States | 144 | 2.6 | 7.4 |
| Middle East | 300 | 5.5 | 6.1 |
| Asia | 1,659 | 30.2 | 8.2 |
International trade overview
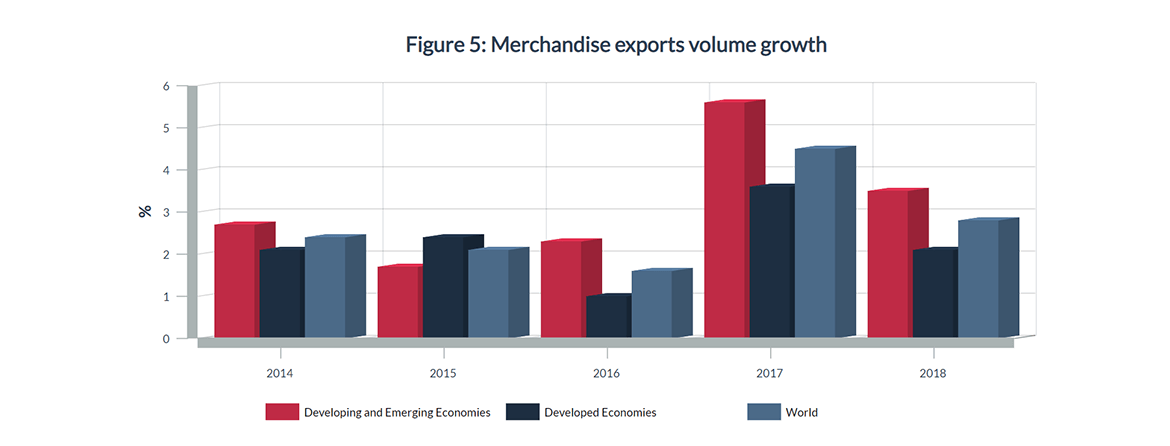
As global economic growth lost momentum in 2018, growth in the volume of world merchandise exports also slowed in both developed economies and emerging markets.
Since the 2009 recession, export volume growth in developing and emerging economies has been outpacing growth in developed economies, with the exception of 2015.
Source: WTO Database; retrieved on 21-06-2019
Long description
Merchandise exports volume growth (in %)
| 2014 | 2015 | 2016 | 2017 | 2018 | |
|---|---|---|---|---|---|
| Developing and Emerging Economies | 2.7 | 1.7 | 2.3 | 5.6 | 3.5 |
| Developed Economies | 2.1 | 2.4 | 1 | 3.6 | 2.1 |
| World | 2.4 | 2.1 | 1.6 | 4.5 | 2.8 |
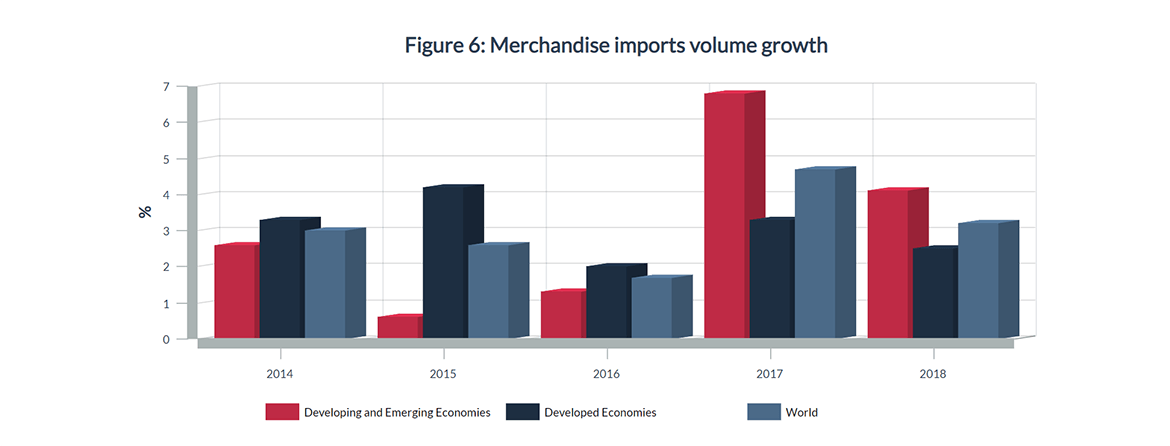
Similar to exports, the growth in the volume of imports also slowed in 2018 across both developed economies and emerging markets.
Merchandise import volumes grew faster in developed economies from 2014 to 2016, but the trend reversed beginning in 2017.
Source: WTO Database; retrieved on 21-06-2019
Long description
Merchandise imports volume growth (in %)
| 2014 | 2015 | 2016 | 2017 | 2018 | |
|---|---|---|---|---|---|
| Developing and Emerging Economies | 2.60 | 0.60 | 1.30 | 6.80 | 4.10 |
| Developed Economies | 3.30 | 4.20 | 2.00 | 3.30 | 2.50 |
| World | 3.00 | 2.60 | 1.70 | 4.70 | 3.20 |
World merchandise exportsFootnote 5 grew 9.8% in 2018 to reach over US$19 trillion. Regionally, exports from the Commonwealth of Independent States grew the fastest at 24%, followed by the Middle East at 21%. North America had the lowest rate of merchandise export growth in 2018, at 7.9%. Among the major North American economies, Mexico had the highest rate of merchandise export growth, and Canada the lowest.
As a result, Mexican exports surpassed those of Canada, causing the two countries to switch rank (12th to 13th for Canada and 13th to 12th for Mexico) among the largest merchandise exporters to the world. The other change in ranking among top merchandise exporters was France overtaking Hong Kong SARFootnote 6 and moving into 7th place.

Table 2: Regional and selected countries merchandise exports
| 2018 Merchandise Exports Value (US$B) | 2018 Merchandise Exports Share (%) | 2018 Merchandise Exports Growth (%) | 2018 Merchandise Exports Rank | Rank 2017 | |
|---|---|---|---|---|---|
| World | 19,475 | 100.0 | 9.8 | ||
| North America | 2,565 | 13.2 | 7.9 | ||
| Canada | 450 | 2.3 | 6.9 | 13 | 12 |
| United States | 1,664 | 8.5 | 7.6 | 2 | 2 |
| Mexico | 451 | 2.3 | 10.1 | 12 | 13 |
| Europe | 7,112 | 36.5 | 9.3 | ||
| United Kingdom | 486 | 2.5 | 10.1 | 10 | 10 |
| European Union (27) | 6,448 | 33.1 | 9.4 | ||
| Euro area (19) | 4,986 | 25.6 | 9.2 | ||
| Belgium | 467 | 2.4 | 8.4 | 11 | 11 |
| France | 582 | 3.0 | 8.7 | 7 | 8 |
| Germany | 1,561 | 8.0 | 7.8 | 3 | 3 |
| Italy | 547 | 2.8 | 7.7 | 9 | 9 |
| Netherlands | 723 | 3.7 | 10.8 | 5 | 5 |
| Commonwealth of Independent States | 640 | 3.3 | 23.5 | ||
| Russia | 444 | 2.3 | 25.6 | 14 | 15 |
| Middle East | 1,140 | 5.9 | 21.5 | ||
| Asia | 6,905 | 35.5 | 8.2 | ||
| China | 2,487 | 12.8 | 9.9 | 1 | 1 |
| Hong Kong SAR | 569 | 2.9 | 3.4 | 8 | 7 |
| India | 326 | 1.7 | 8.8 | 19 | 20 |
| Japan | 738 | 3.8 | 5.8 | 4 | 4 |
| Korea, Republic of | 605 | 3.1 | 5.4 | 6 | 6 |
| South and Central America and the Caribbean | 635 | 3.3 | 8.2 | ||
| Brazil | 240 | 1.2 | 10.0 | 27 | 25 |
| Africa | 479 | 2.5 | 13.6 | ||
| Nigeria | 61 | 0.3 | 36.4 | 50 | 52 |
| South Africa | 94 | 0.5 | 5.9 | 39 | 38 |
Source: WTO Database; retrieved on 21-06-2019
World merchandise imports grew 10%Footnote 7 in 2018 to reach US$20 trillion, with Asia leading growth at 13%, followed by South and Central America and the Caribbean (11%) and Africa (11%). Merchandise imports in North America grew by 8.4%, with Mexico growing the fastest (10%) among the major economies, and Canada the slowest (6.1%).
As a result, Canada and Mexico switched places in the ranking of global merchandise importers. Other movements among the top merchandise importers include the Netherlands overtaking Hong Kong SAR in 7th place, and India overtaking Italy in 10th place.

Table 3: Regional and selected countries merchandise imports
| 2018 Merchandise Imports Value (US$B) | 2018 Merchandise Imports Share (%) | 2018 Merchandise Imports Growth (%) | 2018 Merchandise Imports Rank | Rank 2017 | |
|---|---|---|---|---|---|
| World | 19,866 | 100.0 | 10.1 | ||
| North America | 3,561 | 17.9 | 8.4 | ||
| Canada | 469 | 2.4 | 6.1 | 13 | 12 |
| United States | 2,614 | 13.2 | 8.5 | 1 | 1 |
| Mexico | 477 | 2.4 | 10.3 | 12 | 13 |
| Europe | 7,151 | 36.0 | 9.5 | ||
| United Kingdom | 674 | 3.4 | 4.7 | 5 | 5 |
| European Union (27) | 6,466 | 32.5 | 10.4 | ||
| Euro area (19) | 4,727 | 23.8 | 10.9 | ||
| Belgium | 450 | 2.3 | 10.1 | 14 | 14 |
| France | 673 | 3.4 | 8.7 | 6 | 6 |
| Germany | 1,286 | 6.5 | 10.6 | 3 | 3 |
| Italy | 501 | 2.5 | 10.5 | 11 | 10 |
| Netherlands | 646 | 3.3 | 12.4 | 7 | 8 |
| Commonwealth of Independent States | 435 | 2.2 | 8.4 | ||
| Russia | 249 | 1.3 | 4.6 | 22 | 20 |
| Middle East | 737 | 3.7 | 0.9 | ||
| Asia | 6,764 | 34.0 | 12.7 | ||
| China | 2,136 | 10.8 | 15.8 | 2 | 2 |
| Hong Kong SAR | 628 | 3.2 | 6.4 | 8 | 7 |
| India | 511 | 2.6 | 13.9 | 10 | 11 |
| Japan | 749 | 3.8 | 11.4 | 4 | 4 |
| Korea, Republic of | 535 | 2.7 | 11.9 | 9 | 9 |
| South and Central America and the Caribbean | 645 | 3.2 | 11.2 | ||
| Brazil | 189 | 0.9 | 19.8 | 28 | 29 |
| Africa | 574 | 2.9 | 11.1 | ||
| Nigeria | 42 | 0.2 | 33.9 | 59 | 63 |
| South Africa | 114 | 0.6 | 12.4 | 35 | 35 |
Source: WTO Database; retrieved on 21-06-2019
At 7.7%, world commercial services exports grew slightly slower than the 9.8% pace of world merchandise exports in 2018. By region, the Commonwealth of Independent States led growth in commercial services exports at 12%, followed by Asia and Africa at 9.9% each. North America was the second-slowest growing region (4.1%), expanding only faster than South and Central America and the Caribbean (1.0%). Canada’s commercial services exports grew 5.6% in 2018 and dropped one place to the 18th spot among the world’s top commercial services exporters.
Both India and Japan dropped a place in the rankings as Ireland leapfrogged over them into 7th place, due to high growth (14%). China and India, the two largest emerging economies, experienced strong commercial services exports growth in 2018, at 17% and 11%, respectively. Among developed economies, the Netherlands increased its commercial services exports by 11% to US$241 billion.

Table 4: Regional and selected countries services exports
| 2018 Commercial Services Exports Value (US$B) | 2018 Commercial Services Exports Share (%) | 2018 Commercial Services Exports Growth (%) | 2018 Commercial Services Exports Rank | 2017 Rank | |
|---|---|---|---|---|---|
| World | 5,770 | 100.0 | 7.7 | ||
| North America | 930 | 16.1 | 4.1 | ||
| Canada | 92 | 1.6 | 5.6 | 18 | 17 |
| United States | 808 | 14.0 | 3.8 | 1 | 1 |
| Mexico | 28 | 0.5 | 5.1 | 40 | 38 |
| Europe | 2,764 | 47.9 | 8.1 | ||
| Belgium | 121 | 2.1 | 3.0 | 13 | 13 |
| France | 291 | 5.0 | 6.2 | 4 | 4 |
| Germany | 326 | 5.6 | 7.3 | 3 | 3 |
| Italy | 121 | 2.1 | 9.0 | 14 | 14 |
| Netherlands | 241 | 4.2 | 11.4 | 6 | 6 |
| United Kingdom | 373 | 6.5 | 5.6 | 2 | 2 |
| Commonwealth of Independent States | 117 | 2.0 | 12.1 | ||
| Russia | 64 | 1.1 | 12.3 | 26 | 26 |
| Middle East | 219 | 3.8 | 5.4 | ||
| Asia | 1,470 | 25.5 | 9.9 | ||
| China | 265 | 4.6 | 17.1 | 5 | 5 |
| Hong Kong SAR | 114 | 2.0 | 9.3 | 15 | 15 |
| India | 204 | 3.5 | 10.7 | 8 | 7 |
| Japan | 187 | 3.2 | 3.1 | 9 | 8 |
| Korea, Republic of | 95 | 1.7 | 10.4 | 17 | 18 |
| South and Central America and the Caribbean | 159 | 2.8 | 1.0 | ||
| Brazil | 33 | 0.6 | -1.3 | 36 | 36 |
| Africa | 112 | 1.9 | 9.9 | ||
| Nigeria | 4 | 0.1 | -4.3 | 85 | 81 |
| South Africa | 16 | 0.3 | 1.4 | 49 | 48 |
Source: WTO Database; retrieved on 21-06-2019
World commercial services imports grew 7.4% in 2018, with Africa leading the way at 13% and accounting for 3.1% of overall world commercial services imports. In North America, commercial services imports increased 3.2%, recording the second-slowest regional growth rate. The United States remained the top importer of commercial services, at US$536 billion.
Canada’s imports grew 4.6%, to remain in 14th place among the leading commercial services importers. The large and fast-growing emerging economies of China and India saw high growth in commercial services imports, at 12% and 14%, respectively. Notable among developed economies, the Netherlands (11%), the United Kingdom (11%) and Belgium (12%) all saw high levels of growth in their commercial services imports.

Table 5: Regional and selected countries services imports
| 2018 Commercial Services Imports Value (US$B) | 2018 Commercial Services Imports Share (%) | 2018 Commercial Services Imports Growth (%) | 2018 Commercial Services Imports Rank | 2017 Rank | |
|---|---|---|---|---|---|
| World | 5,485 | 100.0 | 7.4 | ||
| North America | 686 | 12.5 | 3.2 | ||
| Canada | 112 | 2.0 | 4.6 | 14 | 14 |
| United States | 536 | 9.8 | 3.0 | 1 | 1 |
| Mexico | 37 | 0.7 | 0.7 | 32 | 32 |
| Europe | 2,346 | 42.8 | 8.4 | ||
| Belgium | 129 | 2.3 | 11.8 | 11 | 12 |
| France | 257 | 4.7 | 4.7 | 4 | 4 |
| Germany | 350 | 6.4 | 6.2 | 3 | 3 |
| Italy | 123 | 2.2 | 8.5 | 12 | 13 |
| Netherlands | 229 | 4.2 | 10.9 | 6 | 6 |
| United Kingdom | 230 | 4.2 | 10.9 | 5 | 5 |
| Commonwealth of Independent States | 144 | 2.6 | 7.4 | ||
| Russia | 93 | 1.7 | 6.8 | 16 | 16 |
| Middle East | 300 | 5.5 | 6.1 | ||
| Asia | 1,659 | 30.2 | 8.2 | ||
| China | 521 | 9.5 | 12.2 | 2 | 2 |
| Hong Kong SAR | 81 | 1.5 | 4.9 | 19 | 18 |
| India | 175 | 3.2 | 14.0 | 10 | 10 |
| Japan | 198 | 3.6 | 3.8 | 8 | 8 |
| Korea, Republic of | 123 | 2.2 | 2.1 | 13 | 11 |
| South and Central America and the Caribbean | 181 | 3.3 | 0.8 | ||
| Brazil | 66 | 1.2 | -0.9 | 24 | 23 |
| Africa | 170 | 3.1 | 13.4 | ||
| Nigeria | 31 | 0.6 | 70.1 | 37 | 43 |
| South Africa | 16 | 0.3 | 2.2 | 50 | 49 |
Source: WTO Database; retrieved on 21-06-2019
Global investment performance

At a
glance

Long description
2018 FDI flows
| Value (US$B) | Growth (%) | World share (%) | |
|---|---|---|---|
| World | 1,297 | -13 | 100 |
| Europe | 172 | -55 | 13 |
| North America | 291 | -4 | 23 |
| Africa | 46 | 11 | 4 |
| Latin America and the Caribbean | 147 | -6 | 11 |
| Developing Asia | 512 | 4 | 39 |
| Transition economies | 34 | -28 | 3 |
Long description
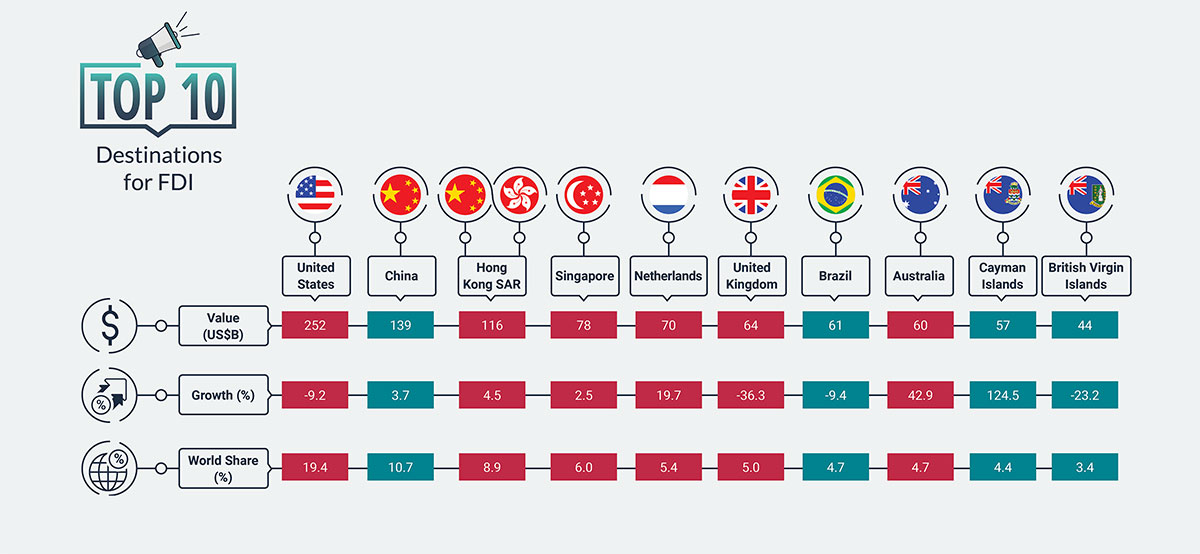
Destination for FDI
| Value (US$B) | Growth (%) | World share (%) | |
|---|---|---|---|
| United States | 252 | -9.2 | 19.4 |
| China | 139 | 3.7 | 10.7 |
| Hong Kong SAR | 116 | 4.5 | 8.9 |
| Singapore | 78 | 2.5 | 6.0 |
| Netherlands | 70 | 19.7 | 5.4 |
| United Kingdom | 64 | -36.3 | 5.0 |
| Brazil | 61 | -9.4 | 4.7 |
| Australia | 60 | 42.9 | 4.7 |
| Cayman Islands | 57 | 124.5 | 4.4 |
| British Virgin Islands | 44 | -23.2 | 3.4 |
Foreign direct investment overview
Global foreign direct investment (FDI) inflows decreased for the third consecutive year, from US$1.5 trillion in 2017 to US$1.3 trillion in 2018. As a result, annual global FDI inflows are near their low point, reached after the global financial crisis in 2009.
Developed economies received an estimated US$557 billion in new FDI in 2018, or 43% of global FDI inflows. However, this was down 27%, or US$202 billion, from the previous year. European countries were responsible for almost the entire decrease, falling by an unprecedented 55% to only US$172 billion, mainly due to large repatriations of retained earnings by U.S. multinational enterprises following the Tax Cuts and Jobs Act enacted by the U.S. government in 2017. FDI inflows fell for the second consecutive year in the transition economies (Southeast Europe and the Commonwealth of Independent States), down 28% to about US$34 billion, mainly due to a 49% decline in Russia.
In contrast, inward FDI flows to developing economies remained resilient, advancing 2%, or US$15 billion, to reach an estimated US$706 billion. Combined with the sharp decline in developed economies, the share of developing economies in global FDI flows jumped from 46% in 2017 to 54% in 2018. Developing Asia (+4%) and Africa (+11%) were mainly responsible for this growth, while a decline in Latin America and the Caribbean (-6%) partially offset the gains.
The United States remained the top economic destination for FDI inflows in 2018, in spite of a 9.2% decline. China (+3.7%), Hong Kong SAR (+4.5%), and Singapore (+2.5%) experienced relatively modest increases in 2018. Among the top European economies, the Netherlands registered a 20% increase in FDI inflows, while the United Kingdom saw its FDI inflows decline by 36% in 2018, likely due to uncertainty about the Brexit negotiations.
Table 6: World FDI inflows by major region, 2017 and 2018 (estimated)
| 2017 (US$B) | 2018 (US$B) | Change (%) | Share 2018 (%) | |
|---|---|---|---|---|
| World | 1,497 | 1,297 | -13 | 100 |
| Developed economies | 759 | 557 | -27 | 43 |
| Europe | 384 | 172 | -55 | 13 |
| North America | 302 | 291 | -4 | 23 |
| Developing economies | 691 | 706 | 2 | 54 |
| Africa | 41 | 46 | 11 | 4 |
| Latin America and the Caribbean | 155 | 147 | -6 | 11 |
| Developing Asia | 493 | 512 | 4 | 39 |
| Transition economies | 48 | 34 | -28 | 3 |
Source: UNCTAD, World Investment Report, June 2019; retrieved on 21-06-2019
Table 7: FDI inflows, top 10 host economies
| 2017 (US$B) | 2018 (US$B) | Change (%) | Share (%) | |
|---|---|---|---|---|
| World | 1,497 | 1,297 | -13.4 | 100.0 |
| United States | 277 | 252 | -9.2 | 19.4 |
| China | 134 | 139 | 3.7 | 10.7 |
| Hong Kong SAR | 111 | 116 | 4.5 | 8.9 |
| Singapore | 76 | 78 | 2.5 | 6.0 |
| Netherlands | 58 | 70 | 19.7 | 5.4 |
| United Kingdom | 101 | 64 | -36.3 | 5.0 |
| Brazil | 68 | 61 | -9.4 | 4.7 |
| Australia | 42 | 60 | 42.9 | 4.7 |
| Cayman Islands | 26 | 57 | 124.5 | 4.4 |
| British Virgin Islands | 58 | 44 | -23.2 | 3.4 |
Source: UNCTAD, World Investment Report, June 2019; retrieved on 21-06-2019
Canada’s performance highlights
Chapter 2.1
Canada’s economic performance

At a
glance
Long description
Canada's Annual GDP Growth 1.9%
Canada's inflation in 2018 2.3%
5.8 % Canada's annual unemployment rate in 2018, the lowest annual unemployment rate on record since 1976
Long description
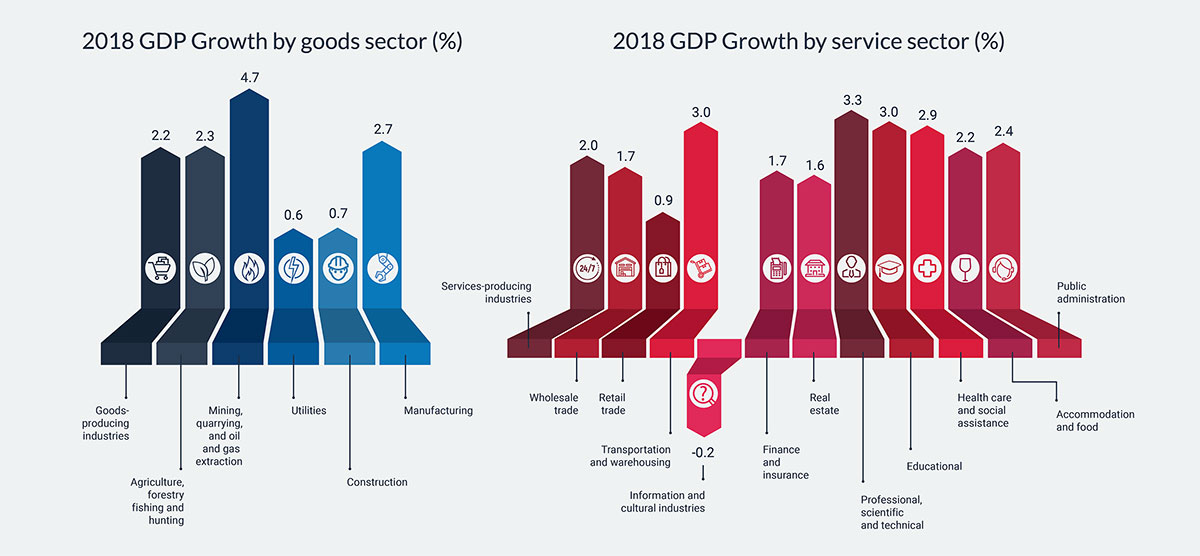
| 2018 GDP Growth, by good sectors in% | |
|---|---|
| Goods-producing industries | 2.2 |
| Agriculture, forestry, fishing and hunting | 2.3 |
| Mining, quarrying, and oil and gas extraction | 4.7 |
| Utilities | 0.6 |
| Construction | 0.7 |
| Manufacturing | 2.7 |
| 2018 GDP Growth, by service sectors in% | |
|---|---|
| Services-producing industries | 2.0 |
| Wholesale trade | 1.7 |
| Retail trade | 0.9 |
| Transportation and warehousing | 3.0 |
| Information and cultural industries | -0.2 |
| Finance and insurance | 1.7 |
| Real estate | 1.6 |
| Professional, scientific and technical | 3.3 |
| Educational | 3.0 |
| Health care and social assistance | 2.9 |
| Accommodation and food | 2.2 |
| Public administration | 2.4 |
National overview
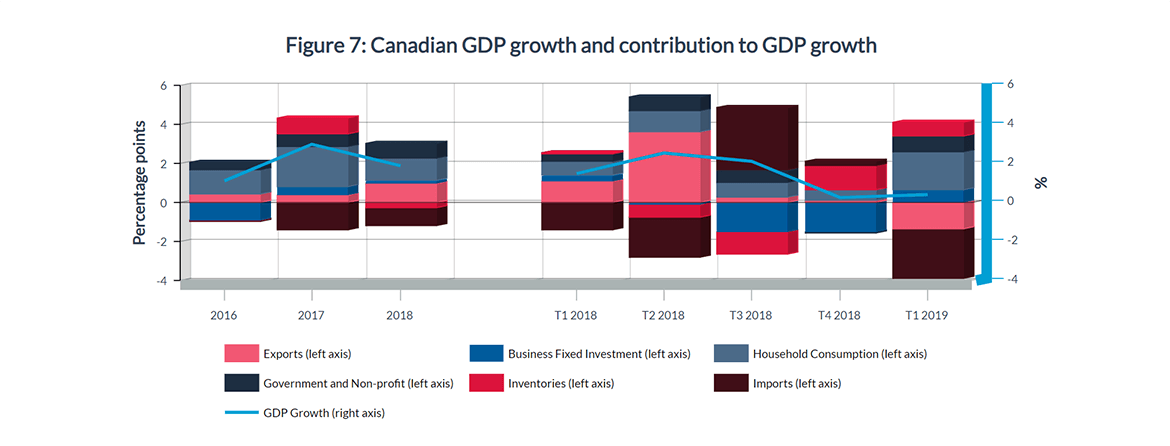
After expanding by 3% in 2017, the Canadian economy grew by a more modest 1.9% in 2018. Household consumption was the leading contributor to growth, but that contribution declined to 1.2 percentage points from 2.0 percentage points in 2017. High household debt relative to disposable income played a role in slowing down household consumption. The introduction of tighter mortgage financing guidelines weighed heavily on the housing sector last year as investment in residential structures declined and was a negative contributor to growth. Non-residential business investment contributed positively to growth, but its contribution was low at 0.2 percentage point.
Trade, which had been a drag on growth in 2017, made a marginally positive contribution in 2018. An acceleration in the growth of real exports along with a deceleration in real imports combined to make the turnaround possible.Economic output rose by 1.5% (seasonally adjusted at annual rates) in Q1 2018, then to 2.5% in Q2, before trailing off in the second half of the year (2.1% in Q3 and 0.3% in Q4). With high levels of uncertainty in global affairs (for example, Brexit, NAFTA/ CUSMA negotiations and the global trade tensions), non-residential business investment was lacklustre, contributing negatively to growth over the final three quarters of 2018.
Source: Statistics Canada, Table 36-10-0104-01 and Table 36-10-0128-01; retrieved on 21-06-2019
Long description
Figure 7: Canadian GDP growth and contribution to GDP growth
| 2016 | 2017 | 2018 | _ | T1 2018 | T2 2018 | T3 2018 | T4 2018 | T1 2019 | |
|---|---|---|---|---|---|---|---|---|---|
| Exports (Percentage Point) | 0.449 | 0.36 | 0.996 | 1.102 | 3.642 | 0.271 | 0.084 | -1.33 | |
| Business Fixed Investment (Percentage Point) | -0.919 | 0.443 | 0.128 | 0.282 | -0.105 | -1.487 | -1.534 | 0.637 | |
| Personal Consumption (Percentage Point) | 1.246 | 2.041 | 1.155 | 0.72 | 1.059 | 0.762 | 0.545 | 1.96 | |
| Government (Percentage Point) | 0.395 | 0.671 | 0.759 | 0.406 | 0.679 | 0.621 | -0.033 | 0.793 | |
| Inventories (Percentage Point) | -0.016 | 0.821 | -0.265 | 0.028 | -0.646 | -1.157 | 1.273 | 0.729 | |
| Imports (Percentage Point) | -0.059 | -1.413 | -0.927 | -1.384 | -2.068 | 3.205 | 0.224 | -2.536 | |
| GDP Growth in % | 1.107 | 2.979 | 1.879 | 1.48 | 2.533 | 2.11 | 0.251 | 0.401 |
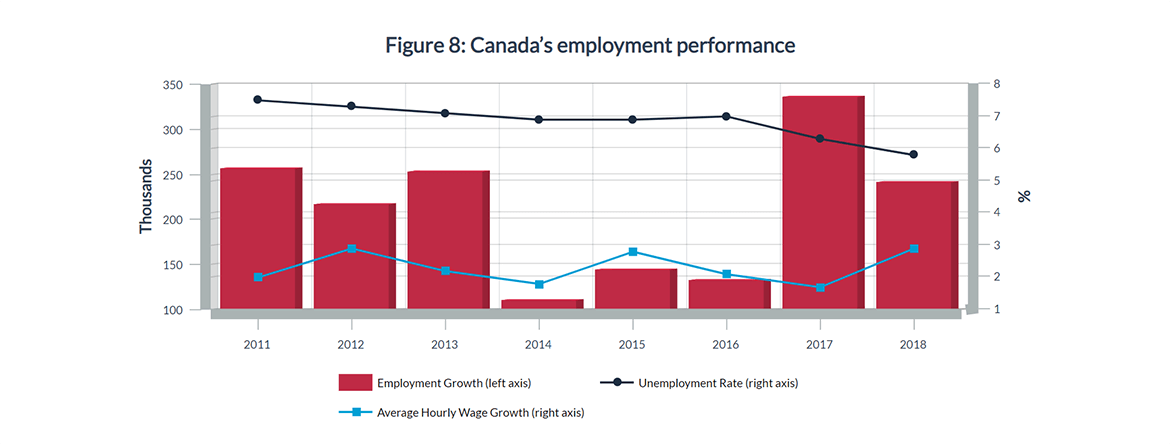
Similar to economic growth, Canadian employment growth moderated in 2018—up by 241,100 jobs compared to 336,500 jobs in 2017. Despite the smaller increase in employment, the unemployment rate fell in 2018, averaging 5.8%, the lowest annual unemployment rate on record since 1976 (and declined to 5.6% in November and December 2018, the lowest monthly rate on record as of the end of 2018).
Concomitantly, average hourly wages grew by 2.9% in 2018, the highest growth since 2012 (2.9%), responding to tighter labour market conditions.
Source: Statistics Canada, Table 14-10-0064-01 and Table 14-10-0327-01; retrieved on 21-06-2019
Long description
Figure 8: Canada’s employment performance
| 2011 | 2012 | 2013 | 2014 | 2015 | 2016 | 2017 | 2018 | |
|---|---|---|---|---|---|---|---|---|
| Employment Growth (in thousands of employed) | 256.7 | 217 | 253.1 | 111.1 | 144.4 | 133.3 | 336.5 | 241.1 |
| Unemployment Rate (in %) | 7.5 | 7.3 | 7.1 | 6.9 | 6.9 | 7.0 | 6.3 | 5.8 |
| Average Hourly Wage Growth (in %) | 2.0 | 2.9 | 2.2 | 1.8 | 2.8 | 2.1 | 1.7 | 2.9 |
Inflation, as measured by the Consumer Price Index (CPI), grew by 2.3% in 2018, the highest growth since 2011, but within the Bank of Canada’s targeted range of 1–3% for inflation. Leading the growth was the transportation category (4.7%), dominated by the gasoline (13%) and air transportation (15%) sub-categories.
Despite this growth, gasoline and energyFootnote 8 costs were slightly lower than in 2014, a peak year. Excluding energy, the CPI grew by 1.9% in 2018.
Table 8: Percentage change in the Consumer Price Index (%)
| 2016 | 2017 | 2018 | |
|---|---|---|---|
| All items | 1.4 | 1.6 | 2.3 |
| Food | 1.5 | 0.1 | 1.8 |
| Shelter | 1.6 | 1.7 | 2.0 |
| Household operations | 1.7 | 0.2 | 1.1 |
| Clothing and footwear | -0.2 | -0.7 | 0.9 |
| Transportation | 1.1 | 3.9 | 4.7 |
| Gasoline | -6.0 | 11.8 | 12.6 |
| Air transportation | 4.0 | 6.8 | 15.3 |
| Health and personal care | 1.4 | 1.7 | 1.3 |
| Recreation and education | 1.7 | 2.4 | 1.1 |
| Alcohol and tobacco | 3.2 | 2.7 | 4.2 |
| Special tabulations | |||
| All items excluding food and energy | 1.9 | 1.6 | 1.9 |
| All items excluding energy | 1.8 | 1.3 | 1.9 |
| Energy | -3.0 | 5.3 | 6.7 |
| All goods | 0.9 | 0.8 | 1.9 |
| All services | 1.8 | 2.2 | 2.7 |
Source: Statistics Canada, Table 18-10-0005-01; retrieved on 21-06-2019
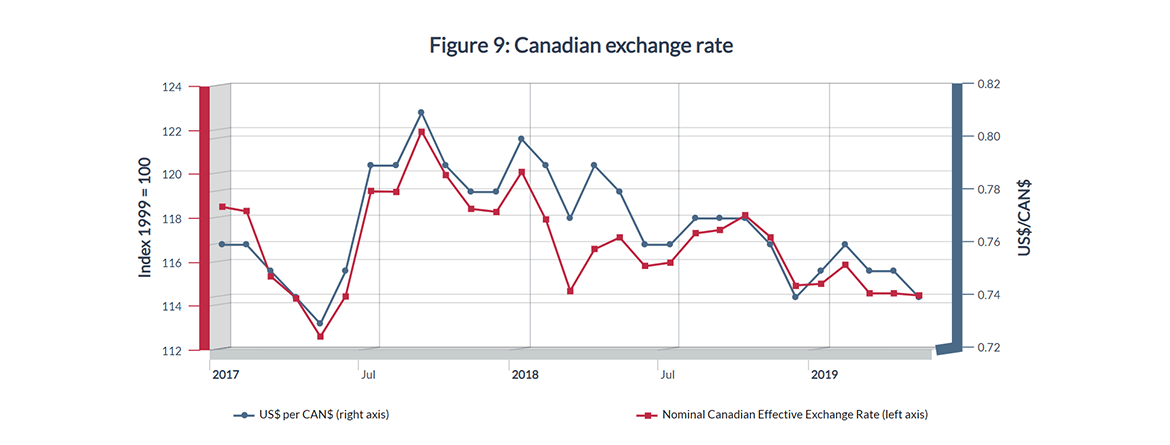
On an annual average basis, the Canadian dollar remained relatively steady in 2018 when benchmarked against the US dollar, appreciating by 0.2% compared to 2017.
However, on a monthly average basis, the Canadian dollar has been on a depreciating trend since September 2017.
Source: Bank of Canada; retrieved on 21-06-2019
Long description
Figure 9: Canadian exchange rate
| US$ per CAN$ | Nominal Canadian Effective Exchange Rate | |
|---|---|---|
| January 2017 | 0.76 | 118.52 |
| February 2017 | 0.76 | 118.32 |
| March 2017 | 0.75 | 115.36 |
| April 2017 | 0.74 | 114.37 |
| May 2017 | 0.73 | 112.62 |
| June 2017 | 0.75 | 114.47 |
| July 2017 | 0.79 | 119.23 |
| August 2017 | 0.79 | 119.21 |
| September 2017 | 0.81 | 121.96 |
| October 2017 | 0.79 | 119.97 |
| November 2017 | 0.78 | 118.43 |
| December 2017 | 0.78 | 118.3 |
| January 2018 | 0.80 | 120.11 |
| February 2018 | 0.79 | 117.93 |
| March 2018 | 0.77 | 114.71 |
| April 2018 | 0.79 | 116.59 |
| May 2018 | 0.78 | 117.13 |
| June 2018 | 0.76 | 115.82 |
| July 2018 | 0.76 | 115.99 |
| August 2018 | 0.77 | 117.32 |
| September 2018 | 0.77 | 117.47 |
| October 2018 | 0.77 | 118.13 |
| November 2018 | 0.76 | 117.15 |
| December 2017 | 0.74 | 114.95 |
| January 2019 | 0.75 | 115.02 |
| February 2019 | 0.76 | 115.88 |
| March 2019 | 0.75 | 114.59 |
| April 2019 | 0.75 | 114.59 |
| May 2019 | 0.74 | 114.49 |
The price of crude oil is of interest for the Canadian economy, particularly the price differential between West Texas Intermediate (WTI), which is representative of American crude oil pricing, and Western Canadian Select (WCS), which is representative of Canadian oil sands crude oil pricing. WCS oil is heavier than WTI and requires more refining. Because of this, WCS trades at a discount relative to WTI. Typically, the price differential is between US$10 and US$20.
However, in November 2018, the price differential between WCS and WTI widened to US$45.93 per barrel, well beyond the historical average, due mainly to excess supply and the lack of export capacity resulting from transportation bottlenecks. To address these issues and to provide price relief to WCS, the Alberta government put in place mandated crude oil production cuts, and made public its intention to acquire locomotives and rail cars for crude oil transportation.

Source: Government of Alberta, Economics Dashboard; retrieved on 21-06-2019
Long description
Figure 10: Oil prices, US$ per barrel
| Date | WCS | WTI | Price differential |
|---|---|---|---|
| August 2014 | 73.89 | 96.08 | -22.19 |
| September 2014 | 74.35 | 93.03 | -18.68 |
| October 2014 | 70.6 | 84.34 | -13.74 |
| November 2014 | 62.87 | 75.81 | -12.94 |
| December 2014 | 43.24 | 59.29 | -16.05 |
| January 2015 | 30.43 | 47.22 | -16.79 |
| February 2015 | 36.52 | 50.58 | -14.06 |
| March 2015 | 34.76 | 47.82 | -13.06 |
| April 2015 | 40.26 | 54.45 | -14.19 |
| May 2015 | 47.5 | 59.27 | -11.77 |
| June 2015 | 51.29 | 59.82 | -8.53 |
| July 2015 | 43.49 | 50.9 | -7.41 |
| August 2015 | 29.48 | 42.87 | -13.39 |
| September 2015 | 26.5 | 45.48 | -18.98 |
| October 2015 | 32.78 | 46.22 | -13.44 |
| November 2015 | 27.78 | 42.44 | -14.66 |
| December 2015 | 22.51 | 37.19 | -14.68 |
| January 2016 | 17.88 | 31.68 | -13.8 |
| February 2016 | 16.3 | 30.32 | -14.02 |
| March 2016 | 23.46 | 37.55 | -14.09 |
| April 2016 | 27.88 | 40.75 | -12.87 |
| May 2016 | 32.52 | 46.71 | -14.19 |
| June 2016 | 36.47 | 48.76 | -12.29 |
| July 2016 | 32.8 | 44.65 | -11.85 |
| August 2016 | 30.9 | 44.72 | -13.82 |
| September 2016 | 30.62 | 45.18 | -14.56 |
| October 2016 | 35.83 | 49.78 | -13.95 |
| November 2016 | 31.89 | 45.66 | -13.77 |
| December 2016 | 37.18 | 51.97 | -14.79 |
| January 2017 | 37.19 | 52.5 | -15.31 |
| February 2017 | 39.14 | 53.47 | -14.33 |
| March 2017 | 35.68 | 49.33 | -13.65 |
| April 2017 | 36.84 | 51.06 | -14.22 |
| May 2017 | 38.84 | 48.48 | -9.64 |
| June 2017 | 35.8 | 45.18 | -9.38 |
| July 2017 | 36.37 | 46.63 | -10.26 |
| August 2017 | 38.5 | 48.04 | -9.54 |
| September 2017 | 39.93 | 49.82 | -9.89 |
| October 2017 | 39.87 | 51.58 | -11.71 |
| November 2017 | 45.52 | 56.64 | -11.12 |
| December 2017 | 44.02 | 57.95 | -13.93 |
| January 2018 | 42.53 | 63.55 | -21.02 |
| February 2018 | 37.72 | 62.16 | -24.44 |
| March 2018 | 35.53 | 62.87 | -27.34 |
| April 2018 | 40.47 | 66.33 | -25.86 |
| May 2018 | 53.25 | 69.89 | -16.64 |
| June 2018 | 52.1 | 67.32 | -15.22 |
| July 2018 | 52.83 | 70.74 | -17.91 |
| August 2018 | 48.55 | 67.85 | -19.3 |
| September 2018 | 40.37 | 70.07 | -29.7 |
| October 2018 | 41.15 | 70.76 | -29.61 |
| November 2018 | 11.03 | 56.96 | -45.93 |
| December 2018 | 5.97 | 49.52 | -43.55 |
| January 2019 | 34.3 | 51.38 | -17.08 |
| February 2019 | 45.33 | 54.95 | -9.62 |
| March 2019 | 48.21 | 58.15 | -9.94 |
| April 2019 | 53.25 | 63.86 | -10.61 |
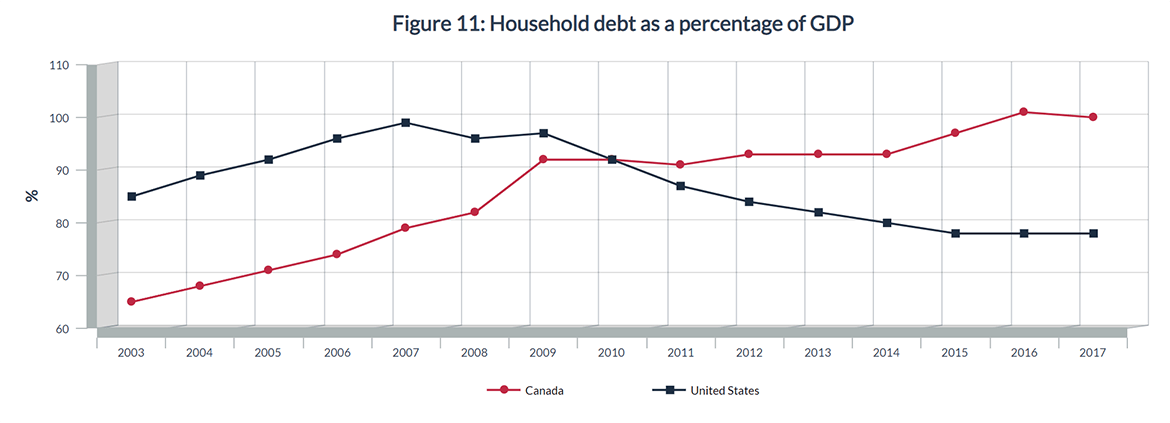
Another issue of interest is the high level of household debt in Canada. While households in the United States have been deleveraging since the 2009 financial crisis, dropping the household debt to GDP ratio to 78% in 2017, Canadian households have not followed suit, and as a result household debt has exceeded 100% of GDP since the second quarter of 2016.
A persistently high and increasing level of household debt can cause constraints to household consumption, an important driver of economic growth. On the other hand, continued strength in the labour market should mitigate some of the negative impact of household debt.
Source: IMF, DataMapper; retrieved on 24-06-2019
Long description
Figure 11: Household debt as a percentage of GDP
| Date | Canada | United States |
|---|---|---|
| 2003 | 65 | 85 |
| 2004 | 68 | 89 |
| 2005 | 71 | 92 |
| 2006 | 74 | 96 |
| 2007 | 79 | 99 |
| 2008 | 82 | 96 |
| 2009 | 92 | 97 |
| 2010 | 92 | 92 |
| 2011 | 91 | 87 |
| 2012 | 93 | 84 |
| 2013 | 93 | 82 |
| 2014 | 93 | 80 |
| 2015 | 97 | 78 |
| 2016 | 101 | 78 |
| 2017 | 100 | 78 |
Goods-producing industries grew at 2.2% in 2018, slightly faster than services-producing industries (2.0%). On the goods side, oil and gas extraction was up 7.1% in 2018, causing its share of GDP to increase to 5.5% from 5.3%. Construction grew by a meagre 0.7%, corresponding to slowdowns in housing activity. Within manufacturing, durables grew by 2.5% in 2018, despite a 1.4% decline in motor vehicle and parts manufacturing.
Growth in non-durables was more robust at 2.9%, but negative growth in petroleum and coal product manufacturing mitigated some of the gain. In 2018, growth on the services side was led by professional, scientific and technical services (3.3%), transportation and warehousing services (3.0%), and educational services (3.0%). Growth in real estate services moderated to 1.6% in 2018, after growing by 2.5% the year before. The information and communication technology sector continued to be a bright spot in 2018, growing at 3.5%, though slightly lower than the 4.0% growth in 2017.

Table 9: GDP growth and share by industry
| GDP Growth (%) 2016 | GDP Growth (%) 2017 | GDP Growth (%) 2018 | Share of GDP (%) 2016 | Share of GDP (%) 2017 | Share of GDP (%) 2018 | |
|---|---|---|---|---|---|---|
| Goods-producing industries | -1.2 | 4.5 | 2.2 | 29.4 | 29.8 | 29.8 |
| Agriculture, forestry, fishing and hunting | 4.3 | -0.2 | 2.3 | 2.1 | 2.1 | 2.1 |
| Mining, quarrying, and oil and gas extraction | -3.4 | 8.8 | 4.7 | 7.2 | 7.6 | 7.8 |
| Oil and gas extraction | 1.5 | 6.7 | 7.1 | 5.1 | 5.3 | 5.5 |
| Utilities | 1.2 | 3.4 | 0.6 | 2.2 | 2.2 | 2.2 |
| Construction | -4.4 | 4.4 | 0.7 | 7.3 | 7.4 | 7.3 |
| Residential construction | 2.9 | 4.2 | 0.9 | 2.6 | 2.7 | 2.6 |
| Manufacturing | 0.7 | 3.8 | 2.7 | 10.3 | 10.4 | 10.5 |
| Durable manufacturing | -0.8 | 4.0 | 2.5 | 5.5 | 5.6 | 5.6 |
| Transportation equipment | -0.2 | -2.6 | 1.0 | 1.5 | 1.4 | 1.4 |
| Motor vehicles and parts | 2.4 | -2.8 | -1.4 | 0.9 | 0.9 | 0.8 |
| Non-durable manufacturing | 2.5 | 3.5 | 2.9 | 4.8 | 4.8 | 4.9 |
| Petroleum and coal | -1.0 | 6.0 | -3.0 | 0.6 | 0.6 | 0.6 |
| Petroleum refineries | -0.9 | 5.1 | -3.2 | 0.5 | 0.6 | 0.5 |
| Chemicals | 5.1 | 0.2 | 3.6 | 1.1 | 1.1 | 1.1 |
| Services-producing industries | 2.0 | 2.8 | 2.0 | 70.5 | 70.2 | 70.1 |
| Wholesale trade | 0.9 | 5.9 | 1.7 | 5.2 | 5.3 | 5.3 |
| Retail trade | 3.0 | 5.9 | 0.9 | 5.1 | 5.2 | 5.2 |
| Transportation and warehousing | 2.9 | 4.6 | 3.0 | 4.4 | 4.5 | 4.5 |
| Information and cultural industries | 0.9 | 1.3 | -0.2 | 3.1 | 3.1 | 3.0 |
| Finance and insurance | 4.1 | 3.1 | 1.7 | 6.6 | 6.6 | 6.6 |
| Real estate | 3.0 | 2.5 | 1.6 | 12.8 | 12.7 | 12.7 |
| Professional, scientific and technical | 0.2 | 2.6 | 3.3 | 5.7 | 5.6 | 5.7 |
| Educational | 1.6 | 1.3 | 3.0 | 5.4 | 5.3 | 5.3 |
| Health care and social assistance | 2.3 | 1.9 | 2.9 | 7.0 | 6.9 | 7.0 |
| Accommodation and food | 3.1 | 3.8 | 2.2 | 2.2 | 2.3 | 2.3 |
| Public administration | 1.3 | 1.9 | 2.4 | 6.7 | 6.6 | 6.7 |
| Special industry tabulations | ||||||
| Information and communication technology | 2.0 | 4.0 | 3.5 | 4.4 | 4.4 | 4.5 |
| Energy | -1.1 | 7.3 | 2.8 | 8.9 | 9.2 | 9.3 |
| Cannabis | 0.7 | -0.9 | 20.0 | 0.3 | 0.3 | 0.3 |
Source: Statistics Canada, Table 36-10-0434-06; retrieved on 24-06-2019
Overall employment grew by 1.3% in 2018, with goods-producing industries advancing by 1.4% and services-producing industries by 1.3%. On the goods side, utilities employment grew the fastest—at 9.2%—but still only accounts for 0.8% of employment. However, utilities had the highest average hourly wage, at $41, and a low sectoral unemployment rate of 1.7%. Employment in the forestry, fishing, mining, quarrying, and oil and gas sector grew by 3.3% in 2018, but overall employment is still below the 2014 peak (373,600), and the sector had the highest unemployment rate and a slower wage growth than average, despite being the second-highest paying sector in terms of average hourly wage.
Employment growth in manufacturing was tepid at 0.2% in 2018, but the unemployment rate (3.6%) and wage growth (3.3%) were solid. On the services side, transportation and warehousing led employment growth at 5.0%, supporting a low unemployment rate of 3.3%; however, wage growth was slightly below average at 2.7%.
Table 10: 2018 Employment and wage information, by industry
| Industry | Employment (‘000s) | Employment Growth (%) | Employment Share (%) | Unemployment Rate (%) | Hourly Wage Average ($) | Hourly Wage Growth (%) |
|---|---|---|---|---|---|---|
| Goods-producing industries | 3,929 | 1.4 | 21.1 | 4.9 | 28.74 | 2.6 |
| Agriculture | 277 | -0.8 | 1.5 | 4.0 | 19.59 | 8.3 |
| Forestry, fishing, mining, quarrying, oil and gas | 341 | 3.3 | 1.8 | 6.8 | 38.46 | 1.3 |
| Mining, quarrying, and oil and gas extraction | 272 | 3.1 | 1.5 | 4.7 | ||
| Utilities | 145 | 9.2 | 0.8 | 1.7 | 41.03 | 2.5 |
| Construction | 1,438 | 2.0 | 7.7 | 6.6 | 29.05 | 1.1 |
| Manufacturing | 1,728 | 0.2 | 9.3 | 3.6 | 26.34 | 3.3 |
| Durables | 1,043 | 0.0 | 5.6 | 3.3 | ||
| Non-durables | 686 | 0.6 | 3.7 | 4.1 | ||
| Services-producing industries | 14,729 | 1.3 | 78.9 | 3.2 | 26.44 | 3.0 |
| Wholesale and retail trade | 2,795 | -0.5 | 15.0 | 3.7 | 20.79 | 2.9 |
| Wholesale trade | 656 | -2.5 | 3.5 | 2.6 | ||
| Retail trade | 2,138 | 0.1 | 11.5 | 4.1 | ||
| Transportation and warehousing | 991 | 5.0 | 5.3 | 3.3 | 26.59 | 2.7 |
| Finance, insurance, and real estate | 1,174 | 0.2 | 6.3 | 1.8 | 31.08 | 3.6 |
| Finance and insurance | 829 | -0.3 | 4.4 | 1.8 | ||
| Real estate | 345 | 1.5 | 1.8 | 2.1 | ||
| Professional, scientific and technical | 1,467 | 1.2 | 7.9 | 2.5 | 33.56 | 1.9 |
| Business, building and other support services | 777 | 2.7 | 4.2 | 5.6 | 20.91 | 7.4 |
| Educational | 1,325 | 3.1 | 7.1 | 3.4 | 33.4 | 2.0 |
| Health care and social assistance | 2,407 | 1.0 | 12.9 | 1.6 | 27.51 | 1.3 |
| Information, culture and recreation | 787 | -0.3 | 4.2 | 4.8 | 24.9 | 2.6 |
| Accommodation and food | 1,235 | 2.0 | 6.6 | 5.4 | 15.9 | 5.7 |
| Other services | 803 | 2.8 | 4.3 | 2.9 | 23.42 | 4.6 |
| Public administration | 969 | 0.8 | 5.2 | 2.1 | 36.4 | 3.3 |
| All Industries | 18,658 | 1.3 | 100.0 | 5.8 | 26.92 | 2.9 |
Source: Statistics Canada, Table 14-10-0064-01 and Table 14-10-0023-01; retrieved on 24-06-2019
Although Canada has the lowest level of national unemployment since 1976 (5.8% in 2018), disparities in regional employment performance continued to exist in 2018. Notwithstanding strong employment growth in Prince Edward Island (3.1%) and Nova Scotia (1.5%), the Atlantic provinces experienced persistent high rates of unemployment in 2018: Newfoundland and Labrador (14%), Prince Edward Island (9.4%), Nova Scotia (7.5%), and New Brunswick (8.0%). Quebec’s unemployment rate reached a historical low of 5.5%, despite slower employment growth (0.9%). Furthermore, its wage growth was the highest among provinces, at 3.2%. Continued solid employment growth (1.6%) helped lower Ontario’s unemployment rate to 5.6%, the lowest since 1989, and supported wage growth of 2.9%.
As a result of weak employment growth (0.6%), the unemployment rate in Manitoba rose to 6.0% in 2018, from 5.4% in 2017. However, wage growth in the province was solid, at 2.8%. Employment growth in Saskatchewan was the second-weakest among provinces and territories, and the unemployment rate was above the national average. Similarly, Alberta’s unemployment rate was above the national average, however, the province posted the second-fastest employment growth among provinces and territories and had the highest average weekly earnings among the provinces. At 4.7%, British Columbia’s unemployment rate was the lowest among provinces (and at its lowest level since 2008), but the province has the highest inflation rate among all provinces and territories.
Table 11: 2018 Provincial and territorial employment and inflation
| Provinces/Territories | Employment (‘000s) | Employment Growth (%) | Unemployment Rate (%) | Weekly Earnings Average ($) | Weekly Earnings Growth (%) | Inflation (%) |
|---|---|---|---|---|---|---|
| Canada | 18,658 | 1.3 | 5.8 | 1,001 | 2.6 | 2.3 |
| Newfoundland and Labrador | 225 | 0.5 | 13.8 | 1,038 | 0.3 | 1.6 |
| Prince Edward Island | 76 | 3.1 | 9.4 | 841 | 2.3 | 2.3 |
| Nova Scotia | 456 | 1.5 | 7.5 | 871 | 1.2 | 2.2 |
| New Brunswick | 354 | 0.3 | 8.0 | 911 | 2.8 | 2.1 |
| Quebec | 4,262 | 0.9 | 5.5 | 932 | 3.2 | 1.7 |
| Ontario | 7,242 | 1.6 | 5.6 | 1,021 | 2.9 | 2.4 |
| Manitoba | 648 | 0.6 | 6.0 | 937 | 2.8 | 2.5 |
| Saskatchewan | 570 | 0.4 | 6.1 | 1,014 | 0.5 | 2.3 |
| Alberta | 2,331 | 1.9 | 6.6 | 1,148 | 1.7 | 2.4 |
| British Columbia | 2,494 | 1.1 | 4.7 | 969 | 2.7 | 2.7 |
| Yukon | 21 | 0.5 | 2.7 | 1,118 | 2.1 | 2.4 |
| Northwest Territories | 21 | 0.5 | 7.3 | 1,420 | 1.5 | 2.3 |
| Nunavut | 14 | 0.7 | 14.1 | 1,376 | 3.2 | 3.0 |
Source: Statistics Canada, Table 14-10-0090-01, Table 14-10-0204-01 and Table 18-10-0005-01; retrieved on 24-06-2019
In conjunction with slowing growth toward the end of 2018, forward-looking economic indicators, such as the Ivey Purchasing Managers Index (PMI) and the Bank of Canada’s Business Outlook Survey (BOS) Indicator, point to a decline in economic sentiment among Canadian businesses. The Ivey PMI, which measures the month-to-month variation in economic sentiment as indicated by a panel of purchasing managers from across Canada, has been trending downward to sit at 50.6 in February 2019, indicating that firms with positive outlooks continue to outnumber firms with negative outlooks, but the gap has been declining.Footnote 9 In recent months, the Ivey PMI has improved slightly to 55.9 in May 2019, but sentiments in the first five months of 2019 are still lower than for the same period last year.
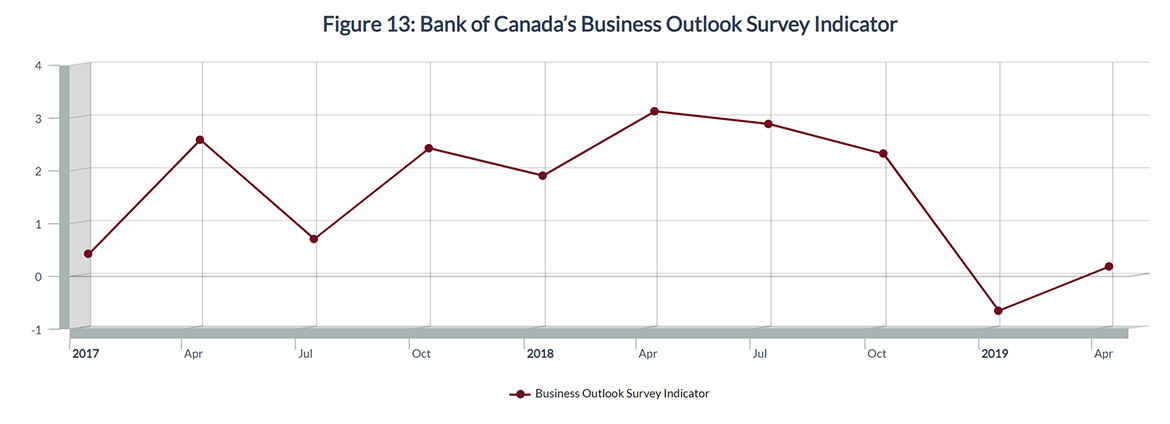
Another indication of softening business sentiment can be seen in the Bank of Canada’s BOS indicator, which has declined since the second half of 2018 from positive levels to a negative one. Results for several BOS survey questions in the spring 2019 edition were below historical averages. The latest edition of theBOS(summer 2019) points to a slight improvement in business sentiment, but weakness tied to Western Canada’s oil industry and global trade tensions continue to dampen outlook.
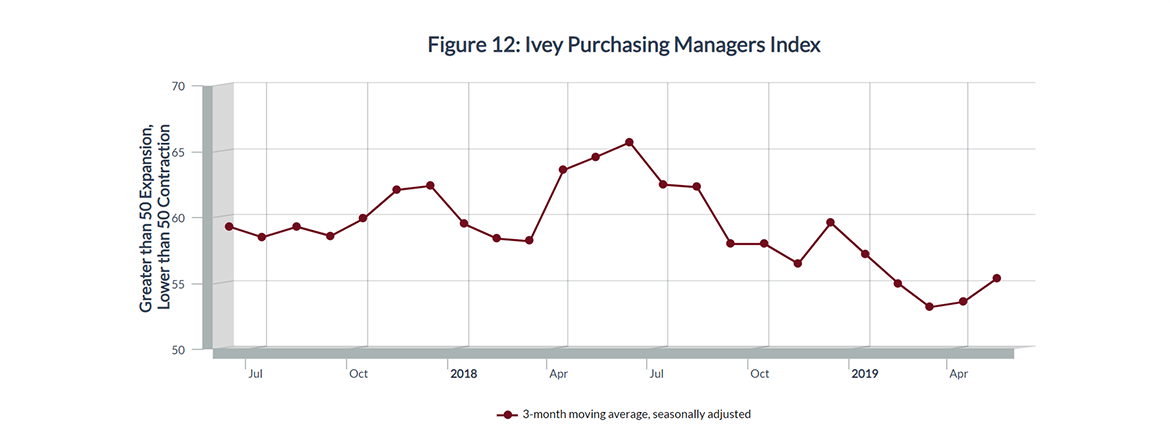
Source: Ivey Business School; retrieved on 24-06-2019
Long description
Figure 12: Ivey Purchasing Managers Index
| 3-month moving average, seasonally adjusted | |
|---|---|
| 2017-06-01 | 59.3 |
| 2017-07-01 | 58.5 |
| 2017-08-01 | 59.3 |
| 2017-09-01 | 58.6 |
| 2017-10-01 | 59.9 |
| 2017-11-01 | 62.1 |
| 2017-12-01 | 62.4 |
| 2018-01-01 | 59.5 |
| 2018-02-01 | 58.4 |
| 2018-03-01 | 58.2 |
| 2018-04-01 | 63.6 |
| 2018-05-01 | 64.6 |
| 2018-06-01 | 65.7 |
| 2018-07-01 | 62.5 |
| 2018-08-01 | 62.3 |
| 2018-09-01 | 58.0 |
| 2018-10-01 | 58.0 |
| 2018-11-01 | 56.5 |
| 2018-12-01 | 59.6 |
| 2019-01-01 | 57.2 |
| 2019-02-01 | 55.0 |
| 2019-03-01 | 53.2 |
| 2019-04-01 | 53.6 |
| 2019-05-01 | 55.4 |
Soft economic conditions persisted into early 2019, but the Bank of Canada expects activity to pick up later in 2019, resulting in an economy forecasted to grow by 1.2% for the year (April 2019 Monetary Policy Report). The negative effects of low oil prices, housing policy changes, and 2017-18 increases in borrowing rates should fade out later in 2019. The pickup in economic activity is expected to spill over into 2020, supporting Canadian economic growth of 2.1%.
Global trade tensions, for example between the United States and its trading partners, along with tensions between the parties to Brexit are sources of great uncertainty in the economic forecast, as persistent or escalating tensions can reduce foreign demand, disrupt global value chains, lower business confidence and depress commodity prices. On the other hand, if trade tensions are resolved, economic activity could be stronger than expected.
Source: Bank of Canada, Business Outlook Survey, spring 2019; retrieved 28-06-2019
Long description
Figure 13: Bank of Canada’s Business Outlook Survey Indicator
| Business Outlook Survey Indicator | |
|---|---|
| January 2017 | 0.42 |
| April 2017 | 2.59 |
| July 2017 | 0.71 |
| October 2017 | 2.43 |
| January 2018 | 1.91 |
| April 2018 | 3.13 |
| July 2018 | 2.89 |
| October 2018 | 2.32 |
| January 2019 | -0.65 |
| April 2019 | 0.19 |

Canada’s trade performance

At a
glance
Long description
Trade by sector
| 2018 Canadian Exports by sectors Value ($B) | 2018 Canadian Exports by sectors Change (%) | 2018 Canadian Imports by sectors Value ($B) | 2018 Canadian Imports by sectors Change (%) | |
|---|---|---|---|---|
| Goods | ||||
| Agri-food and fish | 39.7 | 1.9 | 20.3 | 4.4 |
| Energy | 111.1 | 14.8 | 38.1 | 14.2 |
| Metal ores and minerals | 19.3 | 19.7 | 14.4 | 16.1 |
| Metal and mineral products | 64.6 | 4.8 | 41.5 | 1.4 |
| Chemicals, plastics and rubber | 35.0 | 6.8 | 47.3 | 9.8 |
| Forestry, building and packaging | 47.2 | 7.8 | 26.9 | 5.6 |
| Industrial machinery and equipment | 39.4 | 6.2 | 68.2 | 8.8 |
| Electronic and electrical equipment | 29.4 | 3.5 | 71.3 | 5.4 |
| Motor vehicles and parts | 90.5 | -3.0 | 113.8 | 0.2 |
| Aircraft and other transport equipment | 25.8 | 12.7 | 23.8 | 13.8 |
| Consumer goods | 66.6 | 5.7 | 121.4 | 4.9 |
| Services | ||||
| Travel | 28.5 | 8.1 | 43.4 | 5.1 |
| Transportation | 17.9 | 4.9 | 31.6 | 10.0 |
| Commercial | 72.8 | 5.2 | 69.5 | 1.1 |
| Government | 1.6 | 0.8 | 1.3 | 5.0 |

Long description
Trade by region
| 2018 Canadian Exports by regions Value ($B) | 2018 Canadian Exports by regions Change (%) | 2018 Canadian Imports by regions Value ($B) | 2018 Canadian Imports by regions Change (%) | |
|---|---|---|---|---|
| Goods | ||||
| United States | 432.7 | 5.4 | 390.8 | 5.4 |
| European Union | 46.2 | 5.9 | 63.5 | 11.8 |
| China | 29.0 | 16.4 | 46.4 | 8.5 |
| Japan | 13.3 | 9.1 | 12.7 | -6.3 |
| Mexico | 9.5 | 3.5 | 20.9 | -1.9 |
| South Korea | 6.1 | 9.7 | 8.3 | 12.0 |
| India | 4.4 | -0.7 | 3.9 | 29.6 |
| Rest of World | 43.9 | 13.0 | 60.7 | 4.0 |
| Services | ||||
| All countries | 120.8 | 5.8 | 145.8 | 4.2 |
| United States | 66.5 | 4.4 | 78.8 | 4.0 |
| European Union | 20.6 | 8.0 | 26.1 | 0.5 |
| Japan | 1.5 | -3.8 | 2.6 | 9.8 |
| Rest of World | 32.2 | 7.8 | 38.2 | 6.7 |
Canada trade overview
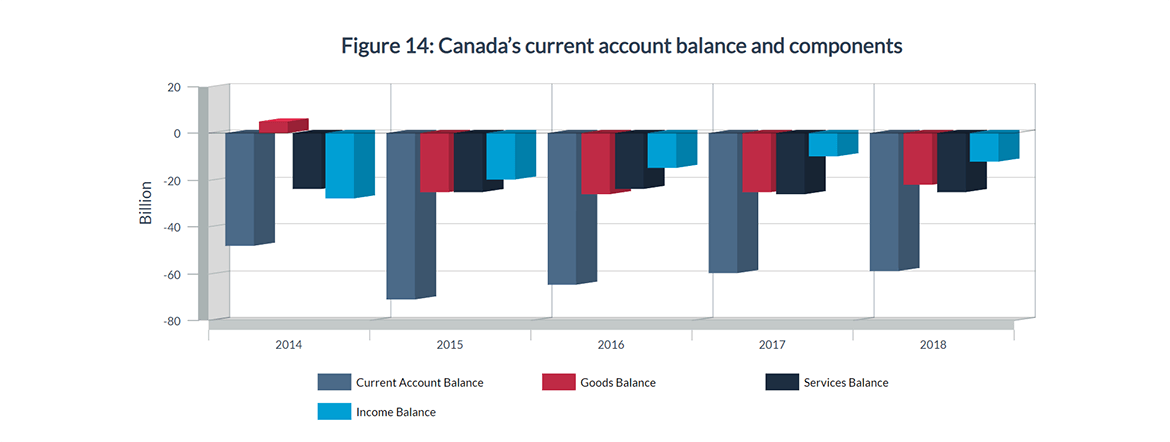
Canada’s current account balanceFootnote 10 recorded a deficit of $59 billion in 2018. This was $1.6 billion smaller than in 2017. The lower trade deficit was mainly due to a narrowing of the goods trade deficit by $2.7 billion.
However, these gains were partially offset by the combination of a widening income deficit and the services trade balance moving sideways.
Source: Statistics Canada, Table 36-10-0014-01; retrieved on 24-06-2019
Long description
Figure 14: Canada’s current account balance and components
| Dates | Current Account Balance ($ Billion) | Goods Balance ($ Billion) | Services Balance ($ Billion) | Income Balance ($ Billion) |
| 2014 | -48 | 5 | -24 | -28 |
| 2015 | -71 | -25 | -25 | -20 |
| 2016 | -65 | -26 | -24 | -15 |
| 2017 | -60 | -25 | -26 | -10 |
| 2018 | -59 | -22 | -25 | -12 |
In 2018, Canada’s exports of goods and services to the world increased 6.2%, or $41 billion, to reach $706 billion, while imports rose 5.4%, or $39 billion, to $753 billion. As both exports and imports expanded, the total value of trade in goods and services reached a record high of $1.5 trillion, or 66% of GDP.
Overall, export prices increased 2.9% while import prices grew 2.4%, and Canada’s terms of tradeFootnote 11 improved for the second consecutive year to 94.5, an improvement of 0.4 percentage point over the previous year.

Source: Statistics Canada, Table 36-10-0104-01; retrieved on 24-06-2019
Long description
Figure 15: Canadian Trade of Goods and Services
| 2014 | 2015 | 2016 | 2017 | 2018 | |
|---|---|---|---|---|---|
| Exports of Goods and Services (in $ Billion) | 628.9 | 629.1 | 632.4 | 664.8 | 706.0 |
| Imports of Goods and Services (in $ Billion) | 647.6 | 678.3 | 681.2 | 714.4 | 753.0 |
Canada’s goodsFootnote 12 exports continued to grow in 2018, up 6.5% to $585 billion, with export prices increasing by 2.2% and export volumes expanding by 4.1%.Footnote 13 Concurrently, Canada’s goods imports advanced 5.8% to $607 billion, as both import prices and import volumes increased, up 2.4% and 3.3%, respectively. As a result, total goods trade reached a record high of $1.2 trillion. Moreover, since exports outpaced imports in 2018, Canada’s goods trade deficit narrowed by $2.7 billion to $22 billion.
Exports
Canadian goods exports grew for the second consecutive year in 2018, with export up in all sectors, except motor vehicles and parts. Energy exports growth led the way, advancing $14 billion, or 15%, to reach $111 billion in value, followed by consumer goods (+ $3.6 billion) and forestry, building and packaging products (+ $3.4 billion). Unlike the previous year, the growth of Canadian exports was driven more by an expansion in volumes than in export prices, as volumes were up 4.1% compared to a 2.2% growth in prices. Notable increases in export volumes were registered for metal ores and minerals (+17%), aircraft and other transportation equipment (+12%), and energy products (+8.2%). On the price side, prices of forestry, building and packaging products were up 9.7%.
However, the growth of energy prices slowed from 22% in 2017 to 6.2% in 2018. Crude oil, the main component of this category, experienced large price fluctuations, as its average price rose steadily in the first five months of 2018 and then trended downward slightly until October, before falling sharply in November.Footnote 14 Other sectors that posted strong price increases were metal and mineral products (+5.9%) and chemical, plastic and rubber products (+5.4%). Exports of motor vehicles and parts fell by $2.8 billion, or 3.0%, in 2018, due mainly to a 3.1% decline in export prices.
By destination, goods exports to the United States increased 5.4%, or $22 billion, to $433 billion in 2018. However, exports to non-U.S. destinations grew even faster, up 9.8% (or $14 billion) to $153 billion. As a result, Canada’s goods exports continued to diversify away from the United States. Among Canada’s major non-U.S. trading partners, exports to China recorded the fastest growth (+16%), followed by South Korea (+9.7%) and Japan (+9.1%). Goods exports to the European Union rose modestly (+5.9%), but exports to the Netherlands and Italy posted strong growth, up 51% and 33%, respectively. However, due to falling gold exports, these strong gains were partially offset by declining exports to the United Kingdom (-9.7%).

Table 12: Goods exports, 2018
| Value of Exports, 2018 ($B) | Change in Value (%) | Change in Volume (%) | Change in Price (%) | |
|---|---|---|---|---|
| Total | 585.3 | 6.5 | 4.1 | 2.2 |
| By product | ||||
| Agri-food and fish | 39.7 | 1.9 | 2.5 | -0.7 |
| Energy | 111.1 | 14.8 | 8.2 | 6.2 |
| Metal ores and minerals | 19.3 | 19.7 | 17.2 | 2.1 |
| Metal and mineral products | 64.6 | 4.8 | -1.0 | 5.9 |
| Chemicals, plastics and rubber | 35.0 | 6.8 | 1.4 | 5.4 |
| Forestry, building and packaging | 47.2 | 7.8 | -1.7 | 9.7 |
| Industrial machinery and equipment | 39.4 | 6.2 | 4.9 | 1.2 |
| Electronic and electrical equipment | 29.4 | 3.5 | 3.5 | 0.1 |
| Motor vehicles and parts | 90.5 | -3.0 | 0.2 | -3.1 |
| Aircraft and other transport equipment | 25.8 | 12.7 | 11.8 | 0.8 |
| Consumer goods | 66.6 | 5.7 | 4.2 | 1.4 |
| By region/country | ||||
| United States | 432.7 | 5.4 | ||
| European Union | 46.2 | 5.9 | ||
| China | 29.0 | 16.4 | ||
| Japan | 13.3 | 9.1 | ||
| Mexico | 9.5 | 3.5 | ||
| South Korea | 6.1 | 9.7 | ||
| India | 4.4 | -0.7 | ||
| Rest of World | 43.9 | 13.0 |
Source: Statistics Canada, Tables 36-10-0020-01, 12-10-0126-01 and 36-10-0023-01; retrieved on 24 06 2019
Imports
Canada’s goods imports rose 5.8%, or $33 billion, to $607 billion in 2018. Imports increased in all sectors, led by metal ores and minerals, energy products, and aircraft and other transportation equipment—all of which posted double-digit growth rates. Volumes expanded by 3.3%, led by metal ores and minerals (+13%) and aircraft and other transportation equipment (+12%), while those for metal and mineral products fell by 12%. At the same time, import prices rose 2.4% on the back of higher prices for metal and mineral products (+15%) and energy products (+11%).
Regionally, imports from the United States were up 5.4% to $391 billion in 2018, while imports from non-U.S. sources grew 6.5% to $216 billion. Of Canada’s major non-U.S. trading partners, imports from India recorded the fastest growth at 30% in 2018, followed by imports from South Korea (+12%) and the EU (+12%).

Table 13: Goods imports, 2018
| Value of Imports, 2018 ($B) | Change in Value (%) | Change in Volume (%) | Change in Price (%) | |
|---|---|---|---|---|
| Total | 607.2 | 5.8 | 3.3 | 2.4 |
| By product | ||||
| Agri-food and fish | 20.3 | 4.4 | 6.5 | -2.0 |
| Energy | 38.1 | 14.2 | 2.9 | 11.0 |
| Metal ores and minerals | 14.4 | 16.1 | 13.1 | 2.6 |
| Metal and mineral products | 41.5 | 1.4 | -11.9 | 15.2 |
| Chemicals, plastics and rubber | 47.3 | 9.8 | 1.6 | 8.1 |
| Forestry, building and packaging | 26.9 | 5.6 | 1.1 | 4.4 |
| Industrial machinery and equipment | 68.2 | 8.8 | 7.4 | 1.3 |
| Electronic and electrical equipment | 71.3 | 5.4 | 7.8 | -2.2 |
| Motor vehicles | 113.8 | 0.2 | 2.3 | -2.1 |
| Aircraft and other transport equipment | 23.8 | 13.8 | 12.4 | 1.2 |
| Consumer goods | 121.4 | 4.9 | 3.8 | 1.1 |
| By region/country | ||||
| United States | 390.8 | 5.4 | ||
| European Union | 63.5 | 11.8 | ||
| China | 46.4 | 8.5 | ||
| Japan | 12.7 | -6.3 | ||
| Mexico | 20.9 | -1.9 | ||
| South Korea | 8.3 | 12.0 | ||
| India | 3.9 | 29.6 | ||
| Rest of World | 60.7 | 4.0 |
Source: Statistics Canada, Tables 36-10-0020-01, 12-10-0126-01 and 36-10-0023-01; retrieved on 24 06 2019
In 2018, Canadian services exports grew for the ninth consecutive year, up 5.8%, or $6.6 billion, to reach $121 billion, while services imports rose 4.2%, or $5.8 billion, to reach $146 billion. Since services exports slightly outperformed imports, the services trade deficit narrowed by $743 million to $25 billion in 2018. Nevertheless, Canada continued to run a services trade deficit with every broad region and most major trading partners; nearly half of this deficit was with the United States.
By sector
Travel exports accounted for nearly one quarter of services exports in 2018 and were once again the fastest-growing sector, up 8.1% in 2018 to reach $29 billion. Personal travel exports accounted for all the growth in this sector (+9.9%), while business travel declined (-3.6%). Exports of transportation services increased moderately, up 4.9% to $18 billion, with water transportation growing faster than air transportation.
Commercial services exports continued to be the central component of services exports, accounting for over 60% of total services exports. In contrast to last year, commercial services exports rose modestly in 2018, up 5.2%, or $3.6 billion, to reach $73 billion. Gains were led by technical, trade-related and other business services (+$1.2 billion, up 10%), financial services (+$1.0 billion, up 10%) and telecommunications, computer, and information services (+$879 million, up 8.3%), while a $1.2 billion decline in exports of professional and management consulting services partially offset the advance.
On the import side, travel imports rose 5.1% to $43 billion, with imports of both business and personal travel growing at roughly the same rate. Transportation services added $2.9 billion (10%) in 2018, with nearly two thirds of the increase coming from water transportation. Imports of commercial services grew much slower than commercial services exports, only up 1.1% to $69 billion. Imports of financial services fell 7.3% or $895 million, while two small sub-sectors recorded double-digit growth—research and development services (+29%) and personal, cultural, and recreational services (+12%). Other major sub-sectors posted minor changes in 2018.
Table 14: Canada’s services trade by sector, 2018
| 2018 Exports ($M) | Change (%) | 2018 Imports ($M) | Change (%) | |
|---|---|---|---|---|
| Total Services | 120,773 | 5.8 | 145,804 | 4.2 |
| Travel | 28,514 | 8.1 | 43,449 | 5.1 |
| Business travel | 3,464 | -3.6 | 5,434 | 5.4 |
| Personal travel | 25,052 | 9.9 | 38,016 | 5.1 |
| Transportation | 17,854 | 4.9 | 31,572 | 10.0 |
| Water transport | 3,768 | 9.2 | 14,455 | 14.5 |
| Air transport | 8,388 | 5.9 | 12,720 | 6.5 |
| Land and other transport | 5,700 | 0.7 | 4,396 | 6.0 |
| Commercial services | 72,806 | 5.2 | 69,455 | 1.1 |
| Maintenance and repair services | 2,510 | 26.3 | 986 | 3.6 |
| Construction services | 300 | 8.7 | 294 | 6.9 |
| Insurance services | 2,168 | 10.3 | 5,394 | 9.0 |
| Financial services | 10,839 | 10.3 | 11,410 | -7.3 |
| Telecommunications, computer, and information services | 11,471 | 8.3 | 6,239 | -0.1 |
| Charges for the use of intellectual property | 6,270 | 12.5 | 15,317 | -0.8 |
| Professional and management consulting services | 16,050 | -6.9 | 14,479 | 2.6 |
| Research and development services | 6,759 | 0.3 | 1,612 | 28.5 |
| Technical, trade-related, and other business services | 12,918 | 10.1 | 10,258 | 2.3 |
| Personal, cultural, and recreational services | 3,522 | 7.3 | 3,468 | 11.5 |
| Government services | 1,598 | 0.8 | 1,329 | 5.0 |
Source: Statistics Canada, Table 36-10-0021-01; retrieved on 24-06-2019
By region
The overall increase in the value of services exports was led by a $2.8 billion (4.4%) increase in services exports to the United States. Increased commercial services exports accounted for nearly 65% of the growth to the United States, followed by travel services exports. Canadian services imports from the United States also rose by $3.1 billion (4.0%) to reach $79 billion, mainly on higher imports of travel services ($1.6 billion, or 7.5%) and transportation services ($1.2 billion, or 11%). As a result of these balanced movements, the services trade deficit with the United States widened marginally in 2018 to $123 billion.
Services trade with the EU posted a large gain, with Canadian exports rising $1.5 billion, or 8.0%, to reach $21 billion. Most of the gain was in commercial services, which advanced $1.2 billion. At the same time, services imports advanced marginally, up 0.5%, or $131 million, to reach $26 billion.
A decline in services exports and an increase in services imports resulted in a widening of the services trade deficit with Japan to $1.2 billion. The bulk of the movements for both exports and imports occurred in travel services.
In 2018, services exports to the rest of the world (ROW) climbed 7.8% to $32 billion, mainly from an expansion in travel services exports. However, total services exports declined to Australia (-15%), South Korea (-15%), Mexico (-7.1%) and China (-1.8%). On the import side, services imports from ROW rose 6.7% to $38 billion, led by the $1.3 billion increase in imports of transportation services.
Table 15: Canada's services trade by region, 2018
| Exports ($M) | Change (%) | Imports ($M) | Change (%) | Balance ($M) | Change ($M) | |
|---|---|---|---|---|---|---|
| All Countries | 120,773 | 5.8 | 145,804 | 4.2 | -25,031 | 742 |
| Travel | 28,515 | 8.1 | 43,450 | 5.1 | -14,934 | 11 |
| Transportation | 17,854 | 4.9 | 31,571 | 9.9 | -13,717 | -2,030 |
| Commercial services | 72,805 | 5.2 | 69,455 | 1.1 | 3,350 | 2,811 |
| Government services | 1,598 | 0.8 | 1,328 | 4.9 | 270 | -50 |
| United States | 66,508 | 4.4 | 78,844 | 4.0 | -12,336 | -279 |
| Travel | 11,096 | 8.1 | 23,318 | 7.5 | -12,222 | -795 |
| Transportation | 8,322 | 2.0 | 11,274 | 11.5 | -2,952 | -997 |
| Commercial services | 46,661 | 3.9 | 43,759 | 0.6 | 2,902 | 1,513 |
| Government services | 428 | 3.4 | 493 | 3.1 | -64 | 0 |
| EU | 20,590 | 8.0 | 26,111 | 0.5 | -5,520 | 1,404 |
| Travel | 3,764 | 2.1 | 6,672 | -3.9 | -2,908 | 347 |
| Transportation | 4,069 | 6.1 | 5,749 | 8.6 | -1,680 | -220 |
| Commercial services | 12,519 | 10.8 | 13,394 | -0.6 | -875 | 1,299 |
| Government services | 239 | 1.3 | 296 | 9.2 | -57 | -21 |
| Japan | 1,475 | -3.8 | 2,641 | 9.8 | -1,166 | -294 |
| Travel | 435 | -16.3 | 605 | 146.9 | -170 | -444 |
| Transportation | 568 | 2.7 | 822 | -6.4 | -254 | 71 |
| Commercial services | 441 | 2.3 | 1,193 | -5.5 | -752 | 79 |
| Government services | 32 | 3.2 | 22 | 0.0 | 10 | 1 |
| Rest of world | 32,200 | 7.8 | 38,208 | 6.7 | -6,009 | -89 |
| Travel | 13,220 | 11.0 | 12,855 | 3.2 | 366 | 903 |
| Transportation | 4,895 | 9.2 | 13,726 | 10.4 | -8,831 | -884 |
| Commercial services | 13,184 | 4.9 | 11,109 | 6.6 | 2,075 | -80 |
| Government services | 899 | -0.7 | 517 | 4.4 | 381 | -30 |
Source: Statistics Canada, Table 36-10-0014-01; retrieved on 24-06-2019

Canada’s foreign direct investment performance

At a
glance

Long description
| 2018 FDI flow by industry ($M) | |
|---|---|
| Total net flows | 54,736 |
| Energy and mining | 5,776 |
| Manufacturing | 17,719 |
| Trade and transportation | 7,632 |
| Finance and insurance | 4,261 |
| Management of companies and enterprises | 3,208 |
| Other industries | 16,140 |
| 2018 FDI stock by region ($M) | |
|---|---|
| All countries | 876,856 |
| North America | 438,443 |
| Europe | 329,438 |
| Asia & Oceania | 89,910 |
| South & Central America | 17,328 |
| Africa | 1,737 |

Long description
| 2018 CDIA flow by industry ($M) | |
|---|---|
| Total net flows | 64,277 |
| Energy and mining | 9,836 |
| Manufacturing | 6,889 |
| Trade and transportation | 17,893 |
| Finance and insurance | 24,935 |
| Management of companies and enterprises | 6,215 |
| Other industries | -1,491 |
| 2018 CDIA stock by region ($M) | |
|---|---|
| All countries | 1,288,869 |
| North America | 807,734 |
| Europe | 317,773 |
| Asia & Oceania | 88,923 |
| South & Central America | 67,197 |
| Africa | 7,190 |
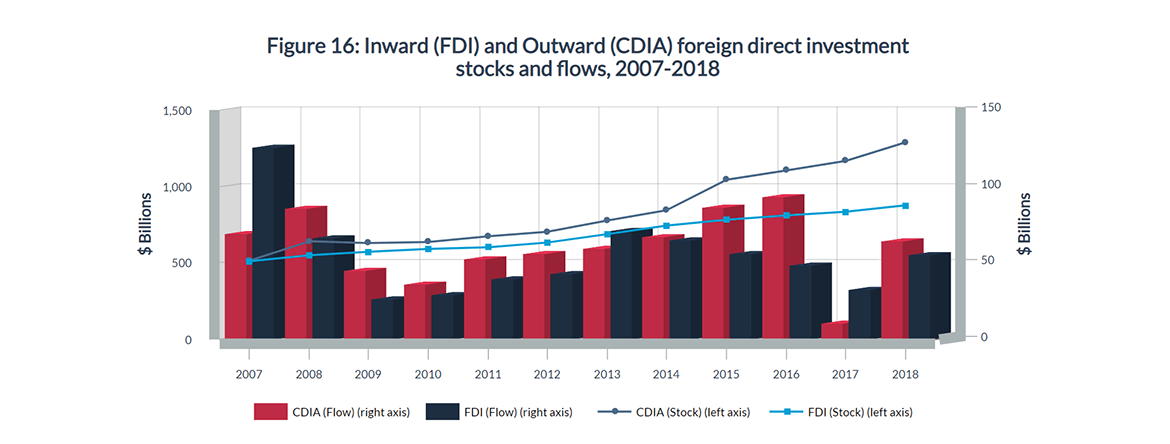
Source: Statistics Canada, Tables 36-10-0025-01 and 36-10-0008-01; retrieved on 24-06-2019
Longue description
Figure 16: Inward (FDI) and Outward (CDIA) foreign direct investment stocks and flows, 2007-2018
| CDIA (Flow) ($ Billion) | FDI (Flow) ($ Billion) | CDIA (Stock) ($ Billion) | FDI (Stock) ($ Billion) | |
| 2007 | 69 | 125 | 515 | 512 |
| 2008 | 85 | 66 | 642 | 551 |
| 2009 | 45 | 26 | 631 | 574 |
| 2010 | 36 | 29 | 637 | 592 |
| 2011 | 52 | 39 | 675 | 603 |
| 2012 | 56 | 43 | 704 | 634 |
| 2013 | 59 | 71 | 778 | 689 |
| 2014 | 67 | 65 | 845 | 745 |
| 2015 | 86 | 56 | 1044 | 783 |
| 2016 | 93 | 48 | 1105 | 811 |
| 2017 | 10 | 32 | 1167 | 835 |
| 2018 | 64 | 55 | 1289 | 877 |
In 2018, total flows of FDI into Canada increased by 70% to $55 billion, compared to declines in most other developed economies. This sharp increase was due to a $24 billion (+262%) growth in FDI from non-U.S. sources, mainly from European countries such as Switzerland and the Netherlands, while flows from the United States declined by 6.8%. The largest total FDI inflows gain came from mergers and acquisitions (M&A) turning positive in 2018, with a net increase of nearly $20 billion. Reinvested earnings also climbed $3.0 billion, while other FDI inflows declined marginally.
By sector, strong flows of investment into Canada’s manufacturing sector (45%) made up for the declines in trade and transportation (-41%) and finance and insurance (-13%). Moreover, investment in other industries nearly doubled. After two major divestures totalling $9.3 billion in 2017, inflows into Canada’s oil sector turned positive in 2018 to reach $5.8 billion.

Table 16: Inward and outward foreign direct investment stocks and flows, 2007–2018
| Type of FDI Inflows | 2017 ($M) | 2018 ($M) | Change (%) | Change ($M) |
|---|---|---|---|---|
| From the world | ||||
| Total net flows | 32,226 | 54,736 | 69.9 | 22,510 |
| Mergers and acquisitions | -4,892 | 15,029 | n/a | 19,921 |
| Reinvested earnings | 23,055 | 26,069 | 13.1 | 3,014 |
| Other flows | 14,062 | 13,638 | -3.0 | -424 |
| From the United States | ||||
| Total net flows | 23,055 | 21,495 | -6.8 | -1,560 |
| Mergers and acquisitions | -4,315 | 4,314 | n/a | 8,629 |
| Reinvested earnings | 14,736 | 13,776 | -6.5 | -960 |
| Other flows | 12,633 | 3,406 | -73.0 | -9,227 |
| From the rest of the world | ||||
| Total net flows | 9,171 | 33,240 | 262.4 | 24,069 |
| Mergers and acquisitions | -576 | 10,715 | n/a | 11,291 |
| Reinvested earnings | 8,317 | 12,294 | 47.8 | 3,977 |
| Other flows | 1,430 | 10,232 | 615.5 | 8,802 |
| Sectors of FDI inflows from the world | ||||
| Energy and mining | -9,333 | 5,776 | n/a | 15,109 |
| Manufacturing | 12,222 | 17,719 | 45.0 | 5,497 |
| Trade and transportation | 12,856 | 7,632 | -40.6 | -5,224 |
| Finance and insurance | 4,891 | 4,261 | -12.9 | -630 |
| Management of companies and enterprises | 3,280 | 3,208 | -2.2 | -72 |
| Other industries | 8,312 | 16,140 | 94.2 | 7,828 |
Source: Statistics Canada, Tables 36-10-0025-01 and 36-10-0026-01; retrieved on 24-06-2019
Foreign investors’ cumulative holdings of direct investment (stock) in Canada expanded by $42 billion, or 5.0%, to reach $877 billion in 2018. Because the stock of FDI grew slightly faster than Canada’s nominal GDP (+3.6%) in 2018, the FDI stock to GDP the ratio of FDI stock to GDP increased from 39% in 2017 to 40% in 2018.
All regions except Africa increased their FDI stock in Canada in 2018. The FDI stock from North America, comprising the United States, Mexico and the Caribbean region, was up 5.2% over the previous year and accounted for exactly half of Canada’s FDI stock. The United States remained Canada’s largest foreign investor by far, with a FDI stock totalling $406 billion in 2018.
The level of inward FDI stock from Europe (4.9%) and Asia and Oceania (4.2%) grew slightly slower. In contrast, the FDI stock from South and Central America recorded the fastest regional expansion in 2018, advancing by 10% to reach $17 billion, almost entirely due to Brazilian investment. However, investment from Africa declined by 12%.

Table 17: Foreign direct investment stock in Canada, by region
| 2017 ($M) | 2018 ($M) | Share 2017 (%) | Share 2018 (%) | Change (%) | |
|---|---|---|---|---|---|
| All countries | 834,757 | 876,856 | 100 | 100 | 5.0 |
| North America | 416,758 | 438,443 | 49.9 | 50.0 | 5.2 |
| United States | 386,869 | 406,051 | 46.3 | 46.3 | 5.0 |
| Bermuda | 15,520 | 16,604 | 1.9 | 1.9 | 7.0 |
| Cayman Islands | 8,002 | 8,912 | 1.0 | 1.0 | 11.4 |
| British Virgin Islands | 3,011 | 2,928 | 0.4 | 0.3 | -2.8 |
| Mexico | 2,696 | 2,730 | 0.3 | 0.3 | 1.3 |
| Europe | 314,006 | 329,438 | 37.6 | 37.6 | 4.9 |
| Netherlands | 101,861 | 106,706 | 12.2 | 12.2 | 4.8 |
| Luxembourg | 54,627 | 55,828 | 6.5 | 6.4 | 2.2 |
| United Kingdom | 46,988 | 50,353 | 5.6 | 5.7 | 7.2 |
| Switzerland | 44,010 | 46,147 | 5.3 | 5.3 | 4.9 |
| Germany | 16,617 | 17,008 | 2.0 | 1.9 | 2.4 |
| France | 11,545 | 13,509 | 1.4 | 1.5 | 17.0 |
| Ireland | 7,100 | 8,094 | 0.9 | 0.9 | 14.0 |
| Belgium | 7,669 | 8,015 | 0.9 | 0.9 | 4.5 |
| Asia and Oceania | 86,269 | 89,910 | 10.3 | 10.3 | 4.2 |
| Japan | 28,162 | 28,871 | 3.4 | 3.3 | 2.5 |
| Hong Kong SAR | 20,075 | 21,802 | 2.4 | 2.5 | 8.6 |
| China | 16,226 | 16,959 | 1.9 | 1.9 | 4.5 |
| Australia | 9,296 | 9,682 | 1.1 | 1.1 | 4.2 |
| United Arab Emirates | 3,156 | 3,441 | 0.4 | 0.4 | 9.0 |
| India | 2,723 | 2,561 | 0.3 | 0.3 | -5.9 |
| South Korea | 2,561 | 2,398 | 0.3 | 0.3 | -6.4 |
| Kuwait | 2,180 | 2,158 | 0.3 | 0.2 | -1.0 |
| South and Central America | 15,749 | 17,328 | 1.9 | 2.0 | 10.0 |
| Brazil | 13,185 | 14,628 | 1.6 | 1.7 | 10.9 |
| Africa | 1,975 | 1,737 | 0.2 | 0.2 | -12.1 |
Source: Statistics Canada, Table 36-10-0008-01; retrieved on 24-06-2019
Compared to a decade ago, the distribution of foreign investors in Canada is slightly more diverse but still dominated by North America and Europe.
North America’s share of FDI stock declined 3.1 percentage points, mainly from the decline in the share of U.S. investors from 52% in 2009 to 46% in 2018, while Europe’s share increased 5.2 percentage points due to increasing investment from the Netherlands and Luxembourg.
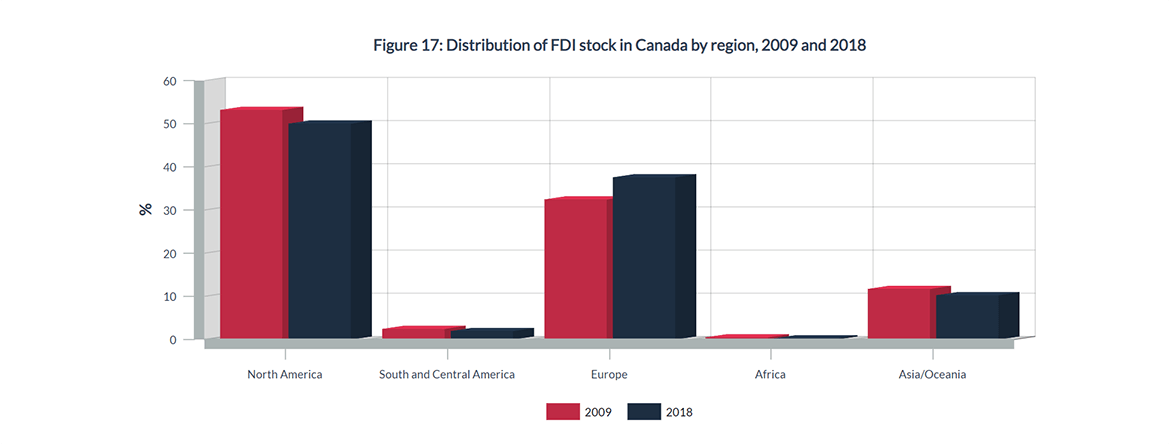
Source: Statistics Canada, Table 36-10-0008-01; retrieved on 24-06-2019
Long description
Figure 17: Distribution of FDI stock in Canada by region, 2009 and 2018
| 2009 | 2018 | |
|---|---|---|
| North America (in %) | 53.06 | 50.00 |
| South and Central America (in %) | 2.32 | 1.98 |
| Europe (in %) | 32.42 | 37.57 |
| Africa (in %) | 0.42 | 0.20 |
| Asia/Oceania (in %) | 11.78 | 10.25 |
By industry, over 40% of the overall increase in Canada’s inward FDI stock in 2018 came from manufacturing, which added $17 billion (+9.4%) to reach $202 billion in 2018 and reinforce its number one spot with a 23% share of the total FDI stock. Investment in agriculture, forestry, fishing and hunting reached historic levels last year, by expanding nearly 26 times over from $182 million in 2017 to $4.7 billion in 2018. Growing FDI in the finance and insurance sector, which was responsible for approximately one quarter of total FDI stock growth in 2017, only contributed 7.5% of FDI stock growth in 2018.
The information and communication technologies (ICT) sector is a specialized R&D-intensive category that is an important driver of productivity growth. Although FDI stock in Canada’s ICT sector expanded 21% to reach $16 billion in 2018, its share of total FDI stock has been trending downward since the early 2000s, from a peak of 9.7% in 2000 to only 1.8% in 2018.

Table 18: Foreign direct investment stock in Canada, by industry
| 2017 ($M) | 2018 ($M) | Share 2017 (%) | Share 2018 (%) | Change (%) | |
|---|---|---|---|---|---|
| Total, all industries | 834,757 | 876,856 | 100.0 | 100.0 | 5.0 |
| Agriculture, forestry, fishing and hunting | 182 | 4,698 | 0.0 | 0.5 | 2,481.3 |
| Mining and oil and gas extraction | 173,700 | 175,543 | 20.8 | 20.0 | 1.1 |
| Utilities | 1,510 | 1,356 | 0.2 | 0.2 | -10.2 |
| Construction | 3,566 | 4,300 | 0.4 | 0.5 | 20.6 |
| Manufacturing | 184,915 | 202,352 | 22.2 | 23.1 | 9.4 |
| Wholesale trade | 72,166 | 78,084 | 8.6 | 8.9 | 8.2 |
| Retail trade | 34,253 | 33,979 | 4.1 | 3.9 | -0.8 |
| Transportation and warehousing | 13,702 | 14,219 | 1.6 | 1.6 | 3.8 |
| Information and cultural industries | 3,928 | 5,728 | 0.5 | 0.7 | 45.8 |
| Finance and insurance | 132,096 | 135,250 | 15.8 | 15.4 | 2.4 |
| Real estate, rental and leasing | 12,820 | 15,032 | 1.5 | 1.7 | 17.3 |
| Professional, scientific and technical services | 18,042 | 19,031 | 2.2 | 2.2 | 5.5 |
| Management of companies and enterprises | 172,286 | 174,756 | 20.6 | 19.9 | 1.4 |
| Accommodation and food services | 3,964 | 4,343 | 0.5 | 0.5 | 9.6 |
| All other industries | 7,627 | 8,186 | 0.9 | 0.9 | 7.3 |
| Information and communication technologies (ICT)Footnote 15 | 13,275 | 16,060 | 1.6 | 1.8 | 21.0 |
Source: Statistics Canada, Table 36-10-0009-01; retrieved on 24-06-2019
In line with international standards, statistics on source countries of FDI have traditionally been compiled according to the immediate investing country (IIC), which is the last country through which the FDI transited before entering the domestic economy. While this measure is appropriate for evaluating the direct investment flows and corresponding funds exchanged between countries, it does not shed light on the real FDI source country where the ultimate investor originates. Measuring FDI according to the ultimate investor country (UIC) attempts to rectify this problem.
The U.S. share of Canadian FDI by UIC is 51%, larger than its 46% share of FDI by IIC. The United Kingdom, Japan, Switzerland and Brazil round off the rest of the top five UIC rankings, and all these countries rank higher under UIC than under IIC. On the other hand, three of the top five countries under IIC ranking, such as the Netherlands and Luxembourg, play a smaller role in Canadian FDI under UIC ranking. Under UIC, China accounted for 3.3% of Canadian FDI (sixth in the ranking), compared to IIC, where it accounted for 1.9% (ninth in the ranking).
Table 19: Canadian FDI by ultimate investor country (UIC) vs. immediate investing country (IIC), 2017
| UIC Rank | Country | Share (%) | IIC Rank | Country | Share (%) |
|---|---|---|---|---|---|
| 1 | United States | 51.2 | 1 | United States | 46.3 |
| 2 | United Kingdom | 6.3 | 2 | Netherlands | 12.2 |
| 3 | Japan | 4.7 | 3 | Luxembourg | 6.5 |
| 4 | Switzerland | 3.5 | 4 | United Kingdom | 5.6 |
| 5 | Brazil | 3.3 | 5 | Switzerland | 5.3 |
| 6 | China | 3.3 | 6 | Japan | 3.4 |
| 7 | Germany | 3.2 | 7 | Hong Kong SAR | 2.4 |
| 8 | Luxembourg | 2.7 | 8 | Germany | 2.0 |
| 9 | Netherlands | 2.4 | 9 | China | 1.9 |
| 10 | France | 2.1 | 10 | Bermuda | 1.9 |
Source: Statistics Canada, Table 36-10-0433-01 and Table 36-10-0008-01; retrieved on 20-06-2019
In 2018, CDIA presented a completely different picture compared to inflows. CDIA fell 38% to $64 billion, with M&A decreasing by 48%, or $31 billion, and divestment in other flows growing to over $15 billion.
Decreasing CDIA was mostly due to lower investment in the United States, down 60% to $33 billion, mainly caused by the decline in M&A (-77%). In contrast, CDIA flows to the rest of the world surged, up 48%, or $10 billion (almost entirely due to increases in M&A). As a result, the share of CDIA to the United States accounted for only 51% of overall CDIA outflows in 2018, down from nearly 80% the previous year.
By sector, unlike in the previous year, Canadian investors diverted investment from every sector to energy and mining, and manufacturing, adding $13 billion and $10 billion, respectively. Trade and transportation lost the top spot for Canadian investors, as investment flows into this sector were cut by 68% to $18 billion in 2018. As a result, finance and insurance became the new number one sector as CDIA flows declined relatively less, by 12%, to $25 billion.
Table 20: Flows of Canadian direct investment abroad
| 2017 ($M) | 2018 ($M) | Change (%) | Change ($M) | |
|---|---|---|---|---|
| To the world | ||||
| Total net flows | 103,591 | 64,277 | -38.0 | -39,314 |
| Mergers and acquisitions | 64,846 | 33,654 | -48.1 | -31,192 |
| Reinvested earnings | 39,312 | 45,980 | 17.0 | 6,668 |
| Other flows | -568 | -15,358 | n/a | -14,790 |
| To the United States | ||||
| Total net flows | 82,492 | 32,944 | -60.1 | -49,548 |
| Mergers and acquisitions | 58,657 | 13,638 | -76.7 | -45,019 |
| Reinvested earnings | 16,630 | 22,368 | 34.5 | 5,738 |
| Other flows | 7,205 | -3,061 | n/a | -10,266 |
| To the rest of the world | ||||
| Total net flows | 21,099 | 31,331 | 48.5 | 10,232 |
| Mergers and acquisitions | 6,188 | 20,018 | 223.5 | 13,830 |
| Reinvested earnings | 22,682 | 23,611 | 4.1 | 929 |
| Other flows | -7,774 | -12,297 | n/a | -4,523 |
| Sectors of CDIA outflows | ||||
| Energy and mining | -3,014 | 9,836 | n/a | 12,850 |
| Manufacturing | -3,558 | 6,889 | n/a | 10,447 |
| Trade and transportation | 56,571 | 17,893 | -68.4 | -38,678 |
| Finance and insurance | 28,310 | 24,935 | -11.9 | -3,375 |
| Management of companies and enterprises | 9,439 | 6,215 | -34.2 | -3,224 |
| Other industries | 15,842 | -1,491 | n/a | -17,333 |
Source: Statistics Canada, Tables 36-10-0025-01 and 36-10-0026-01; retrieved on 24-06-2019
The stock of CDIA grew for the ninth consecutive year. Following last year’s gain of 5.6%, Canadian investors added $122 billion (+10%) to their direct investment holdings abroad to reach a record high of $1,289 billion in 2018, with CDIA stock in both North America and Europe posting double-digit growth.
By country, the United States continued to be Canadian investors’ number one destination, with a CDIA position of $595 billion, or 46%, of the overall CDIA stock at the end of 2018. The United Kingdom remained the second-largest destination, with the CDIA stock expanding by 12% to reach $109 billion; Luxembourg, Barbados and Bermuda rounded out the top five. The stock of Canadian investment in Asia and Oceania grew at a relatively slower rate, up 4.3% to $89 billion in 2018. CDIA in Australia contracted slightly, but the stock of investment in other top Asian destinations grew faster the 10% average, as China, Hong Kong SAR, and Japan all recorded double-digit growth rates. By comparison, Canadians decreased their investments in South and Central America and Africa, down 1.0% and 1.5%, respectively.
Canadian investors increased their direct investment holdings abroad in all sectors except information and culture (down $6.2 billion to $38 billion). CDIA in finance and insurance led all sectors, up $53 billion (or 13%) to $471 billion, with half of the increase in the United States. This sector comprised 37% of the overall stock of CDIA in 2018. The transportation and warehousing sector CDIA stock position posted the second-largest growth, up $18 billion to $84 billion in 2018. Other sectors that saw significant growth in their CDIA stock were management of companies and enterprises (+11%), mining and oil and gas extraction (+5.4%), and manufacturing (+11%).
Table 21: Stock of Canadian direct investment abroad, by region
| 2017 ($M) | 2018 ($M) | Share 2017 (%) | Share 2018 (%) | Change (%) | |
|---|---|---|---|---|---|
| All countries | 1,167,243 | 1,288,869 | 100.0 | 100.0 | 10.4 |
| North America | 719,020 | 807,734 | 61.6 | 62.7 | 12.3 |
| United States | 524,976 | 594,994 | 45.0 | 46.2 | 13.3 |
| Barbados | 56,027 | 64,824 | 4.8 | 5.0 | 15.7 |
| Bermuda | 45,461 | 47,007 | 3.9 | 3.6 | 3.4 |
| Cayman Islands | 40,245 | 39,624 | 3.4 | 3.1 | -1.5 |
| Bahamas | 24,131 | 27,096 | 2.1 | 2.1 | 12.3 |
| Mexico | 19,534 | 22,495 | 1.7 | 1.7 | 15.2 |
| British Virgin Islands | 6,415 | 9,617 | 0.5 | 0.7 | 49.9 |
| Europe | 287,802 | 317,773 | 24.7 | 24.7 | 10.4 |
| United Kingdom | 97,611 | 109,331 | 8.4 | 8.5 | 12.0 |
| Luxembourg | 81,692 | 90,069 | 7.0 | 7.0 | 10.3 |
| Netherlands | 34,647 | 36,475 | 3.0 | 2.8 | 5.3 |
| Germany | 9,162 | 10,481 | 0.8 | 0.8 | 14.4 |
| Ireland | 9,200 | 9,969 | 0.8 | 0.8 | 8.4 |
| France | 6,743 | 7,395 | 0.6 | 0.6 | 9.7 |
| Asia and Oceania | 85,232 | 88,923 | 7.3 | 6.9 | 4.3 |
| Australia | 31,926 | 31,205 | 2.7 | 2.4 | -2.3 |
| China | 11,182 | 12,736 | 1.0 | 1.0 | 13.9 |
| Hong Kong SAR | 7,839 | 9,053 | 0.7 | 0.7 | 15.5 |
| Japan | 6,546 | 7,560 | 0.6 | 0.6 | 15.5 |
| South and Central America | 67,889 | 67,197 | 5.8 | 5.2 | -1.0 |
| Chile | 22,728 | 21,501 | 1.9 | 1.7 | -5.4 |
| Peru | 13,566 | 14,246 | 1.2 | 1.1 | 5.0 |
| Brazil | 14,006 | 14,119 | 1.2 | 1.1 | 0.8 |
| Africa | 7,300 | 7,190 | 0.6 | 0.6 | -1.5 |
Source: Statistics Canada, Table 36-10-0008-01; retrieved on 24-06-2019
Table 22: Stock of Canadian direct investment abroad, by industry
| 2017 ($M) | 2018 ($M) | Share 2017 (%) | Share 2018 (%) | Change (%) | |
|---|---|---|---|---|---|
| Total, all industries | 1,167,243 | 1,288,869 | 100.0 | 100.0 | 10.4 |
| Agriculture, forestry, fishing and hunting | 2,140 | 2,412 | 0.2 | 0.2 | 12.7 |
| Mining and oil and gas extraction | 184,758 | 194,727 | 15.8 | 15.1 | 5.4 |
| Utilities | 38,042 | 44,551 | 3.3 | 3.5 | 17.1 |
| Construction | 2,218 | 3,153 | 0.2 | 0.2 | 42.2 |
| Manufacturing | 93,444 | 103,271 | 8.0 | 8.0 | 10.5 |
| Wholesale trade | 23,279 | 25,316 | 2.0 | 2.0 | 8.8 |
| Retail trade | 12,752 | 13,060 | 1.1 | 1.0 | 2.4 |
| Transportation and warehousing | 66,816 | 84,460 | 5.7 | 6.6 | 26.4 |
| Information and cultural industries | 44,201 | 37,989 | 3.8 | 2.9 | -14.1 |
| Finance and insurance | 418,743 | 471,318 | 35.9 | 36.6 | 12.6 |
| Real estate, rental and leasing | 72,251 | 77,803 | 6.2 | 6.0 | 7.7 |
| Professional, scientific and technical services | 26,416 | 29,763 | 2.3 | 2.3 | 12.7 |
| Management of companies and enterprises | 154,172 | 171,311 | 13.2 | 13.3 | 11.1 |
| Accommodation and food services | 3,343 | 3,595 | 0.3 | 0.3 | 7.5 |
| All other industries | 24,668 | 26,141 | 2.1 | 2.0 | 6.0 |
| Information and communication technologies (ICT) | 17,774 | 18,975 | 1.5 | 1.5 | 6.8 |
Source: Statistics Canada, Table 36-10-0009-01; retrieved on 24-06-2019
Diversifying Canadian exports
Canada is a trading nation: in 2018, Canadian exports and imports of goods and services totalled $1.5 trillion, placing the share of trade in the economy at 66%. The Canadian economy, and by extension Canadians, gain from this trade in many ways, with the growth of trade linked to higher incomes and living standards (State of Trade, 2012). However, the large share of trade in the Canadian economy also raises Canada’s exposure to external shocks. This exposure can be mitigated through trade diversification.
There are several dimensions to trade diversification, with geographic and product diversification being the two most commonly thought of, and usually more so with regard to a country’s exports than with imports. Geographic diversification refers to the spread of destination markets for a country’s exports, while product diversification applies to the range of products being exported. Other dimensions include regional diversification (for instance, provincial spread of Canadian exporters), type of exporter (small, medium, and large enterprises), and diversity in ownership or control of an exporting firm, with women ownership and Indigenous ownership being two facets of this diversification dimension. This section of the State of Trade report presents research by the Office of the Chief Economist (OCE) and which shows that the first two dimensions (geographic and product) are important for mitigating Canada’s vulnerability to external shocks, but are not the only dimensions of trade diversification.

What does trade diversification mean?

At a
glance
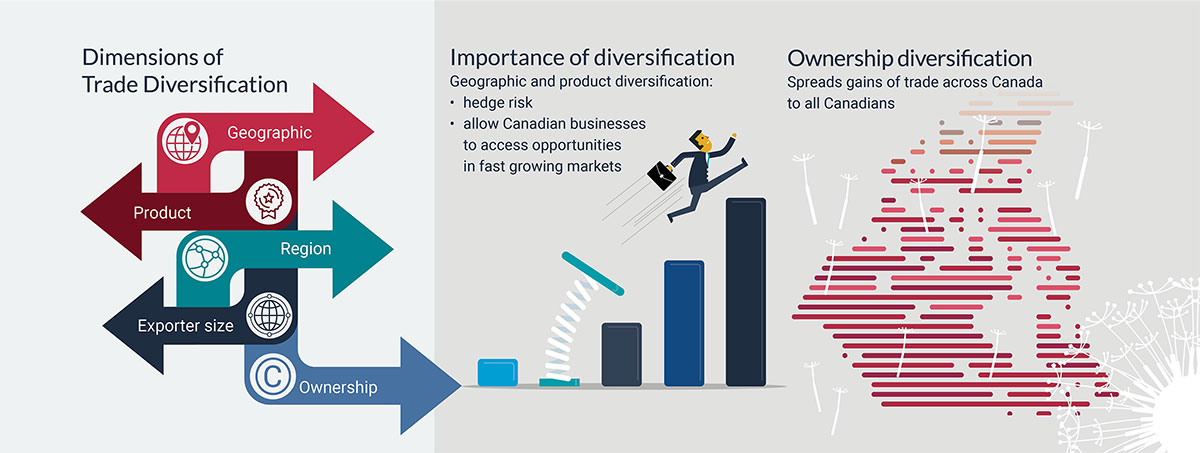
Long description
| Dimensions of Trade Diversification |
|---|
| Geographic |
| Product |
| Region |
| Exporter size |
| Ownership |
| Importance of diversification |
|---|
| Geographic and product diversification lets Canada hedge risks and allow Canadian businesses to access opportunities in fast growing markets |
| Ownership diversification spreads gains of trade across Canada to all Canadians |

Long description
| 2025 Target |
|---|
| Expand Canada's overseas exports by 50% by 2025 |
| Canadian exports are geographically concentrated | |
|---|---|
| Country | Geographic Concentration |
| Canada | Concentrated |
| Mexico | Concentrated |
| Jamaica | Moderate |
| Mauritania | Moderate |
| U.S. | Diverse |
| U.K. | Diverse |
| France | Diverse |
| Germany | Diverse |
| Norway | Diverse |
| Sweden | Diverse |
| Australia | Diverse |
| New Zealand | Diverse |
Trade diversification, or export diversification more specifically, is important because it helps mitigate a country’s exposure to shocks from abroad. Additionally, it allows Canadian exporters to take advantage of opportunities in new and expanding markets. Exactly how this is accomplished depends on the dimension of diversification considered.
Geographic diversification of exports helps hedge risks related to a particular export market; these risks can include, but are not limited to, political risks such as trade protectionist policies, country-specific economic shocks, and exchange rate volatility.Footnote 16 It is important to note that, much like using diversification to limit risk in portfolio investment, diversification will only mitigate unsystematic risk. In the case of geographic export diversification, spreading exports across a wide range of markets will limit an exporting country’s risk to specific events or actions in individual markets; it will not help mitigate systematic risk, i.e. risks that affect multiple markets at once. For example, in the global economic and financial crisis of 2007–2009, the vast majority of developed countries saw their economies contract, thus lowering their demand for imports. Following the crisis, Canadian goods and services exports saw a significant decline, dropping 21% from 2008 to 2009. The contraction in Canadian exports matched the global trend in declining trade at the time,Footnote 17 and greater geographic diversification of Canadian exports would likely have been of little help in mitigating Canada’s vulnerability to this systematic risk.
A greater geographic diversification of exports can also be beneficial to the Canadian economy in ensuring that Canadian exporters do not miss out on opportunities in emerging, fast-growing economies, and that Canadian exports are not overly focused on slower growing developed economies. Accessing new and fast-growing markets also provides a feedback effect of further diversifying Canadian exports; OCE research shows that entering fast-growing markets earlier gives an additional positive boost to exports in those markets. This research is discussed further in part two of this chapter.
Product diversification can also help abate risks from external shocks. In this case, exporting a wider range of products limits the exporting country’s exposure to risks from fluctuations in prices and shocks to demand or supply of specific products or services.Footnote 18 Once again, it is important to note this diversification is only a hedge against unsystematic risk, i.e. the risk of a negative shock to a specific or small subset of exported products.
Having a diverse range of export products and services also shields an exporting country from a problem often referred to as “Dutch disease”. This problem occurs when a single commodity makes up a large portion of a country’s exports. A sharp increase in external demand for the product may appreciate the country’s currency, making imports relatively cheaper and exports more expensive—both of which reduce the competitiveness of other industries and further concentrates the economy on the dominant export.
A final benefit of product diversification, again akin to geographic diversification, is that it allows greater access to new and fast-growing markets, but in this case product markets as opposed to geographic markets. The wider range of products exported will allow a country to take advantage of faster growing product sectors.
Diversification in the regional distribution of exporters, type of exporter, and ownership of exporting firms is important because these dimensions of diversification spread the gains from trade across Canada and among Canadians. For instance, firms that export have been shown to be more productive and, on average, pay higher wages than non-exporting firms (State of Trade, 2012). Having exporting firms dispersed across Canadian regions and communities will help economic benefits and opportunities distribute evenly throughout the country. Additionally, lowering barriers to exporting for small and medium firms will help them grow and prosper, while providing support for women-owned or Indigenous-owned enterprises to export will make the gains from trade more inclusive.
These different dimensions of diversification do not stand alone but intersect: each is related to the others and bolster their mutual benefits. For example, if a specific country impose a tariff on a specific Canadian export, the damage could be reduced by both geographic and product diversification. That said, it may not always be possible to achieve perfect diversification; every country has comparative advantages in producing certain products and services, and it is often economically efficient to specialize in producing some goods and services while importing those for which other countries have their own comparative advantages. Further, some regions of Canada will specialize in particular sectors, and the demand for these products may be stronger in some markets than others.
Box 1: Herfindahl-Hirschman Index (HHI)

Where Si is the share of nominal exports at time t and i can be market or product.
This index constructs a score from zero to one. The closer the index is to one, the more concentrated is Canada’s trade. For example, if Canada only traded with one country, the share of exports heading to that country would be 1 and the index would equal 1.0. Alternatively, if Canada’s trade was divided evenly between 100 different countries, the index would equal 0.01.
- Statistics Canada provides the following internationally accepted guidelines:
- Diversified export products or markets: HHI < 0.15
- Moderately concentrated products or markets: 0.15 ≤ HHI < 0.25
- Highly concentrated products or markets: HHI ≥ 0.25
With the benefits of diversification established, an important question is: how diversified are Canadian exports? This can be asked in regard to all dimensions of diversification, but for simplicity we will first look at the well-established concepts of geographic and product diversification and return to the other dimensions of diversification in part three of this chapter.
To assess the level of diversification in Canada’s trade requires a proper measure. While there are many ways one can measure diversification, the most common measure, which will be used here, is the Herfindahl-Hirschman Index (HHI). This measure of diversification is used by Statistics Canada, the United Nations, and the Organisation for Economic Co-operation and Development (OECD). Box 1 provides more details on the HHI.
Using this measure we find that, on a geographic basis, Canadian merchandise exports are highly concentrated (with an HHI of 0.57 in 2018). Scarffe (2019a) finds that Canada’s exports are the fourth most concentrated by destination out of 113 countries.Footnote 19 Based on the HHI, in 2017, only Kuwait, Bermuda, and Mexico had a higher geographic concentration of exports than Canada.Footnote 20 Moreover, compared to countries thought to have similar dependence issues, such as Hong Kong SAR with its dependence on China, and New Zealand with its dependence on Australia, Canada’s exports are much more concentrated (Scarffe, 2019b).
The geographic concentration of Canadian exports is not surprising given the high level of exports destined to the United States (Scarffe, 2019a). In fact, the HHI tracks the U.S. share of Canadian exports extremely closely—with a correlation of 0.9997. The HHI increases (a rise in concentration) when the U.S. share of Canadian exports rises, and the HHI decreases, becoming more diverse when the U.S. share declines. In 2018, the U.S. share of Canadian merchandise exports was 75%; while down from 87% in 2002, this is similar to levels seen in the early 90s (the U.S. share of Canadian exports was 75% in 1990).

Data: UN Comtrade
Source: Scarffe, 2019c
Long description
Geographic export concentration for 2017 (Measured by HHI)
| Rank | |||
|---|---|---|---|
| 1 | 0.819 | KWT | Kuwait |
| 2 | 0.665 | BMU | Bermuda |
| 3 | 0.641 | MEX | Mexico |
| 4 | 0.568 | CAN | Canada |
| 5 | 0.563 | CPV | Cape Verde |
| 6 | 0.497 | OMN | Oman |
| 7 | 0.438 | SLB | Solomon Islands |
| 8 | 0.356 | NIC | Nicaragua |
| 9 | 0.343 | NPL | Nepal |
| 10 | 0.313 | ALB | Albania |
| 11 | 0.307 | DOM | Dominican Republic |
| 12 | 0.306 | HKG | Hong Kong SAR, China |
| 13 | 0.284 | ABW | Aruba |
| 14 | 0.249 | SLV | El Salvador |
| 15 | 0.244 | ZMB | Zambia |
| 16 | 0.242 | PLW | Palau |
| 17 | 0.238 | MKD | Macedonia, FYR |
| 18 | 0.237 | JAM | Jamaica |
| 19 | 0.228 | MLI | Mali |
| 20 | 0.224 | SUD | Sudan |
| 21 | 0.220 | BLR | Belarus |
| 22 | 0.203 | MMR | Myanmar |
| 23 | 0.187 | HND | Honduras |
| 24 | 0.182 | BLZ | Belize |
| 25 | 0.175 | MRT | Mauritania |
| 26 | 0.174 | MOZ | Mozambique |
| 27 | 0.172 | WSM | Samoa |
| 28 | 0.151 | KGZ | Kyrgyz Republic |
| 29 | 0.151 | BRN | Brunei |
| 30 | 0.149 | COG | Congo, Rep. |
| 31 | 0.144 | FJI | Fiji |
| 32 | 0.143 | BWA | Botswana |
| 33 | 0.143 | TUN | Tunisia |
| 34 | 0.136 | PRY | Paraguay |
| 35 | 0.135 | NAM | Namibia |
| 36 | 0.133 | AUS | Australia |
| 37 | 0.130 | CZE | Czech Republic |
| 38 | 0.128 | AZE | Azerbaijan |
| 39 | 0.128 | BDI | Burundi |
| 40 | 0.127 | ARM | Armenia |
| 41 | 0.127 | ECU | Ecuador |
| 42 | 0.118 | LUX | Luxembourg |
| 43 | 0.116 | CHL | Chile |
| 44 | 0.117 | IRL | Ireland |
| 45 | 0.111 | ISL | Iceland |
| 46 | 0.110 | PER | Peru |
| 47 | 0.107 | MDG | Madagascar |
| 48 | 0.106 | ISR | Israel |
| 49 | 0.106 | TZA | Tanzania |
| 50 | 0.105 | PRT | Portugal |
| 51 | 0.105 | COL | Colombia |
| 52 | 0.103 | JOR | Jordan |
| 53 | 0.101 | URY | Uruguay |
| 54 | 0.097 | UGA | Uganda |
| 55 | 0.097 | HUN | Hungary |
| 56 | 0.097 | POL | Poland |
| 57 | 0.0967 | NZL | New Zealand |
| 58 | 0.097 | NOR | Norway |
| 59 | 0.096 | KOR | Korea, Rep. |
| 60 | 0.093 | GHA | Ghana |
| 61 | 0.093 | JPN | Japan |
| 62 | 0.092 | TGO | Togo |
| 63 | 0.092 | BOL | Bolivia |
| 64 | 0.091 | MDA | Moldova |
| 65 | 0.090 | PHL | Philippines |
| 66 | 0.089 | LKA | Sri Lanka |
| 67 | 0.084 | SVK | Slovak Republic |
| 68 | 0.084 | MNT | Montenegro |
| 69 | 0.083 | ROM | Romania |
| 70 | 0.081 | DZA | Algeria |
| 71 | 0.081 | NLD | Netherlands |
| 72 | 0.080 | BEL | Belgium |
| 73 | 0.080 | NGA | Nigeria |
| 74 | 0.079 | KAZ | Kazakhstan |
| 75 | 0.078 | BIH | Bosnia and Herzegovina |
| 76 | 0.078 | BRA | Brazil |
| 77 | 0.078 | SVN | Slovenia |
| 78 | 0.077 | MUS | Mauritius |
| 79 | 0.076 | CMR | Cameroon |
| 80 | 0.072 | EST | Estonia |
| 81 | 0.072 | USA | United States |
| 82 | 0.072 | DNK | Denmark |
| 83 | 0.072 | GEO | Georgia |
| 84 | 0.071 | SEN | Senegal |
| 85 | 0.070 | LVA | Latvia |
| 86 | 0.070 | SGP | Singapore |
| 87 | 0.069 | MYS | Malaysia |
| 88 | 0.069 | CYP | Cyprus |
| 89 | 0.068 | HRV | Croatia |
| 90 | 0.066 | CHN | China |
| 91 | 0.066 | CHE | Switzerland |
| 92 | 0.066 | EUN | European Union |
| 93 | 0.065 | IDN | Indonesia |
| 94 | 0.060 | LTU | Lithuania |
| 95 | 0.059 | SER | Serbia, FR(Serbia/Montenegro) |
| 96 | 0.058 | ESP | Spain |
| 97 | 0.056 | RUS | Russian Federation |
| 98 | 0.056 | PAK | Pakistan |
| 99 | 0.056 | FRA | France |
| 100 | 0.055 | FIN | Finland |
| 101 | 0.054 | BGR | Bulgaria |
| 102 | 0.053 | KEN | Kenya |
| 103 | 0.053 | GBR | United Kingdom |
| 104 | 0.051 | SWE | Sweden |
| 105 | 0.050 | ARG | Argentina |
| 106 | 0.048 | IND | India |
| 107 | 0.048 | ITA | Italy |
| 108 | 0.043 | DEU | Germany |
| 109 | 0.040 | EGY | Egypt, Arab Rep. |
| 110 | 0.040 | ZAF | South Africa |
| 111 | 0.040 | GRC | Greece |
| 112 | 0.035 | UKR | Ukraine |
| 113 | 0.035 | TUR | Turkey |
If the United States is excluded from the geographic HHI calculation, we find that Canada scores much better, with an index of 0.07, meaning that outside of the U.S. market, Canadian exports are diversified. Thus, for Canada to improve geographic diversity, Canadian exports need to be less concentrated on the United States. However, the concentration of Canadian exports to the United States is predicated on economic theory. The gravity model of trade tells us that economic size and geographic proximity are the most important determinants of bilateral trade patterns. Having a similar culture (indicated, for example, by language), a common land border, and a free trade agreement further draw Canadian exports to the United States. Also important, there are no other alternatives for Canadian exports nearby as the United States is the only country adjacent to Canada by land. The country that is in a situation closest to Canada, in terms of gravity model determinants, is Mexico—one of the few countries with an HHI higher than Canada. Hence, as with Mexico, it is only natural for Canadian exports to concentrate on the large economy within close proximity to the Canadian border. Thus, diversifying Canada’s exports will require additional and concerted efforts to work against the economic factors that pull Canadian exports toward the United States.
At the HS2 Footnote 21 product level, Canadian exports are found to be diversified, with an HHI score of 0.09 in 2018. This HHI score has changed little over the past 28 years, fluctuating between 0.07 and 0.12 since 1990, but always remaining under the 0.15 benchmark, and thus Canadian exports are considered diversified by product.
That Canadian exports are diversified by product may not have been the ex ante expectation since Canada is known for its energy and auto exports. These sectors are both critical to the Canadian economy, but because Canada’s overall exports are so large, they make up a relatively small share of exports; in 2018, their respective shares of exports were 22% and 14%.Footnote 22 The U.S. impact on Canadian exports is clear as Canada sends approximately 90% of both auto and energy sector exports to the United States. Again, this underlines how the product and geographic dimensions of diversification intersect.
An HHI indicating that Canadian exports are diversified by product does not mean that Canada is immune to industry-specific shocks. The price of Western Canada Select crude oil went from $US86.56/bbl in June 2014 to $US16.30/bbl in February 2016, causing a shallow recession that lasted two quarters and led the Bank of Canada to cut interest rates twice at the beginning of 2015.Footnote 23 Yet, Canada’s export diversity by product meant that the oil price shock only led to a small economic contraction, and Canada’s economy was able to adjust and resume growth despite the price of oil remaining low.
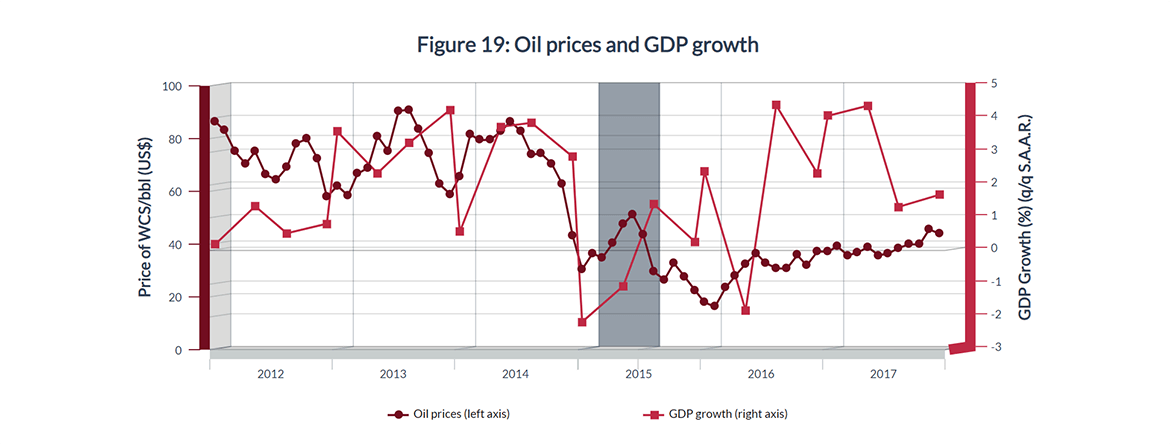
Data: Government of Alberta, Statistics Canada
Long description
Figure 19: Oil prices and GDP growth
| Date of Oil Prices | Oil Price of Western Canada Select per barrel, in US dollars | Quarter and year for GDP growth | GDP growth in % (measured quarter over quarter, seasonally adjusted annual rate) |
|---|---|---|---|
| Jan-12 | 86.47 | Q1 2012 | 0.19 |
| Feb-12 | 83.04 | Q2 2012 | 1.35 |
| Mar-12 | 75.01 | Q3 2012 | 0.53 |
| Apr-12 | 70.4 | Q4 2012 | 0.82 |
| May-12 | 75.1 | Q1 2013 | 3.61 |
| Jun-12 | 66.37 | Q2 2013 | 2.35 |
| Jul-12 | 64.28 | Q3 2013 | 3.27 |
| Aug-12 | 69.03 | Q4 2013 | 4.28 |
| Sep-12 | 78.17 | Q1 2014 | 0.57 |
| Oct-12 | 79.88 | Q2 2014 | 3.76 |
| Nov-12 | 72.47 | Q3 2014 | 3.88 |
| Dec-12 | 57.87 | Q4 2014 | 2.85 |
| Jan-13 | 62.11 | Q1 2015 | -2.16 |
| Feb-13 | 58.4 | Q2 2015 | -1.07 |
| Mar-13 | 66.72 | Q3 2015 | 1.41 |
| Apr-13 | 68.87 | Q4 2015 | 0.27 |
| May-13 | 80.93 | Q1 2016 | 2.40 |
| Jun-13 | 75.39 | Q2 2016 | -1.81 |
| Jul-13 | 90.5 | Q3 2016 | 4.41 |
| Aug-13 | 90.97 | Q4 2016 | 2.35 |
| Sep-13 | 83.57 | Q1 2017 | 4.09 |
| Oct-13 | 74.21 | Q2 2017 | 4.40 |
| Nov-13 | 62.62 | Q3 2017 | 1.33 |
| Dec-13 | 58.95 | Q4 2017 | 1.70 |
| Jan-14 | 65.69 | ||
| Feb-14 | 81.54 | ||
| Mar-14 | 79.42 | ||
| Apr-14 | 79.56 | ||
| May-14 | 82.72 | ||
| Jun-14 | 86.56 | ||
| Jul-14 | 82.73 | ||
| Aug-14 | 73.89 | ||
| Sep-14 | 74.35 | ||
| Oct-14 | 70.6 | ||
| Nov-14 | 62.87 | ||
| Dec-14 | 43.24 | ||
| Jan-15 | 30.43 | ||
| Feb-15 | 36.52 | ||
| Mar-15 | 34.76 | ||
| Apr-15 | 40.26 | ||
| May-15 | 47.5 | ||
| Jun-15 | 51.29 | ||
| Jul-15 | 43.49 | ||
| Aug-15 | 29.48 | ||
| Sep-15 | 26.5 | ||
| Oct-15 | 32.78 | ||
| Nov-15 | 27.78 | ||
| Dec-15 | 22.51 | ||
| Jan-16 | 17.88 | ||
| Feb-16 | 16.3 | ||
| Mar-16 | 23.46 | ||
| Apr-16 | 27.88 | ||
| May-16 | 32.52 | ||
| Jun-16 | 36.47 | ||
| Jul-16 | 32.8 | ||
| Aug-16 | 30.9 | ||
| Sep-16 | 30.62 | ||
| Oct-16 | 35.83 | ||
| Nov-16 | 31.89 | ||
| Dec-16 | 37.18 | ||
| Jan-17 | 37.19 | ||
| Feb-17 | 39.14 | ||
| Mar-17 | 35.68 | ||
| Apr-17 | 36.84 | ||
| May-17 | 38.84 | ||
| Jun-17 | 35.8 | ||
| Jul-17 | 36.37 | ||
| Aug-17 | 38.5 | ||
| Sep-17 | 39.93 | ||
| Oct-17 | 39.87 | ||
| Nov-17 | 45.52 | ||
| Dec-17 | 44.02 |

Data: Statistics Canada, Table 36-10-0014-01
Long description
Figure 20: Value of Canada's overseas goods and services exports, based on historical growth (in $ Billion)
| 2011 | 2012 | 2013 | 2014 | 2015 | 2016 | 2017 | 2018 | 2019 | 2020 | 2021 | 2022 | 2023 | 2024 | 2025 | |
|---|---|---|---|---|---|---|---|---|---|---|---|---|---|---|---|
| Historical | 165.7 | 164.3 | 163.3 | 172.1 | 173.0 | 177.4 | 189.3 | 206.8 | |||||||
| 2000-2017 Growth rate (4.3 %) | 189.3 | 197.4 | 205.8 | 214.5 | 223.7 | 233.2 | 243.1 | 253.5 | 264.3 | ||||||
| 2011-2017 Growth rate(2.2 %) | 189.3 | 193.6 | 197.9 | 202.4 | 206.9 | 211.6 | 216.3 | 221.2 | 226.2 | ||||||
| 2000-2008 Growth rate (6.4 %) | 189.3 | 201.5 | 214.4 | 228.1 | 242.7 | 258.3 | 274.8 | 292.4 | 311.2 | ||||||
| Target | 284 | ||||||||||||||
The Canadian government has recognized the need to further diversify Canadian exports. In its Fall Economic Statement (FES) 2018, the government launched an export diversification strategy, with a target of increasing Canada’s overseasFootnote 24 exports by 50% by 2025. As stated in the FES, “The Export Diversification Strategy will invest $1.1 billion over the next six years, starting in 2018-19, to help Canadian businesses access new markets.
The Strategy will focus on three key components: investing in infrastructure to support trade, providing Canadian businesses with resources to execute their export plans, and enhancing trade services for Canadian exporters”.Footnote 25

Data: Statistics Canada Table 36-10-0014-01, Oxford Economics Global Forecast November 2018, Conference Board Forecast March 2018.
Long description
Figure 21: Forecast scenarios for growth in Canada's overseas goods and services exports (in $ Billion)
| 2011 | 2012 | 2013 | 2014 | 2015 | 2016 | 2017 | 2018 | 2019 | 2020 | 2021 | 2022 | 2023 | 2024 | 2025 | |
|---|---|---|---|---|---|---|---|---|---|---|---|---|---|---|---|
| Historical | 165.7 | 164.3 | 163.3 | 172.1 | 173.0 | 177.4 | 189.3 | 206.8 | |||||||
| Oxford Economics Forecast | 197.9 | 203.3 | 209.9 | 216.8 | 223.8 | 231.0 | 238.5 | 246.3 | |||||||
| Historical Growth Rate Forecast | 193.6 | 197.9 | 202.4 | 206.9 | 211.6 | 216.3 | 221.2 | 226.2 | |||||||
| Conference Board Forecast | 203.3 | 212.0 | 223.9 | 235.8 | 247.7 | 260.1 | 271.4 | 283.2 | |||||||
| Target | 284 | ||||||||||||||
To attain this target, Canada’s overseas exports of goods and services need to reach $284 billion by 2025, requiring an average annual growth rate of 5.2% from 2017.Footnote 26 Tran (2019a) looked at both historical growth and leading forecasts to analyze the prospect of reaching the target set in the Fall Economic Statement 2018.
As this analysis was undertaken before 2018 data was available, it looks at historical growth up to 2017 and extends this growth from 2017 to 2025. Figure 20 shows three scenarios of extended historical growth using different historical growth periods. Between 2000 and 2017, Canadian overseas goods and services exports grew 4.3% per year. If this growth trend is extended out to 2025, Canadian overseas exports would reach $264 billion, $20 billion short of the $284 billion target. However, in the period prior to the global financial crisis (2000–2008), Canada increased its overseas exports by 6.4% per year; if we apply this growth rate out until 2025, Canadian exports to overseas markets would be $311 billion, $27 billion higher than the target. In more recent years (2011–2017), Canadian exports to overseas markets only grew by 2.2% per year, which, if extended to 2025, would give Canada $226 billion in overseas exports, $58 billion below the target.
For this OCE analysis, independent forecasts of Canadian goods and services exports from two leading economic forecasters, Oxford Economics and the Conference Board of Canada, were also used. Both forecasts expect global economic conditions between 2017 and 2025 to be more supportive of Canadian exports than global economic conditions prevailing between 2011 and 2017. According to Oxford Economics, Canadian overseas exports are expected to reach $246 billion by 2025, growing 3.3% per year from 2017.Footnote 27 This is $38 billion short of the 2025 target of $284 billion (see Figure 5). The Conference Board of Canada’s forecast points to a 5.2% per year growth in Canadian overseas exports, thus reaching $283 billion by 2025, just slightly below the target.
While global economic conditions are forecasted to be more supportive between 2017 and 2025 than in the recent past, risks to the forecast exist. First, the difference between U.S. GDP growth and overseas GDP growth will be a driving factor to overseas export growth. If overseas growth continues to underperform U.S. growth, Canadian businesses will more likely be drawn to the U.S. market, and overseas exports will underperform. Simply put, the better the U.S. economic performance, the harder it is for Canada to diversify exports. Second are the geopolitical risks and the fact that a developed economy like the United States tends to have lower geopolitical risks due to a strong legal and financial system, democratic institutions, and a market-based economy, in addition to strong historical ties with Canada. The opposite can be found in certain emerging overseas markets. Lastly, there are risks of trade disruption, as rising anti-trade sentiments have led to tensions among major economies in the world, many of which are Canada’s main trading partners. It is difficult to predict the outcome of trade tensions. Potential negative impacts could include disruptions to global value chains, declines in income and world demand, and the creation of competing trade blocs, all of which would harm Canadian exports. On the other hand, resolving the issues that led to rising tensions in the first place could create a stronger trade relationship that would be beneficial for global trade.
Chapter 3.1 Key Take-aways:
- There are several dimensions to trade diversification. These include but are not limited to: geographic, product, regional spread of exporters, type of exporter, and ownership.
- Canada has room to diversify, especially in the geographic dimension where currently Canadian exports are considered concentrated.
- The Canadian government has made trade diversification a goal, with the target of increasing overseas exports by 50% by 2025.

Chapter 3.2
What can we do to further diversify Canadian exports?


Long description
| Road to Diversification |
|---|
| 1. Lower trade barriers through FTAs - FTAs can reduce tariffs, quotas and non-tariff barriers |
| 2. Get in early on fast growth markets - Emerging market and developing economies grew annually by 9.1% between 2000 and 2018, far outpacing advanced economies. |
| 3. Diversify through U.S. - Most exporters move into new markets after exporting to the U.S. first |
| 4. Digital trade - Between 2006 and 2016, exports of ICT enabled services grew 67% |
| 5. Facilitate SMEs - In 2017, SME made up 99.8% of Canadian employer businesses but only 11.7% exported |
| 6. Cities - In 2030, 16 cities in the U.S. and 8 in China are projected to be among the top 40 cities of opportunity for Canadian businesses |
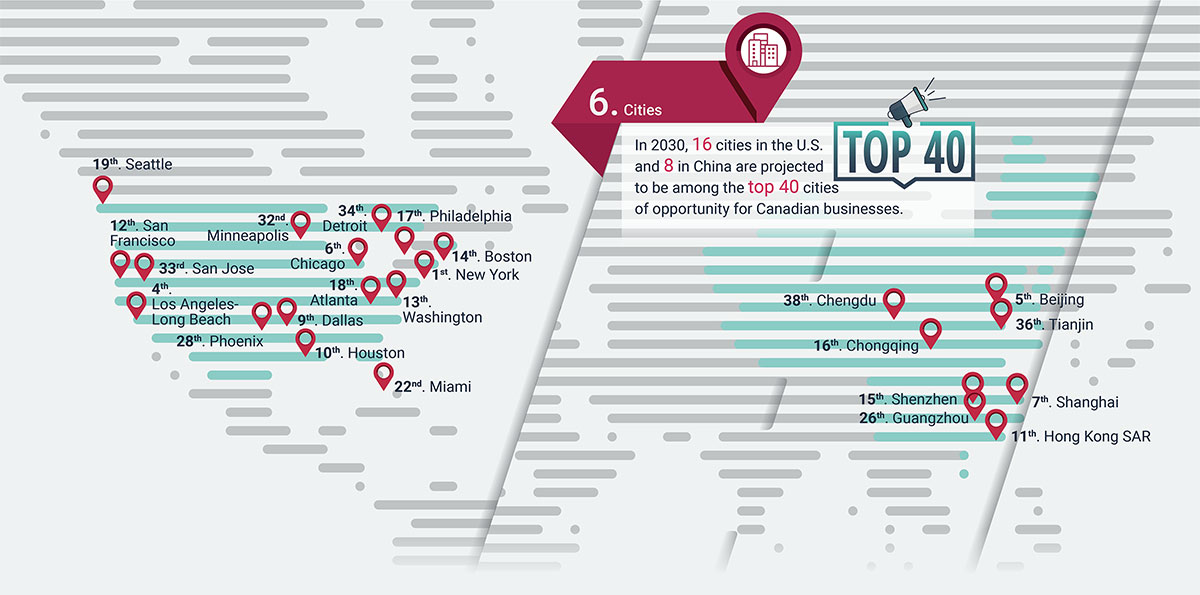
Long description
| Chinese cities in the top 40 |
|---|
| 5th. Beijing |
| 7th. Shanghai |
| 11th. Hong Kong |
| 15th. Shenzhen |
| 16th. Chongqing |
| 26th. Guangzhou, Guangdong |
| 36th. Tianjin |
| 38th. Chengdu, Sichuan |
| U.S. cities in the top 40 |
|---|
| 1st. New York |
| 4th. Los Angeles - Long Beach |
| 6th. Chicago |
| 9th. Dallas |
| 10th. Houston |
| 12th. San Francisco |
| 13th. Washington |
| 14th. Boston |
| 17th. Philadelphia |
| 18th. Atlanta |
| 19th. Seattle |
| 22nd. Miami |
| 28th. Phoenix |
| 32nd. Minneapolis |
| 33rd. San Jose |
| 34th. Detroit |
Countries don’t trade, firms and people within countries do. What the Canadian government can do is try to foster an environment that allows Canadian firms to engage in global markets and take advantage of the opportunities they present. The Government of Canada can also help reduce trade frictions (costs) by, for example, negotiating tariff reductions and harmonizing standards in trade agreements, providing exporters with market intelligence, or offering export insurance. The government can also help lower barriers faced by Canadian exporters and provide support and tools to aid Canadian firms looking to expand in markets abroad. The following looks at some possible ways in which Canadian exports could be further diversified.
Lowering trade barriers through free trade agreements
According to Global Affairs Canada, “Free Trade Agreements FTAs open markets to Canadian businesses by reducing trade barriers, such as tariffs, quotas or non-tariff barriers. They create more predictable, fair and transparent conditions for businesses operating in foreign countries. Canada’s FTAs cover substantially all trade between parties to the agreement. Many of Canada’s FTAs also go beyond ‘traditional’ trade issues to cover areas such as services, intellectual property and investment.”Footnote 28
With the implementation of the Canada-European Union Comprehensive Economic and Trade Agreement (CETA) and the ratification of the Comprehensive the Comprehensive and Progressive Agreement for Trans-Pacific Partnership (CPTPP), Canada has 14 FTAs with 51 countries. These FTA partners accounted for 62% of world GDP in 2018. By lowering barriers to trade, these FTAs can help diversify Canadian exports and expand overseas trade. Two recent OCE analytical reports looked at the benefits of FTAs to Canadian exporters; the first report analyzed the benefits from CETA, and the second investigated the benefits from the Canada-Korea Free Trade Agreement (CKFTA).Footnote 29
CETA entered into force on September 21, 2017. At the time, CETA was by far Canada’s most ambitious trade agreement since NAFTA, both due to the importance of the EU as a trading partner (collectively, the EU is Canada’s second-largest trading partner after the United States) and the scope of the agreement, which set new standards in trade of goods and services, non-tariff barriers, investment, and government procurement, as well as in other areas like labour and the environment.
Boileau (2018) analyzed the performance of Canadian merchandise exports to the EU for the first twelve months CETA was in force.Footnote 30 The analysis found that Canadian exports rose 3.8% (compared to the 12-month period a year earlier), and that if precious stones and metals (HS 71) were excluded, Canadian exports rose 13%. However, there were some sectors where Canadian exports to the EU saw much greater gains, the five largest being aluminum (up 280%), motor vehicles and parts (81%), inorganic chemicals (73%), mineral fuels and oil (63%) and miscellaneous base metals (56%).Footnote 31
The analysis also looked at the impact of the elimination or reduction of tariffs on Canadian merchandise exports to the EU.Footnote 32 The analysis revealed that products that saw the largest declines in tariffs as a result of CETA also showed the largest trade gains. Focusing on the same 12-month period, products exported from Canada to the EU with a greater than 5 percentage point (pp) tariff rate decline were up by 25% compared to products exported without any tariff reduction, which fell 4.3%.
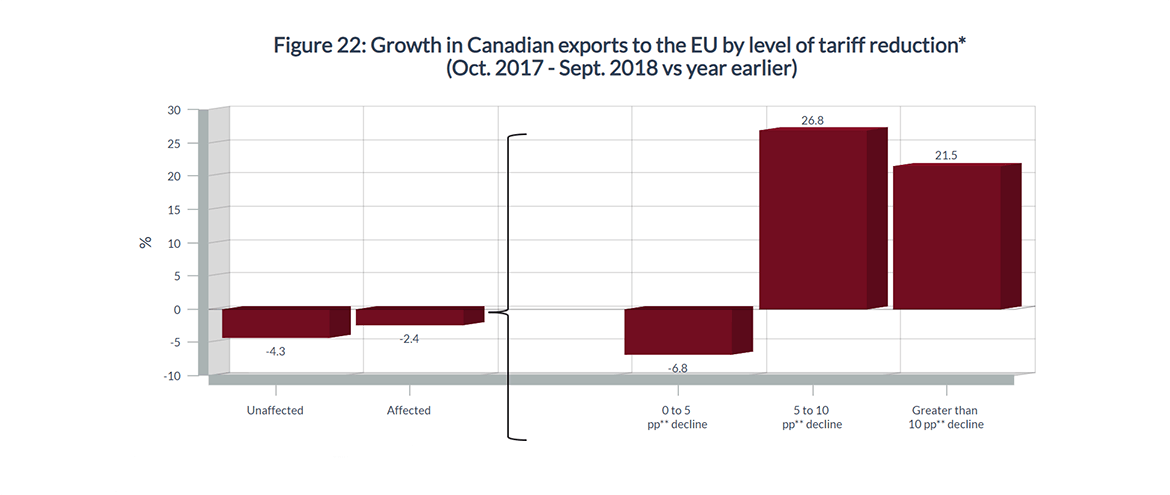
*Export increases were calculated using EU imports data from Eurostat
**Percentage point
Data: Eurostat, Office of the Chief Economist calculations
Long description
Figure 22: Growth in Canadian exports to the EU by level of tariff reduction (Oct. 2017 to Sept. 2018 compared to the same period a year before| Unaffected (%) | -4.3 |
| Affected (%) | -2.4 |
| 0 to 5 percentage points decline | -6.8 |
| 5 to 10 percentage points decline | 26.8 |
| Greater than 10 percentage points decline | 21.5 |
A closer look at the affected products (those on which tariffs were reduced or eliminated) showed that products subject to a 5 to 10 pp decrease in tariffs saw their exports to the EU increase 27%, while those with a greater than 10 pp tariff reduction saw exports rise 22%. Products with a 0 to 5 pp tariff decline fell by 6.8%. Further details on the products leading the gains in these categories can be found in the 2018 report posted on Global Affairs Canada’s website.
While the benefits from CETA are already evident, the agreement has only been in force since October 2017, and it can often take time for the gains from FTAs to accrue. The CKFTA, which entered into force January 1, 2015, offers a longer period to assess the benefits of an FTA.
Michaelyshyn and Yu (2019) analyzed the effect of the CKFTA on both Canadian exports and imports to/from South Korea over the four years the agreement has been in force (2015 to 2018). The analysis found that total merchandise exports from Canada to South Korea rose from $6.0 billion in 2014, the year prior to the CKFTA entering into force, to $7.5 billion in 2018, an increase of 25%, after overcoming initial declines in 2015 and 2016.Footnote 33 Canadian imports from Korea rose from $7.2 billion to $9.4 billion over the same period, up by 30%.
When looking at the impact of tariff cuts, the report found that exports of all affected products to Korea grew by 36% in the post-CKFTA period (2015 to 2018), compared to a rise of 22% in the pre-CKFTA period (2012 to 2014). Products with the highest tariff cuts had the strongest post-CKFTA growth. This can be observed for products that benefited from tariff reductions of over 10 pp. Exports of these products from Canada to Korea grew by 46% in the post-CKFTA period, compared to 3.4% in the pre-CKFTA period.
Looking at Canadian imports from Korea, the report found that both affected and unaffected products had similar growth in the post-CKFTA era. There was a strong increase in import growth of products that benefited from tariff reductions of 0.1 to 5 pp. Imports of these products grew by 46% in the post-CKFTA period, compared to 24% in the pre-CKFTA period. See Figure 7 for more details.
Table 23: Growth in trade between Canada and Korea by level of tariff reduction
Growth in Canadian Merchandise Exports to Korea
| Tariff Reduction (percentage point) | Between 2012 and 2014 ($ millions) | Between 2012 and 2014 (%) | Between 2015 and 2018 ($ millions) | Between 2015 and 2018 (%) |
|---|---|---|---|---|
| 0.1 to 5 | 160,6 | 22,0 | 608,9 | 100,9 |
| 5.1 to 10 | 194,7 | 26,7 | -54,2 | -5,4 |
| Above 10 | 7,1 | 3,4 | 110,0 | 46,2 |
| All affected products | 362,4 | 21,7 | 664,7 | 35,9 |
| All unaffected products | 392,4 | 11,0 | 1,718,0 | 53,3 |
| All products | 754,8 | 14,4 | 2 382,7 | 47,0 |
Data: Statistics Canada and Ministry of Strategy and Finance Korea
Growth in Canadian Merchandise Imports from Korea
| Tariff Reduction (percentage point) | Between 2012 and 2014 ($ millions) | Between 2012 and 2014 (%) | Between 2015 and 2018 ($ millions) | Between 2015 and 2018 (%) |
|---|---|---|---|---|
| 0.1 to 5 5 | 65,0 | 24,3 | 187,3 | 45,6 |
| 5.1 to 10 | 400,4 | 14,6 | 350,5 | 10,2 |
| Above 10 | 2,7 | 7,0 | 7,5 | 14,8 |
| All affected products | 468,1 | 15,3 | 545,3 | 14,0 |
| All unaffected products | 410,7 | 12,4 | 646,8 | 14,9 |
| All products | 878,8 | 13,8 | 1 192,2 | 14,5 |
* Export increases were calculated using Korean import data from the Ministry of Strategy and Finance Korea
Data: Statistics Canada and Ministry of Strategy and Finance Korea
Looking at Canadian imports from Korea, the report found that both affected and unaffected products had similar growth in the post-CKFTA era. There was a strong increase in import growth of products that benefited from tariff reductions of 0.1 to 5 pp. Imports of these products grew by 46% in the post-CKFTA period, compared to 24% in the pre-CKFTA period.
Both OCE analyses indicate that free trade agreements are effective means of lowering barriers for Canadian exporters to access foreign markets, with Canadian exports gaining in post-FTA periods, especially for products with higher tariff reductions. While Canada already has an extensive array ofFTA partners, entering into an FTA with countries that have not yet signed such agreements with Canada and deepening existing FTAs are other ways Canada may be able to help further diversify Canadian trade.
Global Affairs Canada is actively engaged in promoting CETA, CKFTA and Canada’s other free trade agreements to make sure Canadian exporters are aware of their benefits, and how their products and services would be treated under these agreements. Canadian companies are encouraged to visit Global Affairs Canada’s website to find out how they can benefit from CETA, CKFTA, CPTPP and Canada’s other free trade agreements.

Getting in early in fast-growing markets
A country’s economic size plays a large role in its demand for imports, and thus growth in a country’s imports is driven by its GDP growth. But not all countries grow at the same rate. GDP dataFootnote 34 indicates that world output expanded at an average annual rate of 5.2% between 2000 and 2018. However, there was a large disparity between growth in advanced economies, which posted an average rate of 3.7% over this period, and emerging market and developing economies,Footnote 35 which grew at a much faster rate of 9.1%. The two largest emerging markets, China and India, experienced real GDP average annual growth of 9.1% and 7.3%, respectively. Conversely, Canada’s main trading partner, the United States, grew at an annual average rate of 1.9% over the same period. One would presume that faster growing markets such as China and India would provide a great opportunity for Canada to further diversify its exports and gain from expanding GDP and demand for imports in these economies. While economic theory suggests that Canadian exports will naturally gravitate to large markets, Scarffe (2019c) investigates whether or not there is a benefit to trading with fast-growing economies; specifically, is there a benefit for Canada to make a strategic effort to increase exports to these economies, and is it better to access these markets early on in their growth.
The study uses a gravity model framework and preliminary results suggest that there are benefits to exporting to fast-growing economies; specifically over a five-year period, the study found that a 1 pp increase in the growth rate of a foreign country's product specific import market caused the level of Canadian exports to increase by 0.11%, and there was an additional gain of 0.16% if Canada was active in this market prior to its growth.Footnote 36 Based on these results, the study concluded that “considering the strong correlation between the growth of import markets and GDP growth, Canada should continue to encourage firms to trade with fast-growing emerging markets”.
Helping Canadian exporting firms engage with and navigate fast-growing emerging markets, particularly at early stages of their growth, appears to be another strategy that could help Canada further diversify its exports.
Diversifying through the United States
Encouraging Canadian exporters to engage in new and fast-growing markets is not a simple proposition. Firm-level research by Yu (2019) reveals particular patterns as to what paths Canadian exporters take to exporting to new markets. First, 70% of existing exporters sell to a single market, usually the United States. Then, only 20% sell to between two and five markets, and 9.3% sell to six or more markets.Footnote 37 These findings corroborate the research by Export Development Canada (EDC) which indicates that most Canadian exporters sell a select few products to only one export market (see Export Development Canada's findings on diversification “Patterns and benefits of Canadian export diversification”).
Each year, roughly 20% of Canadian exporters cease exporting and a somewhat larger number begin to export for the first time. Approximately 80% of new exporters are small and medium-sized enterprises (SMEs) that export to a single market and almost 70% of new exporters choose the United States as their first export destination. Survival rates for these first-time exporters are low with roughly half stopping exporting after their first year. Only 30% of first-time exporters are still exporting four years later, on average. The survival rates are even lower for exporters selling to more distant regions.Footnote 38 However, for exporters that became established, export levels rose rapidly (see Figure 23).

Data: Statistics Canada, Office of the Chief Economist calculations
Long description
Figure 23 : Average export value per firm after initial entry (in $ million)
| Series 1 | |
| Entry | 151 |
| Year 1 | 567 |
| Year 2 | 804 |
| Year 3 | 840 |
| Year 4 | 1109 |
| Year 5 | 1258 |
| Year 6 | 1414 |
Those exporters that survive begin to diversify into other markets beyond the United States. Each year, 20% of all exporters move into new markets. The diversification strategy of Canadian exporters predominantly takes the form of a series of sequential moves with the same product starting in the U.S. market followed by expansions to either Europe or Asia. This research highlights that the U.S. market is an important first market for most SME exports as well as a proving ground for many that go on to diversify into overseas markets.
What this firm-level research seems to be telling us is that few exporters (20%) move into new markets, and most move to a new market after exporting to the United States first. Although it may seem counterintuitive, a big piece of the puzzle for increasing Canada’s overseas exports may be to encourage and help new Canadian firms to first export to the United States.
Export Development Canada's findings on diversification
Patterns and benefits of Canadian export diversification
Export Development Canada (EDC) research* finds that most Canadian merchandise exporters (89%) sell to five or fewer markets, typically the United States. At the same time, most companies export only a few products, with 75% of exporters exporting five or fewer products.
However, the pattern for Canadian merchandise export value is quite different; most merchandise exports by value (42%) are generated by a small subset of firms (4%) that export many products (11+) to many export markets (11+).
Table A: Canadian merchandise exporters and exports, by number of markets and products (percentages of totals) Number of exporters
Number of exporters
| Number of export products | Number of export markets 1 to 5 | Number of export markets 6 to 10 | Number of export markets 11+ | Number of export markets Total |
|---|---|---|---|---|
| 1 to 5 | 72 % | 2 % | 1 % | 75 % |
| 6 to 10 | 10 % | 2 % | 1 % | 13 % |
| 11+ | 6 % | 2 % | 4 % | 12 % |
| Total | 89 % | 6 % | 6 % | 100 % |
Source: Statistics Canada and EDC Economics
Note: Annual averages using 2010-15 firm-level data.
Export values
| Number of export products | Number of export markets 1 to 5 | Number of export markets 6 to 10 | Number of export markets 11+ | Number of export markets Total |
|---|---|---|---|---|
| 1 to 5 | 13 % | 1 % | 2 % | 16 % |
| 6 to 10 | 8 % | 2 % | 3 % | 13 % |
| 11+ | 17 % | 11 % | 42 % | 71 % |
| Total | 38 % | 14 % | 47 % | 100 % |
Source: Statistics Canada data with EDC calculations
Note: Annual averages using 2010-15 firm-level data.
EDC research also finds that those exporters able to reach new markets and export more products exhibit superior firm performance.
Along with greater exports, they also have higher output, employ more workers and pay higher wages than firms of similar size and in similar industries that export to fewer markets or export fewer products.
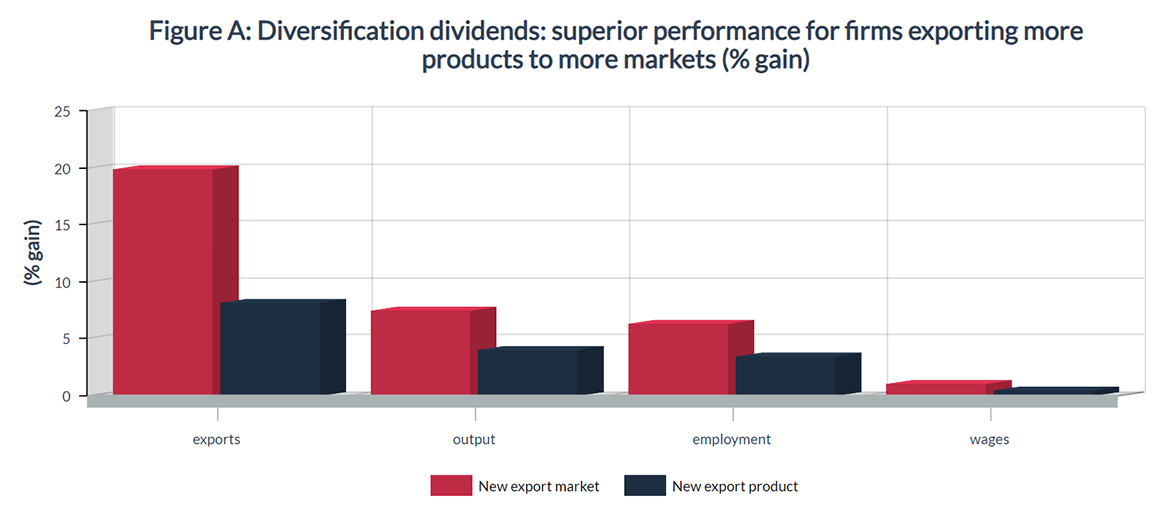
Source: Statistics Canada and EDC Economics
Note: Regression results controlling for year, industry and employment, using 2010-15 annual data.
* Tapp, Stephen and Yan, Beiling 2019 “Patterns and Benefits of Canadian Export Diversification”, Export Development Canada (EDC), Research and Analysis Department, work in progress.
Long description
Figure A: Diversification dividends: superior performance for firms exporting more products to more markets (% gain)
| New export market | New export product | |
| exports | 19.8 | 8.1 |
| output | 7.5 | 4 |
| employment | 6.3 | 3.4 |
| wages | 1 | 0.5 |
Digital trade and diversification
While it is important to look at past and current trends in how Canadian exporters access markets, we must also realize that the way Canadian firms export and reach foreign markets is ever changing and evolving. This may be truer today than ever before. The Internet, digital technologies and the movement of data within an economy and across borders are changing the nature of activities, patterns and actors in the economy at large, with notable implications for international trade in goods and services.
Research by Tran (2019b) has identified two major ways technology and digitization are affecting international trade: 1) digital technologies enable international trade through facilitating transactions and reducing costs; and 2) the Internet is also a delivery mode for international trade.

Digital trade-enabling technologies
Digital technologies enable trade through reductions in time and costs, in addition to being a channel that facilitates transaction processes. From a reduction in time and costs perspective, digital technologies have improved transportation and logistics, effectively shortening distances. Furthermore, new technologies facilitate more efficient route planning and allow exporters to make real-time adjustments en route. They also allow for optimizing storage and distribution networks. Digital technologies also make it easier to cross borders. With Electronic Data Interchange, exporters/importers can file documents electronically at the border, and Electronic Single Window lets exporters/importers submit all their documentation at one place instead of several, reducing time and costs. Moreover, digital technologies provide more and better information for both sellers (exporters) and buyers (importers) as the Internet makes it less costly to search, verify, track and translate information, which can potentially increase trust in cross-border transactions. Finally, advances in fintechFootnote 39 facilitate cross-border payments, making them cheaper and more secure. Along with time and cost reductions, the Internet also facilitates transaction processes by giving consumers the ability to order goods and services globally, either directly from a producer or via a digital platform.
The enabling effect of digital technologies may benefit trade in some goods more than others, potentially changing the composition and altering the product diversification of Canadian trade. The World Trade Organization identifies three types of goods that might benefit more from digital technologies’ enabling effect: time-sensitive, certification-intensive and contract-intensive goods. Examples of time-sensitive goods include intermediate goods in just-in-time inventory systems, perishable foods, and life-saving medical supplies. Cross-border trade in these types of products benefits from routing items more efficiently, predicting arrivals and even integrating artificial intelligence into the complex web of production and distribution.
Products that need certification benefit from reduced information asymmetries and search costs. While the Internet of Things, sensors, and blockchain technology can make the production and certification process more transparent, contract-intensive products can use digital technologies to increase trust (for example, with rating and matching systems), which reduces the need to use intermediaries as trust facilitators. Blockchain-smart contracts also have the potential to further enhance trust and reduce the need for inefficient paperwork.
Even with the enabling promise of the Internet and digital technologies, measurements need to catch up in order to improve our understanding of digital trade. Current measurements are either plagued with missing data, misallocated data, or are unable to capture certain aspects of digital trade. For example, current measurements capture all goods that cross a border, but are unable to identify whether or not these goods were digitally ordered. A similar problem exists for services, in addition to the fact that some services data are currently missing from the picture. For example, an individual Canadian delivering language translation services to foreigners over the Internet might not be included in current services trade statistics since these statistics focus on transactions by businesses.
The Internet as trade-enabler
The Internet is increasingly being used as a cross-border delivery method for digital goods and services. Due to the data limitations mentioned above, there is not a clear and comprehensive picture of digitally-delivered products trade, but some illustrative data show how information and communication technology (ICT) can enable greater trade in services.
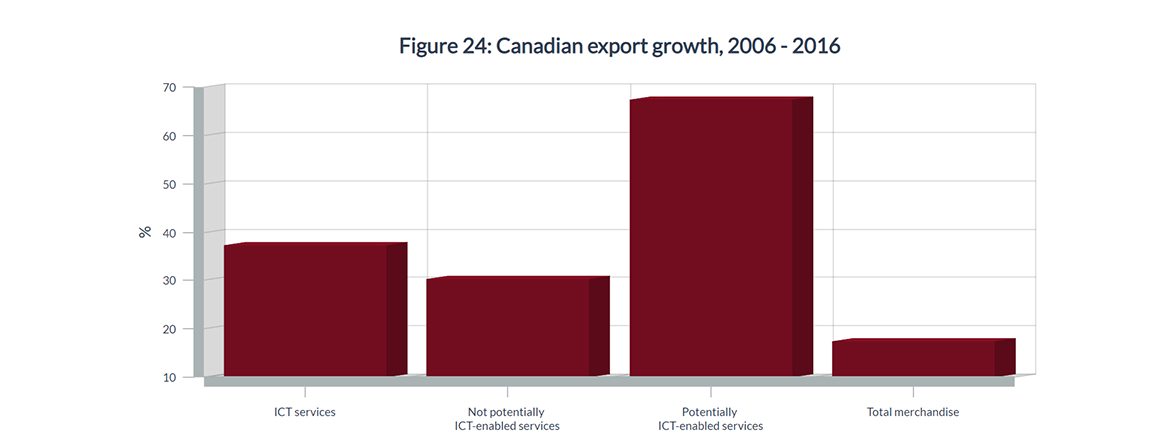
Data: Statistics Canada.
Long description
Figure 24: Canadian export growth (%) between 2006 and 2016
| ICT services | 37.3 |
| Not potentially ICT-enabled services | 30.2 |
| Potentially ICT-enabled services | 67.4 |
| Total merchandise | 17.4 |
Rostami (2018) identifies three types of services exports: ICT services, potentially ICT-enabled services, and not potentially ICT-enabled services.Footnote 40 The first category includes telecommunication services, computer services and charges for the use of intellectual property related to computer software. The second includes services that could potentially be delivered remotely over an ICT network (examples include insurance, financial services, information services, management services, advertising and related services, and research and development, to name a few). The third category includes services that are not likely to be exported over the Internet (e.g. maintenance/repair services, postal/courier services, construction, non-financial commissions, and equipment rental).
The report illustrates the impact of digitalization on Canadian exports. Between 2006 and 2016, Canadian exports of potentially ICT-enabled services grew 67%, compared to 37% for ICT services exports, 30% for not potentially ICT-enabled services exports, and 17% for total merchandise exports.
Digital technologies and the Internet are both enabling international trade, and many services (and even some goods) are delivered across borders through the Internet. This, in turn, is lowering the effect of distance on trade, and in some cases making it easier for exporters to reach distant markets. Accordingly, it is reasonable to look at digital trade as a useful tool for diversification and increasing overseas exports. Encouraging Canadian exporters to adopt digital technologies and ensuring that all Canadians have access to new and emerging technologies may be another path to diversification. Some early evidence shows that Canadian exporters are more likely to adopt technologies than non-exporters (although the impact of size on technology adoption and exporting status requires further analysis),Footnote 41 and according to Bédard-Maltais (2018), digitally advanced companies are 70% more likely to export.
SMEs and export diversification
A recent study by Sekkel (2019) looked at the participation of (SMEs) in international trade. Using the Survey on Financing and Growth of Small and Medium Enterprises as the main source of data, the report found that despite their great importance to the domestic market, SMEs in Canada have little participation in exporting.
Figure 25: Canadian SME Exporters, 2017
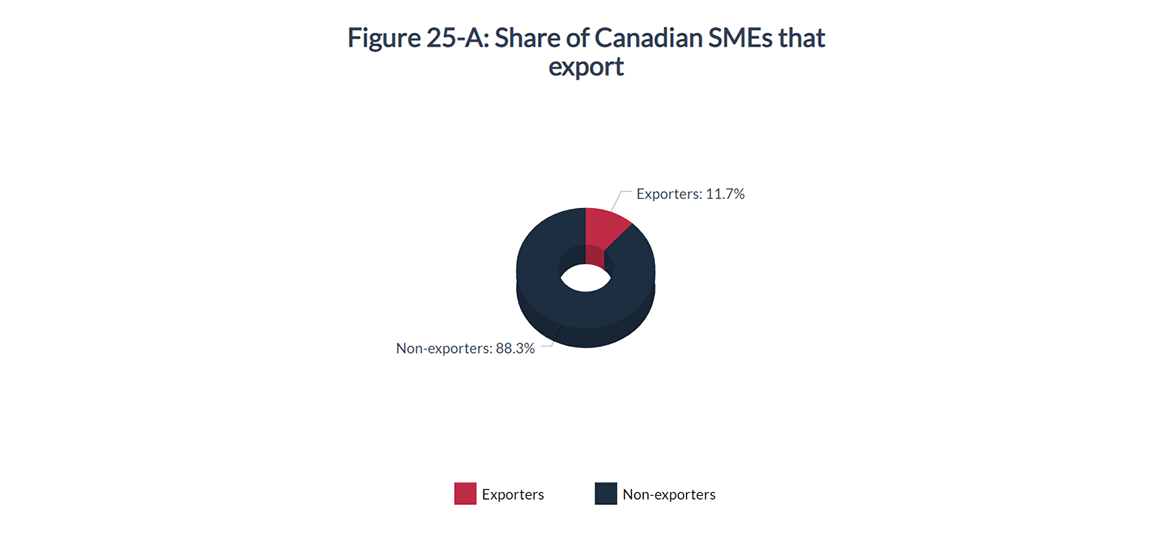
Data: Statistics Canada, Survey on Financing and Growth of Small and Medium Enterprises 2017
Long description
Figure 25-A: Share of Canadian SMEs that export (%)
| 2017 | |
|---|---|
| Non-Exporters | 88.3 |
| Exporters | 11.7 |
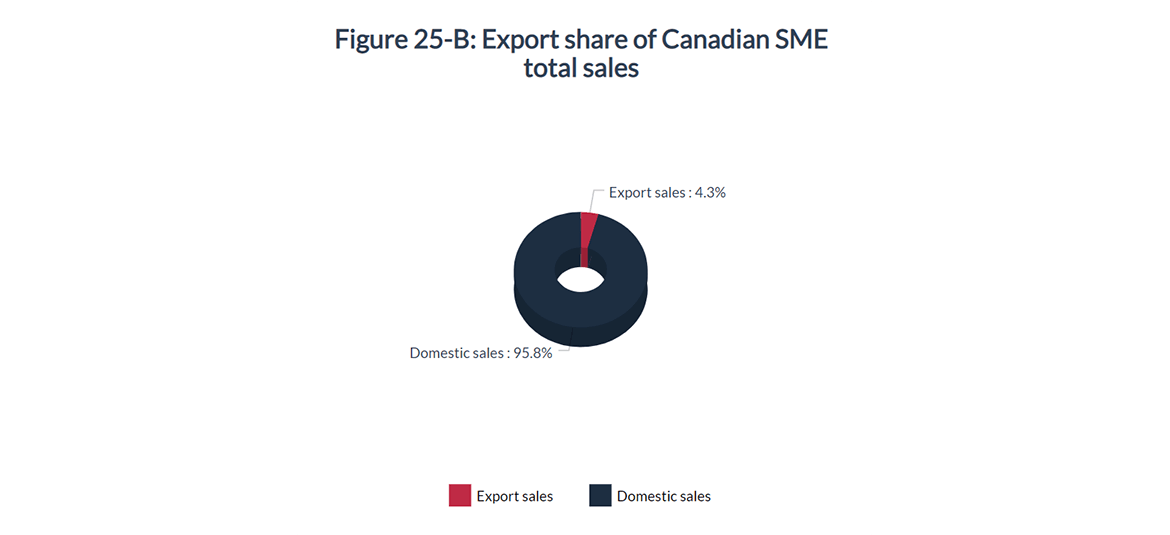
Data: Statistics Canada, Survey on Financing and Growth of Small and Medium Enterprises 2017
Note: Due to rounding, the total does not add up to 100%
Long description
Figure 25-B: Export share of Canadian SME total sales (%)
| 2017 | |
|---|---|
| Non-Exporters | 95.8 |
| Exporters | 4.3 |
Note: Due to rounding, the total does not add up to 100%
SMEs comprise the majority of Canadian companies and make a substantial contribution to the economy. In 2017, there were about 1.2 million SMEs in Canada, representing more than 99% of all employer businesses.Footnote 42 SMEs were responsible for 89% of all private sector jobs in 2017, and they accounted for about 50% of GDP between 2012 and 2014. The importance of SMEs to the overall economy is not unique to Canada. Globally, SMEs represent 95% of all firms, and they account for approximately 50% of GDP and around 60% of employment (World Trade Organization, 2016).
However, significant participation of SMEs in the overall economy is not reflected in exporting. In 2017, only 12% of SMEs, or 85,631 enterprises, exported goods or services outside of Canada.Footnote 43 This relatively low participation of SMEs in international trade is also observed in other OECD economies, where SMEs’ participation ranges between 10% and 25% (OECD, 2018).Footnote 44 Not only is the proportion of exporting SMEs low, but so too is their export intensity.Footnote 45 An average of 4% of the sales of SMEs resulted from exports of goods and services.
This study also identifies various challenges and barriers associated with international activities that smaller and less productive firms are less likely to overcome, relative to large firms. While trade agreements can be mostly effective in reducing tariffs and costs associated with non-tariff barriers, fixed costs such as advertisement and product distribution networks affect smaller firms disproportionately (OECD, 2018).
The international trade literature shows that even though larger and more productive firms have a higher likelihood of exporting (Bernard et al., 2007), there is also evidence of positive spillovers from participating in global markets, where exporters can enhance their productivity and innovation through learning-by-doing. While there is a great deal of heterogeneity among SMEs and opportunities to engage in global markets may not be perceived equally across sectors, the internationalization of SMEs as a policy objective can generate great benefits to the economy.
Encouraging SMEs to export could also help Canada realize its 2025 goal of increasing overseas exports by 50%. Although we have seen from Yu (2019) that most new exporters will first begin exporting to the United States, and many will not survive after one year of exporting, some will succeed and grow and reach out to further markets abroad. The vast number of SMEs in the Canadian economy represents an untapped source of exporters; while some, by their nature, can only focus on domestic markets (for example, restaurants and hair salons), others may be successful exporters waiting for the right opportunity. Government programs that help and support these SMEs could be a further means to diversify Canadian exports, not just along the geographic and product dimensions, but also in spreading the gains of exporting across Canada and among all Canadians.
Cities not countries
As for the geographic dimension of export diversification, the analysis so far has focused on the country level as the destination market of Canadian exports, as this is the common reference for geographic diversification and also the usual basis for tracking international trade statistics.Footnote 46 Yet, Vesselovsky (2019) points out that between now and 2030, cities will be the driving engines of growth and innovation.
To support Canada’s diversification strategy, the study assessed the future location of economic opportunities for Canadian businesses at the city level worldwide. The analysis takes into consideration the future economic growth of some 780 cities and Canada’s current economic ties with them.
The study found that in 2030, the top 40 global cities from a Canadian perspective will be dominated by the influence of the United States and China, which are projected to account for 40% and 20% of these cities, respectively. Regionally, Asia and Oceania are projected to account for 45% of the top 40 cities, leaving only 15% outside the U.S. or the Asia and Oceania regions. Among the top 100 global cities, the number of cities from the United States and China is projected to be approximately equal and account for just over half of the total. Regionally, Asia and Oceania are expected to account for almost half of the top 100 cities. Figure 11 presents the projected top 40 cities of importance to Canada in 2030.
Three key take-aways can be gleaned from this city-level analysis for Canada’s export diversification strategy. First, even in 2030, the United States remains important for Canada, with sixteen of the top 40 cities located there. Second, emerging markets are well represented in the top 40 cities; China in particular will have large fast-growing cities that will be important markets for Canadian goods and services. The third take-away is that diversification is not just about emerging markets. Canada can also diversify by further expanding its exports to some developed overseas markets: the United Kingdom, Japan, France and Australia all have major cities predicted to be of importance to Canada in the future.
Chapter 3.2 Key Take-aways:
- Lowering trade barriers through free trade agreements;
- Accessing fast growing markets early on;
- Diversifying through the United States;
- Encouraging Canadian exporters to adopt digital technologies;
- Facilitating SMEs in exporting; and
- Focus on cities as drivers of economic growth.
Figure 26: Top 40 cities in 2030 for Canada

Long description
In 2030, 16 cities in the U.S. and 8 in China are projected to be among the top 40 cities of opportunity for Canadian businesses
| U.S. cities in the top 40 |
|---|
| 1st. New York |
| 4th. Los Angeles - Long Beach |
| 6th. Chicago |
| 9th. Dallas |
| 10th. Houston |
| 12th. San Francisco |
| 13th. Washington |
| 14th. Boston |
| 17th. Philadelphia |
| 18th. Atlanta |
| 19th. Seattle |
| 22nd. Miami |
| 28th. Phoenix |
| 32nd. Minneapolis |
| 33rd. San Jose |
| 34th. Detroit |
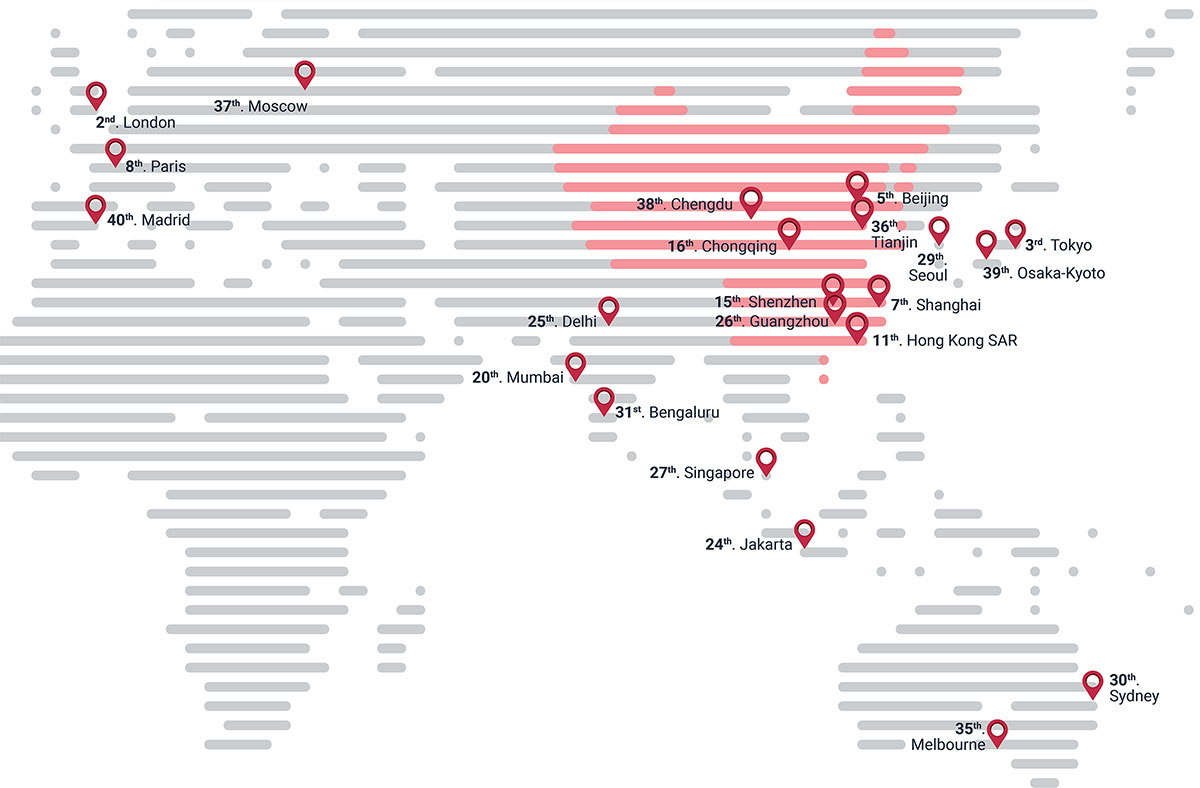
Long description
| Chinese cities in the top 40 |
|---|
| 5th. Beijing |
| 7th. Shanghai |
| 11th. Hong Kong |
| 15th. Shenzhen |
| 16th. Chongqing |
| 26th. Guangzhou, Guangdong |
| 36th. Tianjin |
| 38th. Chengdu, Sichuan |
New dimensions of export diversification

At a
glance
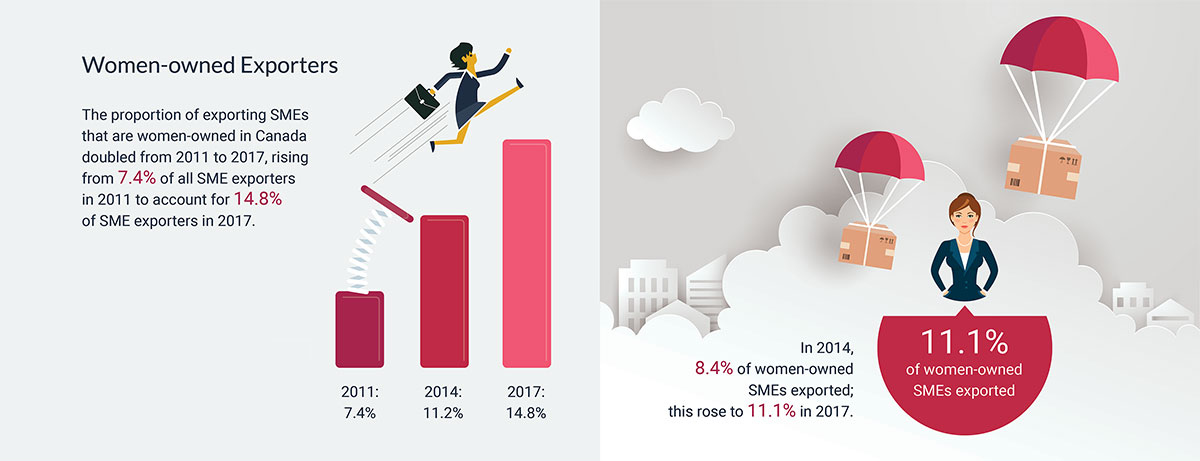
Long description
Women-owned Exporters: The proportion of exporting SMEs that are women-owned in Canada doubled from 2011 to 2017, rising from 7.4% of all SME exporters in 2011 to account for 14.8% of SME exporters in 2017.
In 2014, 8.4% of women-owned SMEs exported; this rose to 11.1% in 2017.
| Year | 2011 | 2014 | 2017 |
|---|---|---|---|
| Proportion of exporting SMEs that are women owned | 7.4% | 11.2% | 14.8% |

Long description
In 2017, the proportion of Men-owned SMEs that exported was 12.2%
In 2017, the proportion of Equally-owned SMEs that exported was 10.5%
In 2014, the Proportion of all Canadian SMEs that exported was 11.8%
In 2014, the Proportion of Indigenous-owned SMEs that exported24.4%
| Breakdown of Indigenous-owned Exporters by Destination Markets, 2014 | |
|---|---|
| Non-Exporters | 75.6% |
| Exporters | 24.4% |
| International non-U.S. only | 2.9% |
| U.S. only | 9.6% |
| Both U.S. and other international | 11.9% |
As mentioned at the beginning of this chapter, geographic and product diversification are not the only dimensions of diversification. Diversification in ownership of exporting firms is another one. While geographic and product diversification hedge against risk and encourages access to fast-growing markets, ownership diversification has the benefit of spreading the gains of exporting throughout Canada, to all Canadians. Two OCE studies look at exporter ownership. The first examines women-owned small and medium exporters, while the second, a joint research project with the Canadian Council for Aboriginal Business (CCAB), looks at Indigenous-owned exporters.
Women-owned exporters
Bélanger Baur (2019a) analyzed the characteristics and internationalization performance of Canadian exporting SMEs based on majority-gender ownership of the firm using data obtained from Statistics Canada’s Survey on Financing and Growth of Small and Medium Enterprises, 2017. The proportion of exporting SMEs that are women-owned in Canada doubled from 2011 to 2017, rising from 7.4% of all SME exporters in 2011 to 15% in 2017.
The study also indicated that, from 2014 to 2015, and without gaining a larger proportion of all SMEs in the domestic Canadian economy, women-owned SMEs increased their propensity to export such that they are no longer underrepresented among exporter SMEs. In 2014, 8.4% of women-owned SMEs exported; this proportion rose to 11% in 2017. In comparison, 12% of men-owned SMEs exported and 11% of equally-owned (by both men and women) SMEs participated in exporting in 2017.
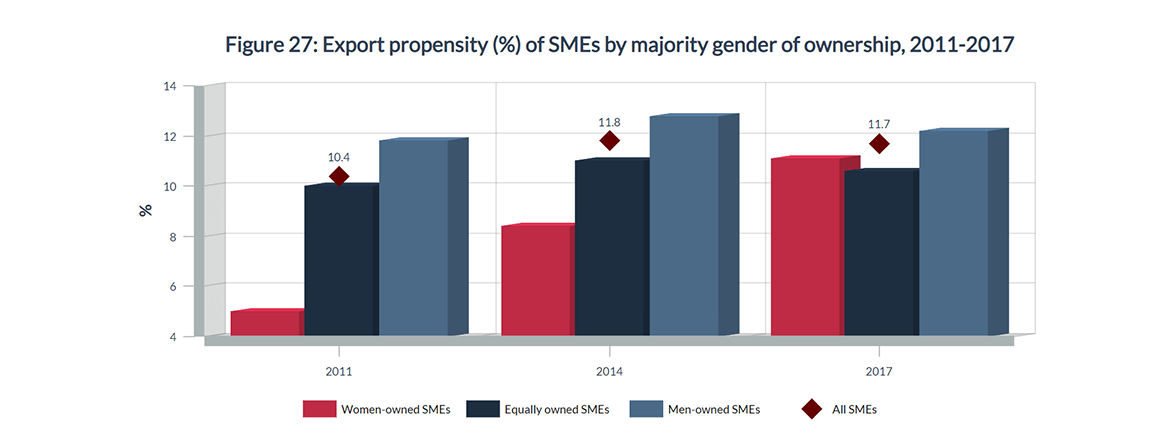
Note: The export propensity is the percentage of businesses that export. Data: Statistics Canada, Survey on Financing and Growth of Small and Medium Enterprises, 2011, 2014, 2017.
Long description
Figure 27: Export propensity (%) of SMEs by majority gender of ownership, 2011-2017
| Years | Women-owned SMEs | Equally owned SMEs | Men-owned SMEs | All SMEs |
|---|---|---|---|---|
| 2011 | 5 | 10 | 11.8 | 10.4 |
| 2014 | 8.4 | 11 | 12.8 | 11.8 |
| 2017 | 11.1 | 10.6 | 12.2 | 11.7 |
The study also looked at the barriers faced by SME exporters when trying to sell goods and services abroad. Although the Survey on Financing and Growth of Small and Medium Enterprises did not include gender-specific obstacles to exporting, the study found that gender-specific patterns were noticeable. Some 11% of women-owned SMEs reported domestic administrative obstacles as an important barrier to exporting at a greater rate, compared with 10% of men-owned SMEs and 7.6% of equally-owned SMEs. As such, there may be a number of domestic policies that could address barriers to exporting for women-owned SMEs. Additionally, men-owned SMEs report at a lesser rate foreign administrative obstacles to exporting as an important impediment to exports than both women-owned and equally-owned SMEs.
These administrative barriers outside of Canada may take a number of forms, including logistical issues and border obstacles, which women-owned SMEs reported to be important impediments to exporting, at a rate significantly higher than both their counterpart SMEs. The study suggested that federal programs designed to support the internationalization of women-owned SMEs could address the border export requirements of businesses as well as provide additional support with logistical issues.
Interestingly, coming back to the geographic diversification of exports, the study found that a significantly higher proportion of women-owned SMEs export to Europe (including the United Kingdom), India, and the rest of the world (not otherwise mentioned)Footnote 47 compared to men-owned SMEs and equally-owned SMEs. Thus, women-owned SMEs further contribute to the diversification agenda of the Government of Canada.Footnote 48

Indigenous-owned exporters
A joint study by the Office of the Chief Economist at Global Affairs Canada and the Canadian Council for Aboriginal Business (Bélanger Baur, 2019b) took a closer look at Indigenous-owned SMEs and their propensity to export.
The study capitalized on data produced by the CCAB using their organization’s register of 10,000 Indigenous-owned businesses, creating a sample of 1,101 Indigenous entrepreneurs, including nearly 650 Indigenous-owned SMEs. Using this unique data set, the author found that a high percentage of Indigenous-owned SMEs sell products and services internationally (24%), compared to Canadian non-Indigenous-owned SMEs (12%) and SMEs in other developed economies.
Footnote 49 The author further writes “Indigenous SMEs, based on these results, demonstrate a strong ability to access broader markets compared to non-Indigenous Canadian SMEs. Given that, according to The Canadian Encyclopedia, Indigenous communities are generally no larger than 1,000 individuals, we suspect Indigenous business strategies may include reaching non-local markets at an early stage, and that the additional cost to sell throughout a province and nationally is relatively small compared to selling to other nearby communities and cities. As such, Indigenous-owned SMEs, notably those owned by First Nations, once operating, would benefit from productivity gains through economies of scale and product specialization as they are forced to become more efficient and overcome challenges related to distance, logistics and connectivity at an early stage.”
Figure 28: Export activities of Indigenous-owned businesses, 2014

Data: Office of the Chief Economist calculations using data obtained from the Canadian Council for Aboriginal Business.
Long description
Figure 28-A : Share of Indigenous-owned businesses that export, 2014
| Non-Exporters | Exporters |
|---|---|
| 75,6% | 24,4 % |
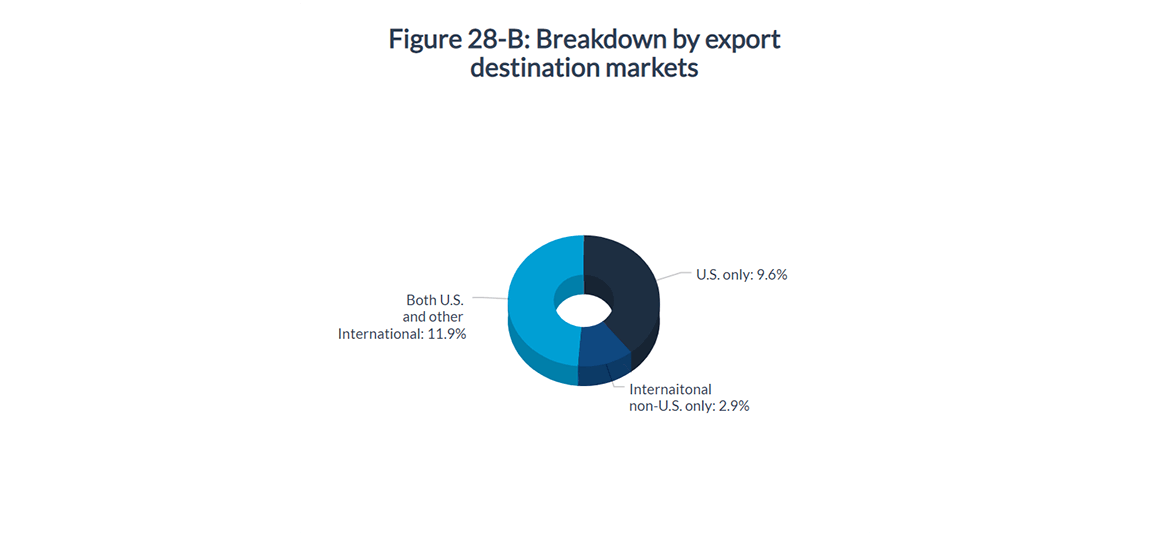
Data: Office of the Chief Economist calculations using data obtained from the Canadian Council for Aboriginal Business.
Long description
Figure 28-B :Breakdown of Indigenous exportings businesses by export destination markets, 2014
| U.S. only | International non-U.S. only | Both U.S. and other International |
|---|---|---|
| 9,6 % | 2,9 % | 11,9 % |
The author also looked at the destinations served by Indigenous-owned exporters and found that the most popular destination market of Indigenous-owned exporters, similar to non-Indigenous-owned Canadian exporters, was the United States, with 22% of Indigenous-owned SMEs selling goods or services to our southern neighbour. Nearly half sell exclusively to the United States, and the other 55% sell to both the United States and other international markets. A small proportion of Indigenous-owned SMEs (2.9%) sell internationally without also exporting to the United States.
More details on the characteristics of Indigenous-owned SMEs can be found in the joint study, including what types of industries Indigenous-owned SMEs are involved in, how these SMEs differ by Canadian region and by Indigenous identity (First Nations, Métis, Inuit). The study also identified obstacles to growth for Indigenous-owned SMEs, notably access to financing and connectivity issues, and how these businesses use social media. This study is the first of its kind to support the development and expansion of Indigenous-owned SMEs into the global trading system. While it indicates Indigenous-owned firms already have a high propensity to export, it also shows that their exports are focused on the United States. Like overall Canadian exports, Indigenous exports could gain from geographic diversification, and in turn having a robust Indigenous export community throughout Canada would help diversify the benefits of trade across the country and to all Canadians.
Chapter 3.3 Key Take-aways:
- Diversification in ownership of exporting firms is another dimension of trade diversification.
- While geographic and product diversification hedges against risk and encourages access to fast growing markets, ownership diversification has the benefit of spreading the gains of exporting throughout Canada, to all Canadians.
- The proportion of women-owned exporting SMEs in Canada doubled from 2011 to 2017, rising from 7.4% of all SME exporters in 2011 to account for 15% of SME exporters in 2017.
- A high percentage of Indigenous SMEs export goods and services (24.4%), compared to Canadian non-Indigenous SMEs (12%).
Conclusion
This chapter has looked at various dimensions of trade diversification, including geographic and product diversification as well as less traditional forms of diversification such as exporter ownership. These dimensions of diversification were shown to be important in hedging risk, allowing access to faster growing markets and helping better distribute the gains of trade.
While Canadian exports were found to be diversified by product, they are concentrated by geographic market. This is the impetus behind Canada’s goal of increasing overseas exports by 50% by 2025.
As for reaching the 2025 goal, chapter looked at various avenues to greater geographic diversity of Canadian exports. These included using free trade agreements to give Canadian exporters better access to foreign markets; accessing fast-growing markets early; using the U.S. market as a stepping stone to overseas markets; leveraging digital technologies; increasing SME participation in international trade; and focusing on cities’ future growth to identify new export opportunities. All of these areas appear promising for boosting Canadian export diversity and should be considered further in the Government of Canada’s trade diversification strategy.
Finally, the chapter investigated a new dimension of trade diversification, that of exporter ownership, summarizing two reports on women-owned exporters and Indigenous-owned exporters, respectively. In both cases, the studies are a good first step in identifying the characteristics of these exporters and what can be done to help women-owned and Indigenous-owned firms in Canada better access global markets. This dimension of trade diversification is particularly important because it is vital in spreading the gains from exporting throughout the Canadian economy, ensuring that they are not concentrated among certain groups of Canadians or regions of Canada, but spread equally across the country.
Bibliography
Bédard-Maltais, Pierre-Olivier. “Digitize Now: How to Make the Digital Shift in Your Business.” Business Development Bank of Canada (2018).
Bélanger Baur, Audrey. “Women-owned Small and Medium Enterprise Exporters in Canada.” Global Affairs Canada, Office of the Chief Economist, Working paper (2019a).
———. “Indigenous-owned Exporting Small and Medium Enterprises in Canada.” Global Affairs Canada and the Canadian Council of Aboriginal Business (2019b).
Bernard, Andrew B., Bradford, Jensen, J., Redding, Stephen J. and Peter K. Schott. “Firms in International Trade.” US Census Bureau Center for Economic Studies, No. CES-WP-07-14 (2007).
Boileau, David. “Canada’s Merchandise Trade Performance with the EU under CETA.” Global Affairs Canada (2018).
European Commission. “Drivers of SME Internationalisation.” European Competitiveness Report (2014), 75‑114.
Foreign Affairs and International Trade Canada; “International Trade and Its Benefits to Canada.” Canada’s State of Trade: Trade and Investment Update 2012 (2012): 111-130.
Michaelyshyn, Katerina, and Emily Yu. “Merchandise Trade Performance since the Canada-Korea Free Trade Agreement Entered into Force in 2015.” Global Affairs Canada, Office of the Chief Economist, Working paper (2019).
Organisation for Economic Co-operation and Development. “Fostering Greater SME Participations in a Globally Integrated Economy.” OECD Discussion Papers (2018).
Rostami, Mitra. “Canada’s International Trade in Information and Communications Technologies (ICT) and ICT-enabled Services.” Latest Developments in the Canadian Economic Accounts, Statistics Canada, Cat. No. 13-605-X (2018).
Scarffe, Colin. “Benefits from Fast Growing Export Relationships.” Global Affairs Canada, Office of the Chief Economist, Working paper (2019a).
———. “Canada’s Geographic Export Diversity.” Global Affairs Canada, Office of the Chief Economist, Working paper (2019b).
———. “Canada’s Need to Diversify Stronger than Ever.” CanadExport, Global Affairs Canada (2019c).
Sekkel, Julia. “Characteristics of SME Exporters in Canada.” Global Affairs Canada, Office of the Chief Economist, Working paper (2019).
Statistics Canada. “Measuring Canadian Export Diversification.” Latest Developments in the Canadian Economic Accounts, Statistics Canada, Cat. No. 13-605-X (2018b).
Tran, Tuan. “Growing Canada’s Exports to Overseas Markets by 50 Percent.” Global Affairs Canada, Office of the Chief Economist, Working paper (2019a).
———. “Research on the Digital Economy at Global Affairs Canada.” Presentation to the Asia-Pacific Economic Cooperation Workshop on Digital Trade. Santiago, Chile (March 6, 2019b).
Vesselovsky, Mykyta. “Cities of the Future: Urban Opportunities for Canadian Businesses.” Global Affairs Canada, Office of the Chief Economist, Working paper (2019).
World Trade Organization. “World Trade Report 2016: Levelling the Trading Field for SMEs.” World Trade Organization (2016).
Yu, Emily. “Size and Pattern of Exporter Trade Diversification.” Global Affairs Canada, Office of the Chief Economist, Working paper (2019).