
3. Assessing the economic impact of international students in Canada
The economic impact assessment of international education involved first collecting data and information on the number of international students by level of study, and on the type of student expenditures incurred. These values were adjusted when necessary to arrive at the amount of overall spending by international students on educational fees and living expenditure. These spending values were then applied to Statistics Canada’s expenditure model to generate estimates of the impact that international students’ total spending had on Canada’s gross output, GDP, employment and tax revenues. In this section, we present the resulting estimates and analysis.
We start in section 3.1 with a description of the total number of international students, followed by the estimated spending by these students on education as well as daily living. Then in section 3.2 we report the combined direct and indirect economic impact of the annual expenditure on Canada’s economy through a number of macroeconomic variables such as the Gross Domestic Product, employment, and labour income. We also present the contribution of economic activity brought by the spending of international students to government tax revenue.
3.1. Overall spending
In this subsection, we combine the estimated number of international students in Canada by level of study in each province and territory with estimates on educational and living costs to arrive at an estimation of total expenditures by international students while they study in Canada. All student numbers and expenditure values capture the impact in 2024.
Table 1 shows the total number of international students studying in Canada, with provincial and territorial distribution. The student numbers have also been broken down to show students that are considered “long-term” and those who are considered “short-term Footnote 1 .”
| Province or territory | Long-term students | Short-term students | All students |
|---|---|---|---|
| Newfoundland and Labrador | 6,595 | 0 | 6,595 |
| Prince Edward Island | 4,795 | 55 | 4,850 |
| Nova Scotia | 23,010 | 1,733 | 24,743 |
| New Brunswick | 14,810 | 1,152 | 15,962 |
| Quebec | 126,125 | 12,807 | 138,932 |
| Ontario | 463,495 | 29,133 | 492,628 |
| Manitoba | 26,415 | 1,029 | 27,444 |
| Saskatchewan | 17,340 | 473 | 17,813 |
| Alberta | 63,825 | 5,247 | 69,072 |
| British Columbia | 195,484 | 19,311 | 214,795 |
| Yukon | 255 | 0 | 255 |
| Northwest Territories | 65 | 0 | 65 |
| Nunavut | 20 | 0 | 20 |
| Canada Footnote 2 | 942,234 | 70,940 | 1,013,174 |
Source: Immigration, Refugees and Citizenship Canada, and Languages Canada, with adjustments by RKA.
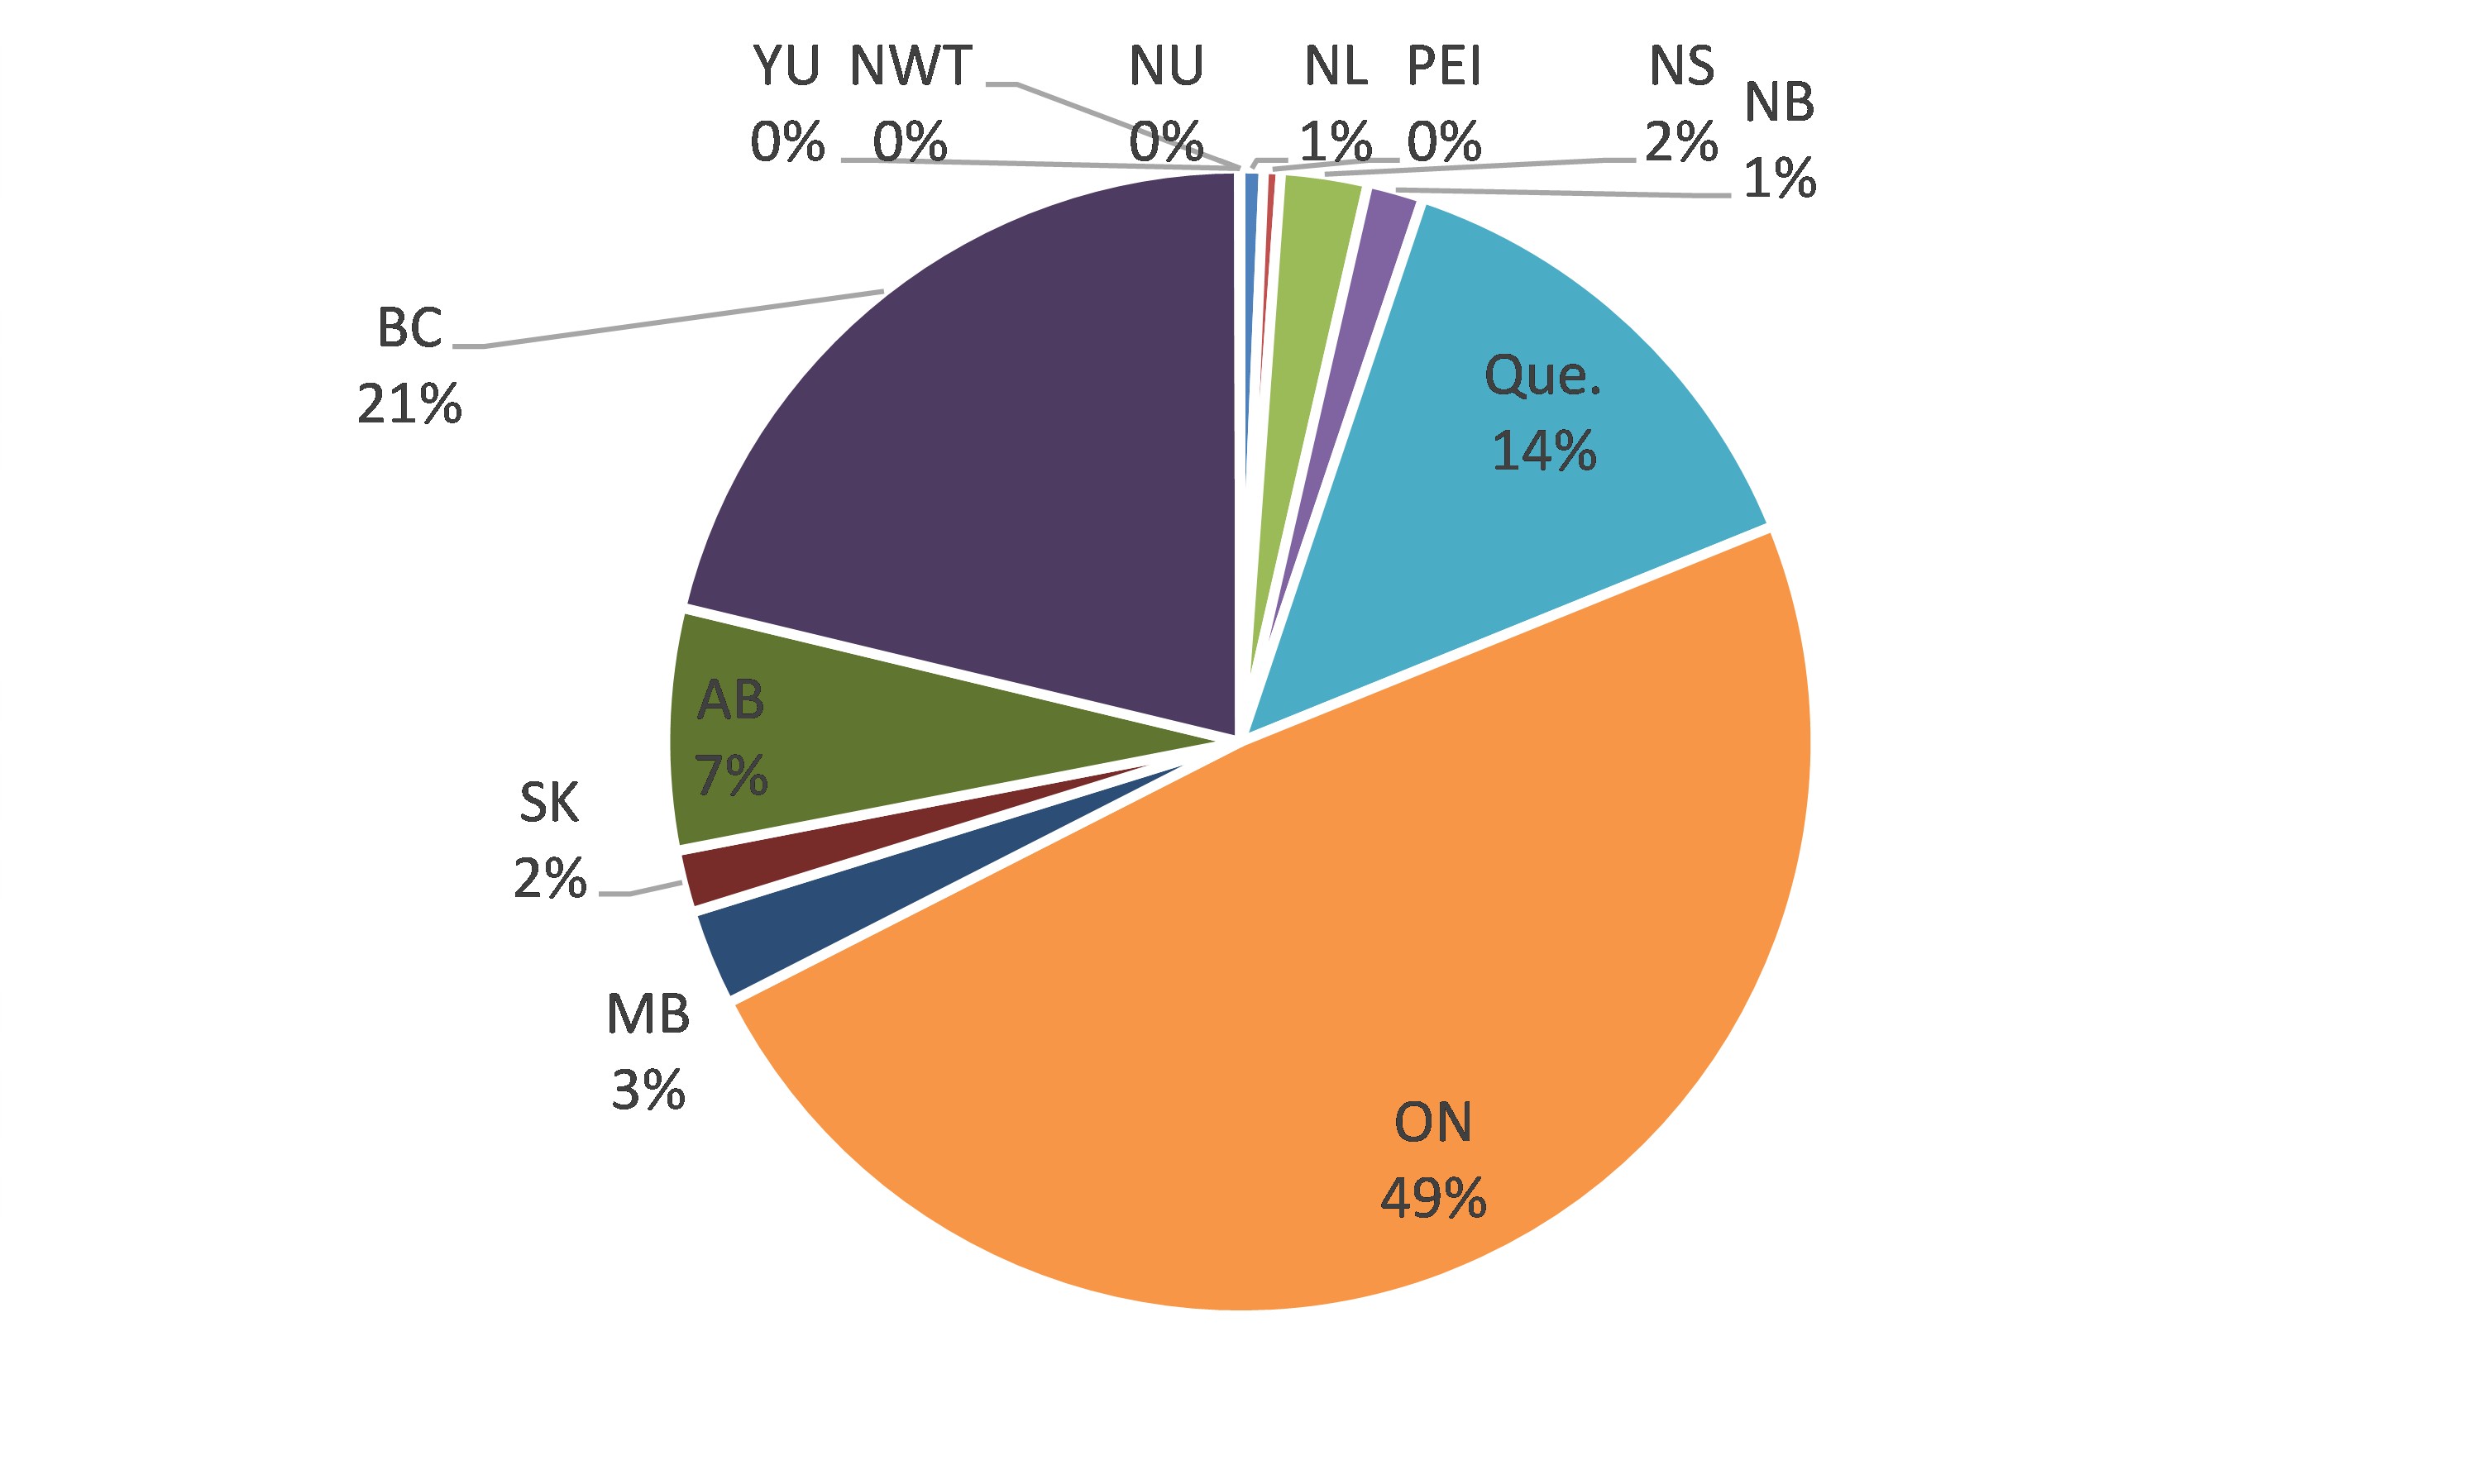
As can be seen in Figure 1, which shows the distribution of the total number of international students in Canada by province and territory, Ontario has the largest share of the international student population (48.6% in 2024). The province with the second-largest share of international students is British Columbia, which accounted for 21.2% of the total in 2024, though its share decreased in comparison to previous years. When compared with British Columbia’s population share in Canada, its share in the international student service market is still much higher. Quebec has the third largest market share in international education services, accounting for 13.7% of the number of students in 2024. All other provinces and territories also hosted increasing numbers of international students: Alberta had 6.8% of all international students in 2024; Nova Scotia had 2.4% of all students; Manitoba had 2.7% of students; Saskatchewan had 1.8% of students; New Brunswick had 1.6% of all students; Newfoundland and Labrador had 0.7% of all students; and Prince Edward Island had 0.5% of all students. The three territories also took in a very small number of international students.
Figure 1 - Distribution of the total number of international students in Canada by province and territory
View accessible version of figure 1
| Province/territory | Combined | Distribution |
|---|---|---|
| NL | 6,595 | 1% |
| PEI | 4,850 | 0% |
| NS | 24,743 | 2% |
| NB | 15,962 | 2% |
| Que. | 138,932 | 14% |
| ON | 492,628 | 49% |
| MB | 27,444 | 3% |
| SK | 17,813 | 2% |
| AB | 69,072 | 7% |
| BC | 214,795 | 21% |
| YU | 255 | 0% |
| NWT | 65 | 0% |
| NU | 20 | 0% |
| Canada | 1,013,174 | 100% |
Source: Data from IRCC and Languages Canada, with adjustments by RKA.
Over the past two decades, the number of study permit holders in Canada increased more than sevenfold, with every province and territory recording positive gains. Although Ontario attracted the greatest number of international students, it is worth noting that Prince Edward Island recorded the highest percentage increase in the number of study permit holders – from 2000 to 2024, the percentage increase has been over 2,000% (20 times). Table 2 shows the number of study permit holders in 2000 and in 2024, with the third column showing the average rate of increase per year for study permit holders in each province and territory.
| Province or territory | Study permit holders in 2000 | Study permit holders in 2024 | Average % increase per year |
|---|---|---|---|
| Newfoundland and Labrador | 690 | 6,950 | 10.1% |
| Prince Edward Island | 235 | 4,945 | 13.5% |
| Nova Scotia | 3,075 | 24,410 | 9.0% |
| New Brunswick | 1,825 | 15,545 | 9.3% |
| Quebec | 22,770 | 128,010 | 7.5% |
| Ontario | 46,120 | 482,100 | 10.3% |
| Manitoba | 2,830 | 27,635 | 10.0% |
| Saskatchewan | 2,690 | 18,520 | 8.4% |
| Alberta | 9,430 | 71,545 | 8.8% |
| British Columbia | 32,885 | 203,995 | 7.9% |
| Yukon | 45 | 325 | 8.6% |
| Northwest Territories | 25 | 85 | 5.2% |
| Nunavut | 0 | 20 | — |
| Canada | 122,620 | 996,375 | 9.1% |
Source: Immigration, Refugees and Citizenship Canada.
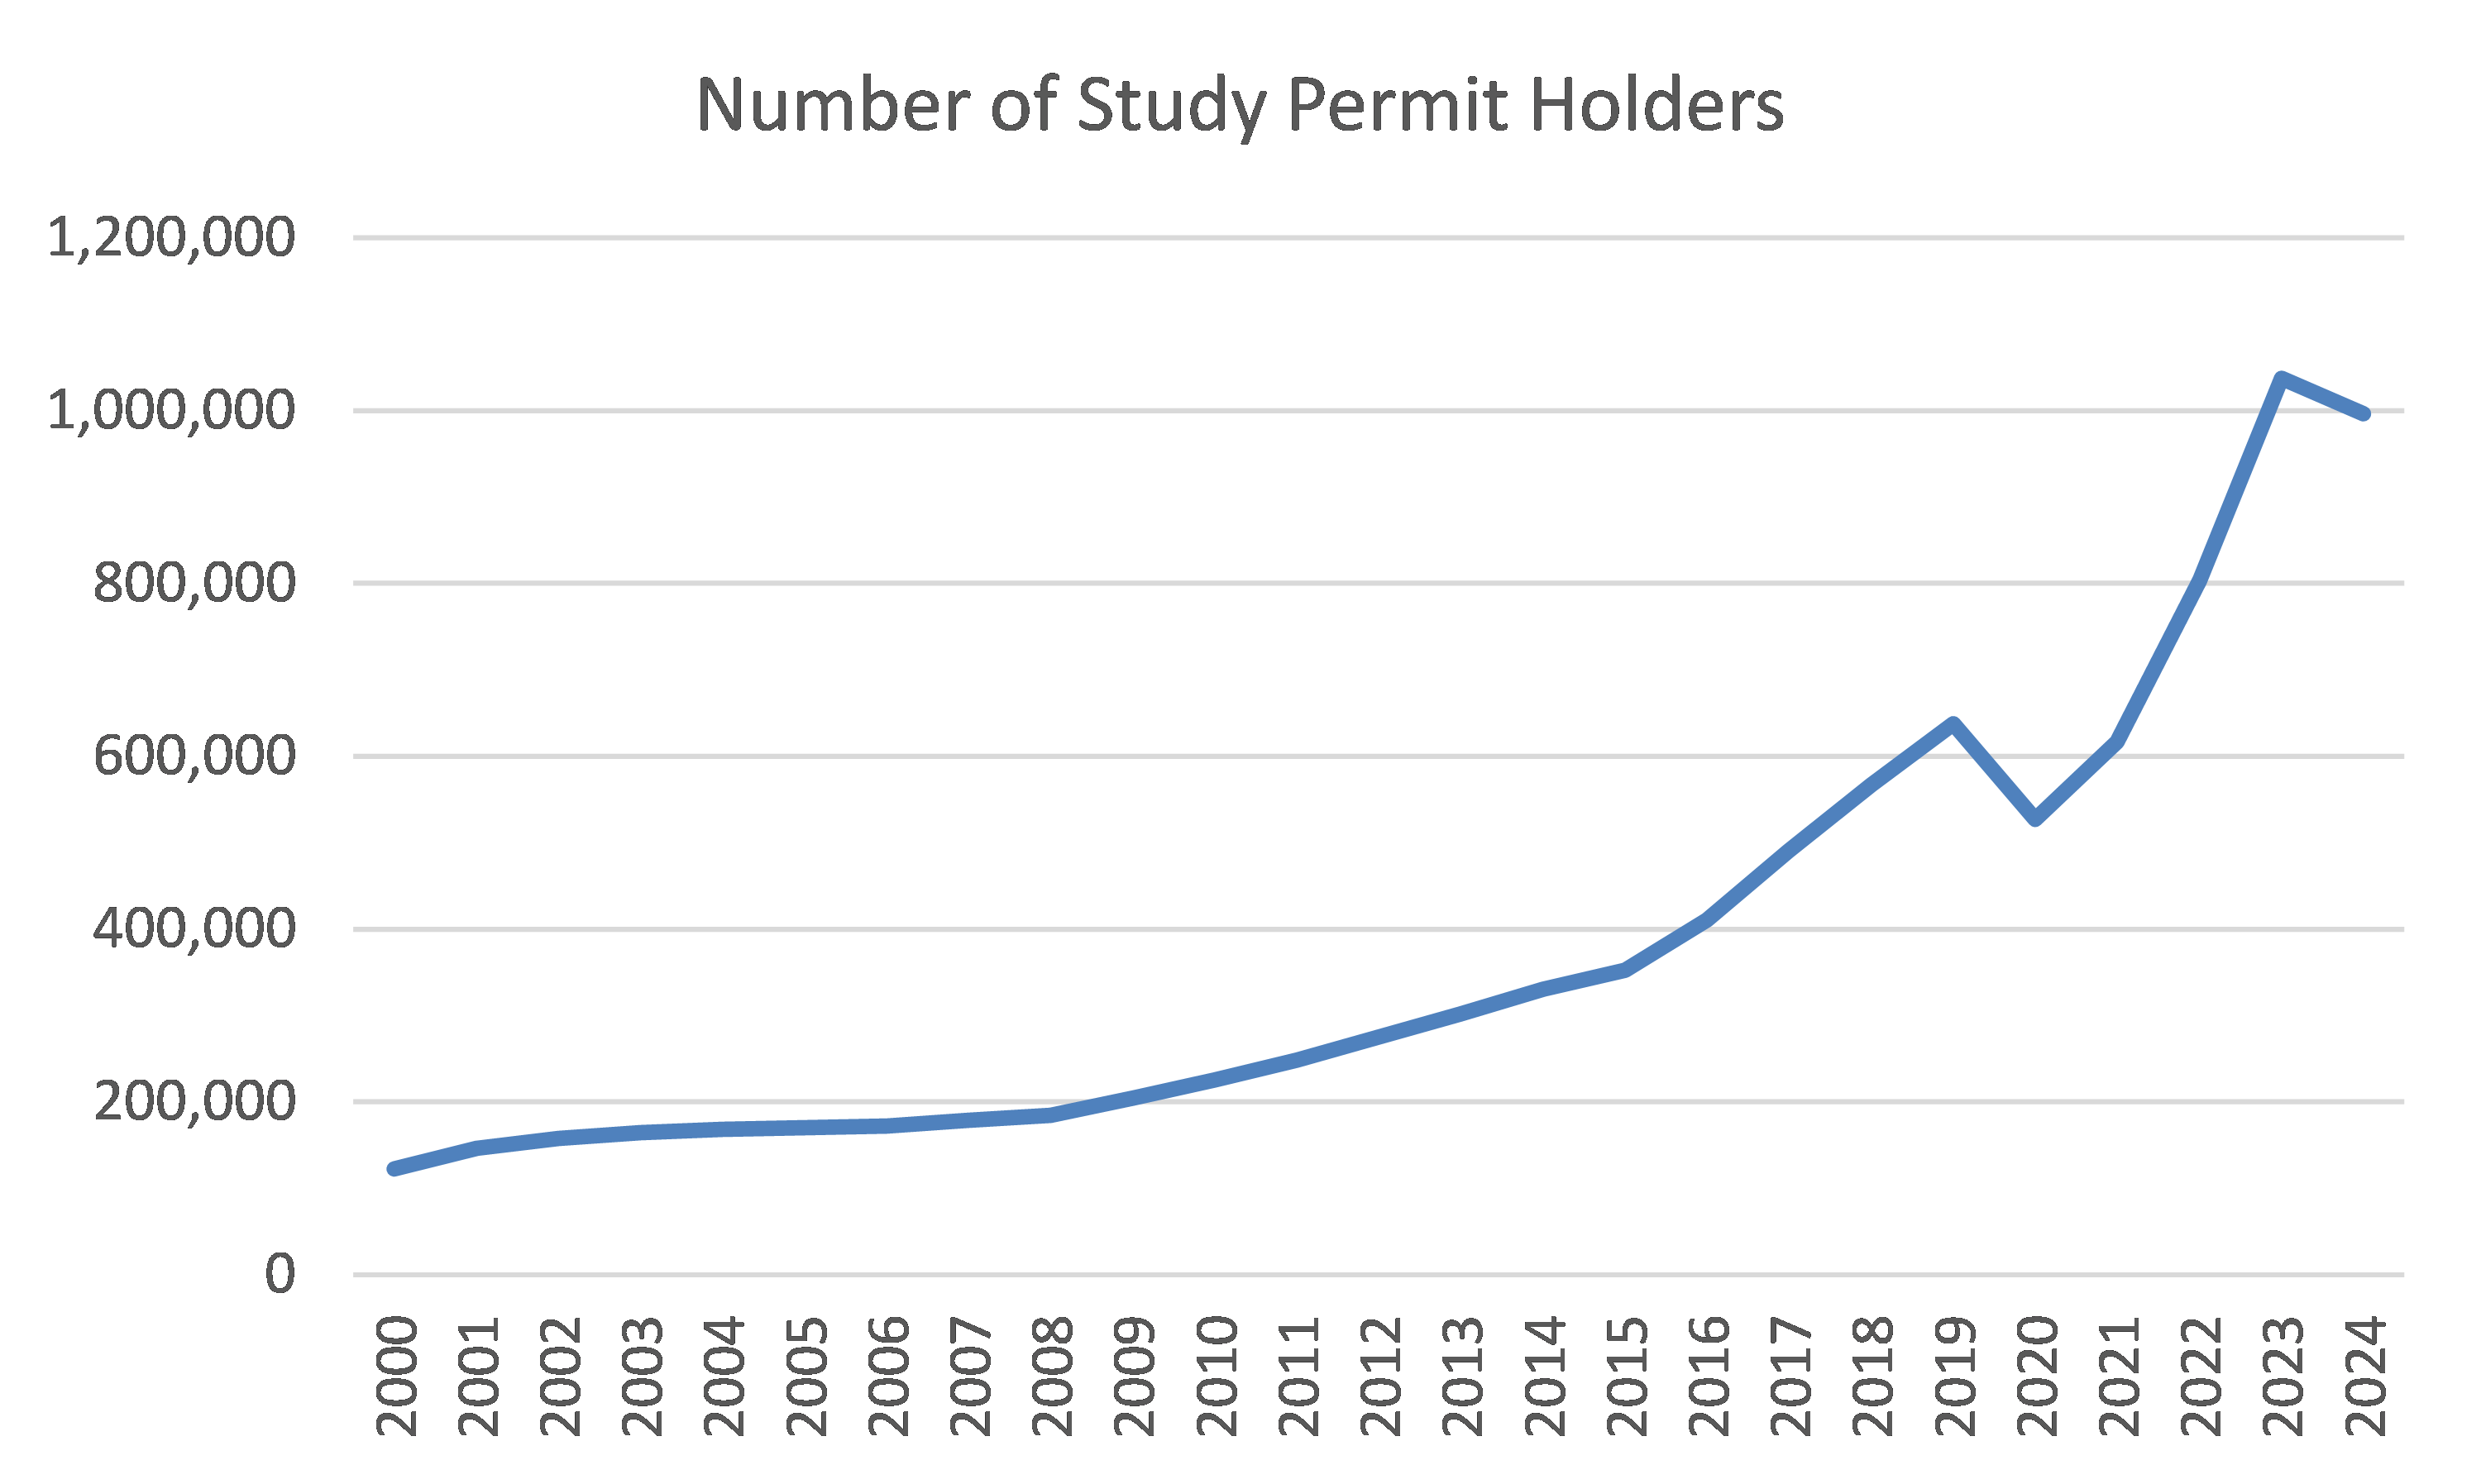
Figure 2 shows the number of study permit holders in Canada over the past two decades. These “long-term” students continue to grow steadily, after a dip in 2020 and 2021 due to pandemic related travel restrictions. In fact, the increase in the number of “long term” students between 2021 and 2022 was the most substantial, from approximately 616,365 to 803,580, an increase of 30.4%. The following year, 2023, also recorded the second largest annual increase in the number of “long-term” students (29.1%).
Figure 2 - Total number of study permit holders in Canada 2000 to 2024
View accessible version of figure 2
| Year | Canada |
|---|---|
| 2000 | 122,620 |
| 2001 | 145,900 |
| 2002 | 158,080 |
| 2003 | 164,435 |
| 2004 | 168,540 |
| 2005 | 170,395 |
| 2006 | 172,285 |
| 2007 | 179,055 |
| 2008 | 184,095 |
| 2009 | 203,960 |
| 2010 | 225,260 |
| 2011 | 248,445 |
| 2012 | 274,680 |
| 2013 | 301,515 |
| 2014 | 330,075 |
| 2015 | 352,290 |
| 2016 | 410,540 |
| 2017 | 490,735 |
| 2018 | 566,915 |
| 2019 | 637,745 |
| 2020 | 527,145 |
| 2021 | 616,365 |
| 2022 | 803,580 |
| 2023 | 1,037,165 |
| 2024 | 996,375 |
Source: IRCC.
Data for short-term students has been obtained from Languages Canada. It should be noted that the drastic decline in the number of students when compared with student numbers prior to 2019 reflects the severe negative impact due to the Covid-19 pandemic and therefore does not reflect the strength of the sector.
Table 3 shows the annual spending incurred by these international students, including the additional tourism activities associated with visiting family and friends. The data sources and adjustments to raw data to derive estimates of international student expenditures are detailed in Appendix 1.
| Province or territory | Long-term students | Additional tourism spending of visiting families | Short-term students | Additional tourism spending of visiting families | All students (including visiting family spending) |
|---|---|---|---|---|---|
| Newfoundland and Labrador | $225.0 | $2.4 | $0.0 | $0.0 | $227.4 |
| Prince Edward Island | $177.6 | $1.5 | $1.6 | $0.0 | $180.7 |
| Nova Scotia | $1,064.1 | $8.2 | $21.7 | $0.3 | $1,094.2 |
| New Brunswick | $574.1 | $5.5 | $15.2 | $0.2 | $594.9 |
| Quebec | $5,828.2 | $40.8 | $114.0 | $1.9 | $5,984.9 |
| Ontario | $24,223.2 | $164.3 | $456.8 | $4.4 | $24,848.6 |
| Manitoba | $984.6 | $9.4 | $7.2 | $0.2 | $1,001.4 |
| Saskatchewan | $698.9 | $6.3 | $8.0 | $0.0 | $713.2 |
| Alberta | $3,052.9 | $23.1 | $64.1 | $0.8 | $3,140.9 |
| British Columbia | $9,329.9 | $69.4 | $275.6 | $2.9 | $9,677.7 |
| Yukon | $8.7 | $0.1 | $0.0 | $0.0 | $8.8 |
| Northwest Territories | $1.3 | $0.0 | $0.0 | $0.0 | $1.3 |
| Nunavut | $0.4 | $0.0 | $0.0 | $0.0 | $0.4 |
| Canada | $46,168.8 | $331.0 | $838.2 | $10.6 | $47,474.6 |
Source: Detailed data sources, as reported in Appendix 1, with adjustments by RKA.
In total, almost $47.5 billion was put into the Canadian economy in 2024 by international student expenditures across the country.
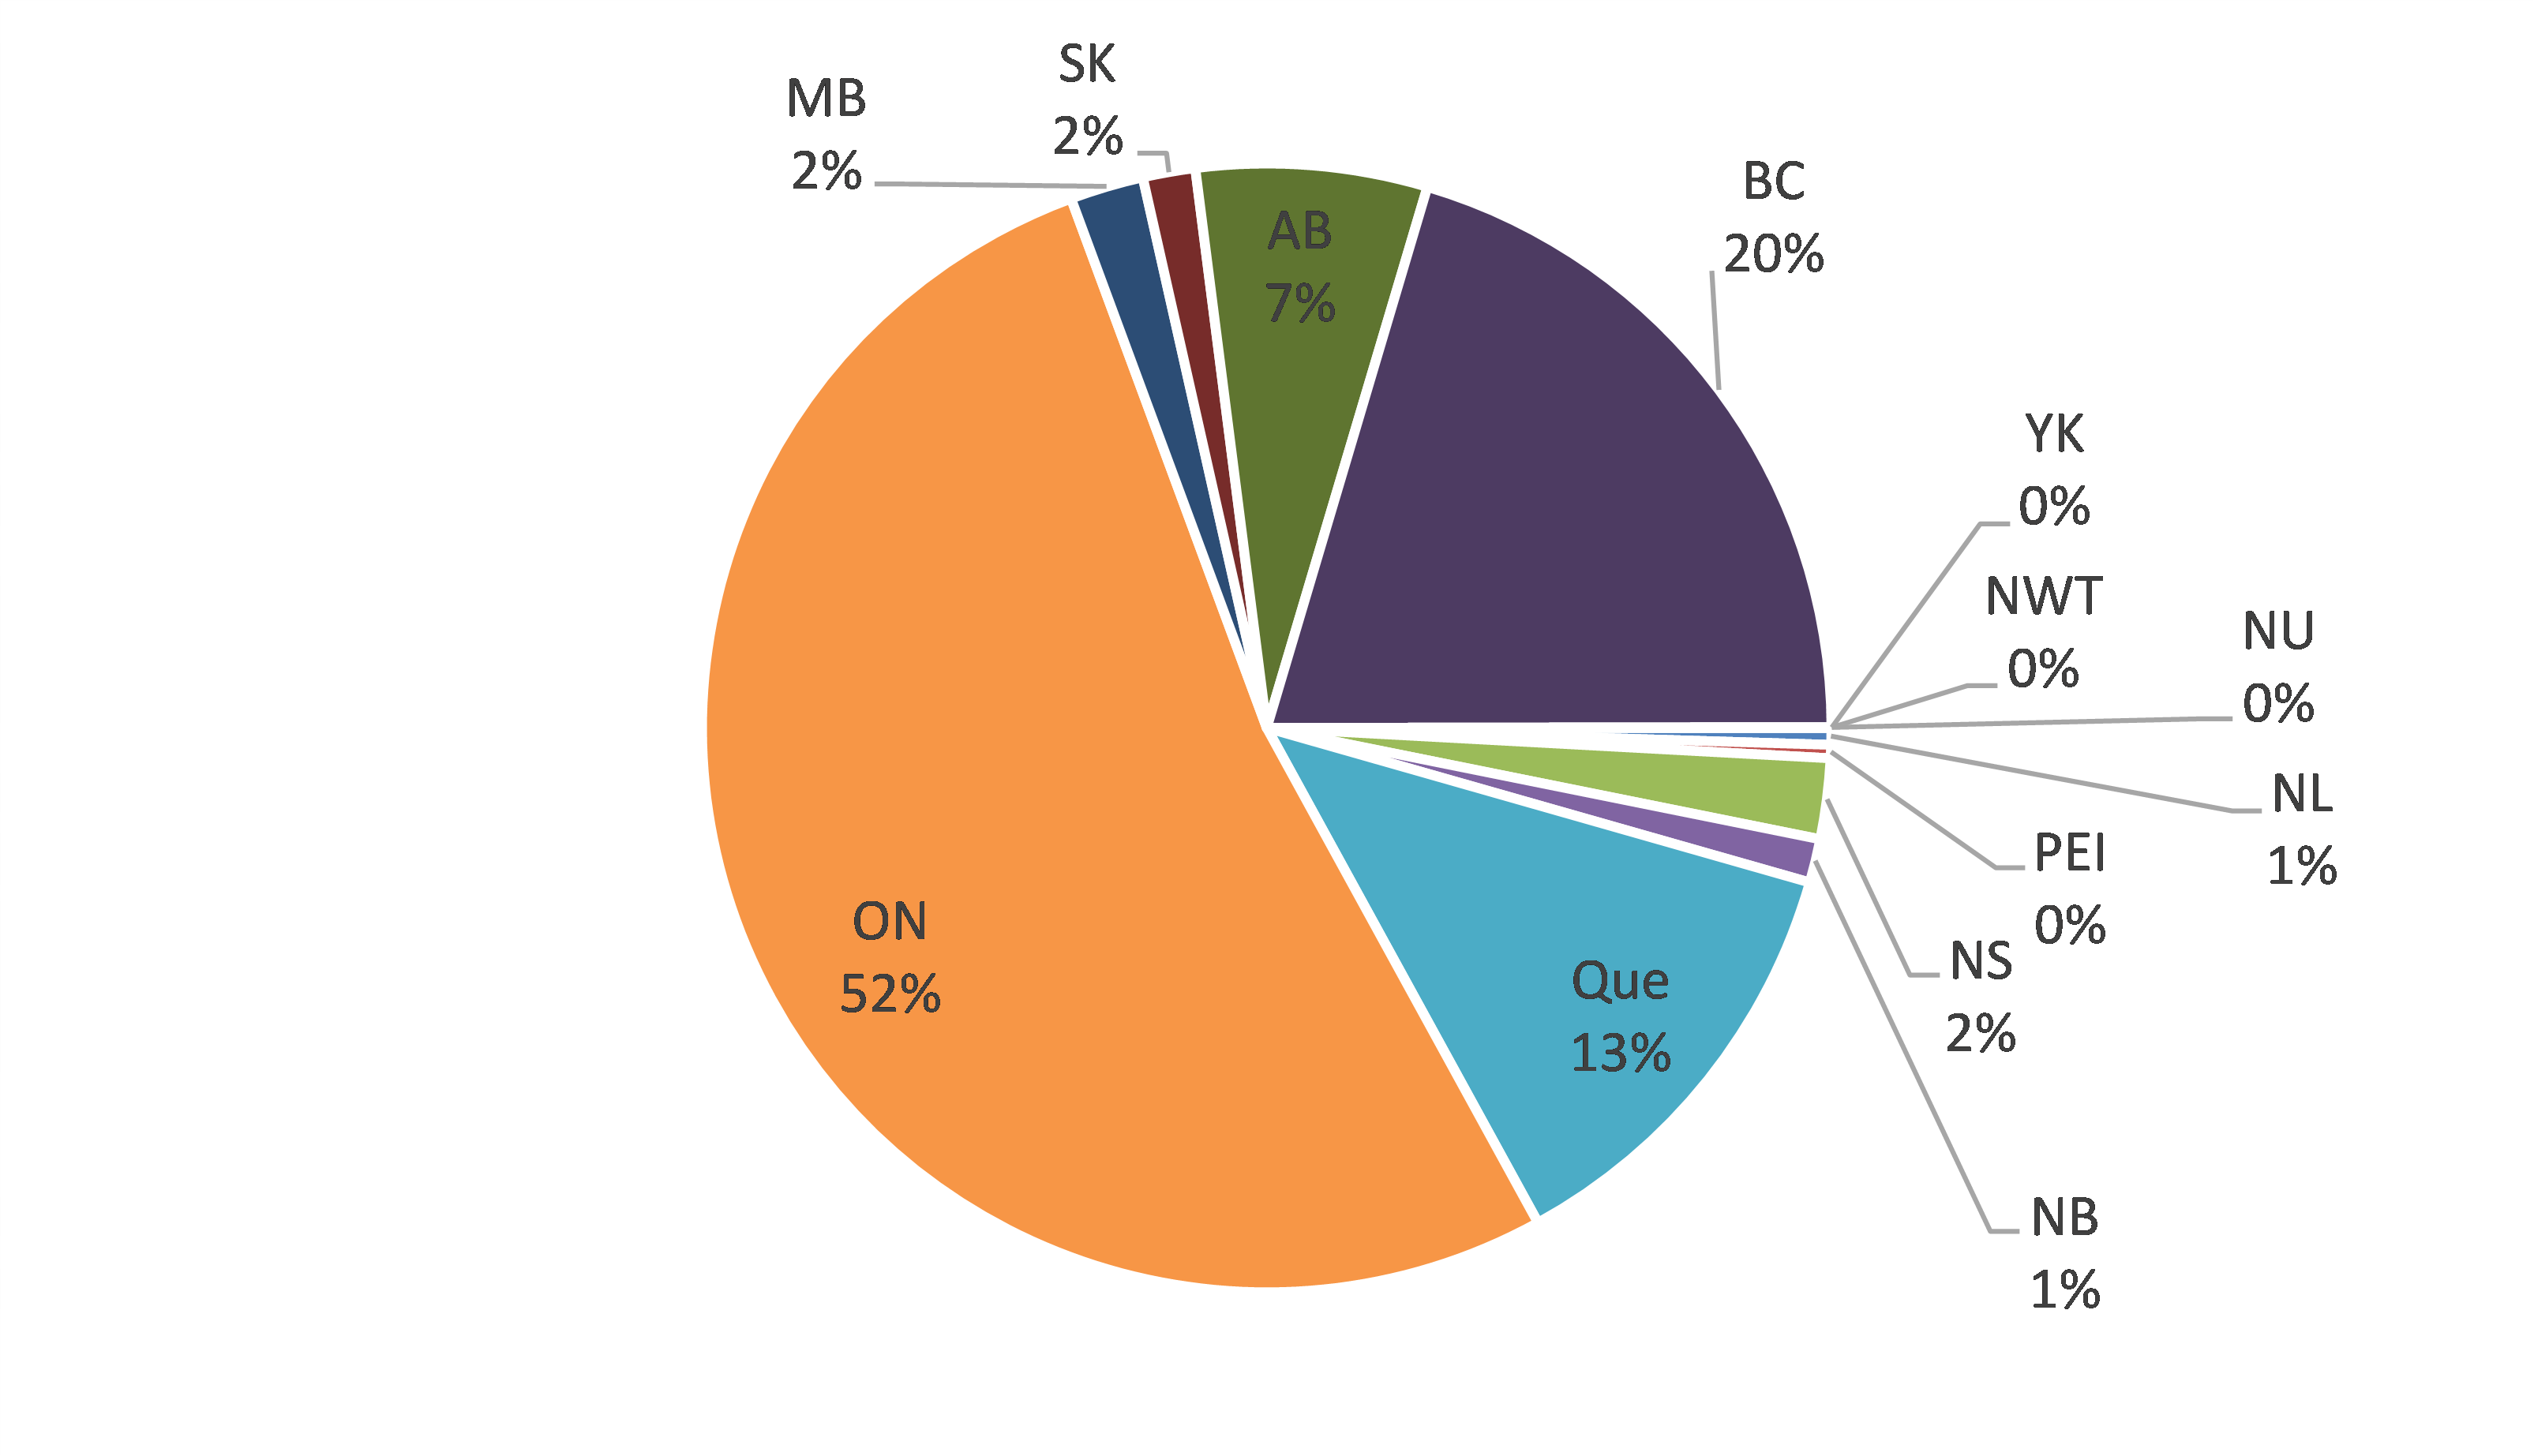
Figure 3 illustrates the distribution of the total amount of international student expenditures in 2024 by province and territory. In line with Figure 1, Ontario accounts for the largest share of total student expenditures of all provinces and territories in Canada, followed by British Columbia. The data in this figure also indicates that Ontario accounts for an even higher expenditure share than its student share (52.3% in 2024), which reflects the tuition and fees of students studying in university programs Footnote 5 .
Figure 3 - Distribution of total international student expenditures in Canada, by province and territory, 2024
View accessible version of figure 3
| Province/territory | % of total annual expenditure |
|---|---|
| NL | 0.5% |
| PEI | 0.4% |
| NS | 2.3% |
| NB | 1.3% |
| Que | 12.6% |
| ON | 52.3% |
| MB | 2.1% |
| SK | 1.5% |
| AB | 6.6% |
| BC | 20.4% |
| YK | 0.0% |
| NWT | 0.0% |
| NU | 0.0% |
| Canada | 100.0% |
Source: Various data sources detailed in Appendix 1, with adjustments by RKA.
Long-term students accounted for 97.9% of total annual spending, while short-term students accounted for the other 2.1%.
| Level of study | 2024 |
|---|---|
| K-12 | $33,300 |
| College | $45,500 |
| University | $57,300 |
| Other studies | $34,700 |
| All levels of study | $49,000 |
Source: RKA, based on various adjustments detailed in Appendix 1.
Table 4 above shows our estimates of the per-student cost of education and living while they stay in Canada. For long-term students, the average per student expenditure (including tuition, other fees, books, accommodations and meals, transportation, and discretionary spending, but excluding spending from visiting family and friends) per year was estimated to be $49,000 in 2024.
Short-term students incurred an average of almost $1,100 per week in total expenditure.
3.2. Economic impact
As we pointed out in the methodology section, when a person spends money on a product (goods and/or services), that amount creates a direct requirement for the production of that product. The economic impact, however, does not end there. The increased production of the product leads to increased production of all the intermediate goods and services that are used to make that product, which in turn generates more demand for other goods and services that are used to produce these intermediate products. As demand rises, workers are able to earn a higher wage, and they sometimes decide to spend a portion of their extra earnings on more goods and services. As such, the initial demand for a product creates a chain effect in the production process. This is referred to as the combined direct and indirect impact.
Three types of impacts are usually estimated, and they are described briefly below.
- Direct impact measures the increase in industrial output and the increase in an industry’s labour force resulting from the inflow of international students and their spending on a yearly basis. Examples of direct impact include tuition and fees paid to educational institutions, purchase of study material, rent, food, recreation, and other expenditures.
- Indirect impact measures the change in industrial output and employment demand in sectors that supply goods and services to sectors of the economy that are directly impacted. For example, universities and colleges need to pay for a variety of suppliers providing computers, telecommunication services and other services; food and other groceries sold in a supermarket come from farmers and food manufacturers who must in turn purchase more raw or intermediate materials from their suppliers.
- Induced impact measures the changes in output and employment demand across all sectors of the economy as a result of income increases in households impacted both directly and indirectly. In the context of international student spending, this impact is derived from increased spending by, for example, teaching staff from universities and colleges who teach classes for international students, or employees working in industries that supply goods and services to local businesses benefiting from an inflow of international students.
Although we present all three types of economic impact values associated with international students’ spending in this updated report, it should be noted that the report focuses on the combined direct and indirect impacts as representing a complete picture of economic impacts. It is generally acknowledged that direct impacts alone are incomplete, and the total impacts may sometimes overestimate the impacts of initial spending.
When we compare the value of total spending by international students with other sectors in the economy, gross domestic product (GDP), employment and export values are the key variables of interest. Other variables that may be of interest to readers include output, labour income and tax revenues. The results are presented for the aggregate of all international students, as well as long-term and short-term students separately. In this study, we also present the results for a subset of the long-term students: francophone students studying outside the province of Quebec.
To produce these impact values, we used Statistics Canada’s economic impacts simulation model to estimate international students’ contribution to each province’s GDP and employment Footnote 6 . Also reported are the values of output and labour income Footnote 7 .
The following sections present the combined direct and indirect impacts, first for the aggregate of all students, followed by the analysis for long-term students and then short-term students. There is also a section for a subset of the long-term students—francophone students studying outside of the province of Quebec. Direct economic impacts and total economic impacts (combining direct, indirect and induced impacts) are shown in Appendix 2.
3.2.1 Combined direct and indirect impacts
3.2.1.1 Aggregate for all students
Table 5 below presents the results of the combined direct and indirect economic impacts associated with all international students in Canada, by province and territory, in 2024.
To understand the relationship between international student spending and the different impact values, it is important to note that student expenditure is a major component contributing to the direct impact on the Canadian economy. However, it does not equal the value of direct output impact or the value of direct GDP impact. The total of $47.5 billion in annual international student spending represents the gross demand for commodities and services in the domestic market.
To meet this demand, the industries impacted must increase their production. Some of the $47.5 billion is used to pay for intermediate inputs. Some commodities purchased by international students are imports, both as intermediate inputs and as final products. These amounts must therefore be netted out. The simulation model shows that Canadian industries collectively needed to produce $43.6 billion worth of goods and services (direct output impact, as shown in Table 20 in Appendix 2) to meet the $47.5 billion in student expenditures. The direct GDP impact was $28.5 billion (Table 20, Appendix 2).
| Province or territory | Output | GDP at basic prices | Labour income | Jobs |
|---|---|---|---|---|
| Newfoundland and Labrador | $291.2 | $176.3 | $91.2 | 1,703 |
| Prince Edward Island | $225.7 | $124.0 | $71.5 | 1,512 |
| Nova Scotia | $1,388.8 | $864.6 | $513.9 | 10,331 |
| New Brunswick | $826.6 | $458.3 | $259.6 | 5,204 |
| Quebec | $9,223.5 | $5,222.8 | $3,154.4 | 59,388 |
| Ontario | $32,271.2 | $20,150.8 | $11,468.2 | 199,053 |
| Manitoba | $1,454.7 | $849.4 | $472.6 | 8,515 |
| Saskatchewan | $1,091.9 | $629.3 | $333.3 | 5,847 |
| Alberta | $5,368.4 | $3,118.5 | $1,675.9 | 29,128 |
| British Columbia | $11,531.3 | $7,360.4 | $4,315.6 | 86,470 |
| Yukon | $11.1 | $6.8 | $3.9 | 59 |
| Northwest Territories | $11.4 | $5.6 | $2.8 | 31 |
| Nunavut | $5.2 | $2.8 | $1.3 | 19 |
| Canada | $63,700.9 | $38,969.9 | $22,364.3 | 407,262 |
Source: Customized Statistics Canada expenditure model, based on expenditure profile produced by RKA.
In 2024, the combined direct and indirect GDP contribution of all student expenditures amounted to $39.0 billion in Canada, when we take into account not only the sectors directly impacted by international student spending, but also the many other industries in the supply chain of those directly impacted. In terms of employment, 407,260 jobs (the equivalent of 281,040 full-time equivalents) were supported. This impact on Canada’s GDP is equivalent to 1.4% of Canada’s GDP Footnote 8 .
3.2.1.2 Long-term students
Table 6 presents the corresponding direct and indirect impacts of international students who stay in Canada for at least six months on provincial and territorial output, GDP, employment and labour income.
| Province or territory | Output | GDP at basic prices | Labour income | Jobs |
|---|---|---|---|---|
| Newfoundland and Labrador | $289.2 | $175.2 | $90.7 | 1,695 |
| Prince Edward Island | $222.9 | $122.6 | $70.7 | 1,496 |
| Nova Scotia | $1,362.5 | $849.2 | $505.4 | 10,157 |
| New Brunswick | $807.1 | $447.8 | $254.0 | 5,090 |
| Quebec | $9,036.5 | $5,120.9 | $3,095.2 | 58,303 |
| Ontario | $31,654.8 | $19,788.2 | $11,276.5 | 195,759 |
| Manitoba | $1,434.8 | $839.8 | $467.7 | 8,424 |
| Saskatchewan | $1,074.2 | $620.3 | $329.2 | 5,773 |
| Alberta | $5,251.7 | $3,054.2 | $1,644.4 | 28,590 |
| British Columbia | $11,212.5 | $7,163.6 | $4,212.4 | 84,470 |
| Yukon | $10.9 | $6.7 | $3.9 | 58 |
| Northwest Territories | $11.1 | $5.4 | $2.7 | 30 |
| Nunavut | $5.1 | $2.8 | $1.3 | 19 |
| Canada | $62,373.4 | $38,196.6 | $21,953.9 | 399,865 |
Source: Customized Statistics Canada expenditure model, based on expenditure profile produced by RKA.
The values show that the total GDP contribution of students who stayed for at least six months during the year amounted to almost $38.2 billion in 2024 in Canada. In terms of jobs supported, international education services supported 399,870 jobs (the equivalent of 275,820 full-time equivalents) in Canada.
3.2.1.3 Languages Canada short-term students
When we take into account the spending of short-term language students who are studying in Languages Canada’s private member schools, these international students directly and indirectly contributed an additional $772.9 million to gross domestic product (GDP) and supported 7,390 jobs (the equivalent of 5,200 full-time equivalents) in 2024. This is represented in Table 7.
| Province or territory | Output | GDP at basic prices | Labour income | Jobs |
|---|---|---|---|---|
| Newfoundland and Labrador | $2.0 | $1.1 | $0.6 | 8 |
| Prince Edward Island | $2.8 | $1.4 | $0.8 | 16 |
| Nova Scotia | $26.3 | $15.5 | $8.6 | 173 |
| New Brunswick | $19.5 | $10.5 | $5.6 | 114 |
| Quebec | $187.0 | $101.9 | $59.2 | 1,085 |
| Ontario | $616.0 | $362.4 | $191.6 | 3,291 |
| Manitoba | $19.8 | $9.7 | $5.0 | 91 |
| Saskatchewan | $17.7 | $9.0 | $4.1 | 75 |
| Alberta | $116.7 | $64.3 | $31.5 | 538 |
| British Columbia | $318.6 | $196.8 | $103.1 | 2,000 |
| Yukon | $0.2 | $0.1 | $0.1 | 1 |
| Northwest Territories | $0.3 | $0.1 | $0.1 | 1 |
| Nunavut | $0.1 | $0.1 | $0.0 | 0 |
| Canada | $1,327.0 | $772.9 | $410.1 | 7,392 |
Source: Customized Statistics Canada expenditure model, based on expenditure profile produced by RKA.
It should be noted that, even though there were no direct annual student expenditures in Newfoundland and Labrador, there were impact values in output, GDP, labour income and employment because of the effect of interprovincial trade. The same reasoning applies to the impact values shown for the three territories: Yukon, Northwest Territories and Nunavut.
3.2.1.4 Francophone students studying outside of Quebec
In this study to update the estimated economic impact of international students, the report will also include a component on economic impact of francophone international students to communities outside of Quebec, i.e., students studying in institutions that offer programs in French language outside of Quebec. This component would be based on a compilation of more recent data on number of international students (using Study Permits as proxies) and their expenditures in Canada.
Data provided by Immigration, Refugees and Citizenship Canada (IRCC) indicated that there were 18,965 study permit holders designated to study in French-language programs in communities outside of Quebec as of December 31, 2024. These students were considered long-term students. However, no details on level of study are available due to the small size of this cohort in many communities. The data are grouped into sub-totals for each province and territory, and expenditures (including cost of education and cost of living) were calculated based on average per-student amounts for each province or territory. Of the 18,965 study permit holders, approximately 4,500 did not specify a province or territory of destination and were therefore excluded from the calculation.
Similar to the treatment of all long-term students, an allowance was made for additional spending incurred when family and friends visited Canada while the students were studying in the country.
Overall, these francophone students generated $703.3 million in economic activity in Canada. This translates into a combined direct and indirect GDP contribution of $572.9 million to the Canadian economy, $324.7 million in labour income earned, and 5,800 jobs supported. These results are presented in Table 8.
| Province or territory | Output | GDP at basic prices | Labour income | Jobs |
|---|---|---|---|---|
| Newfoundland and Labrador | $3.5 | $2.2 | $1.1 | 19 |
| Prince Edward Island | $5.0 | $2.8 | $1.6 | 33 |
| Nova Scotia | $34.1 | $21.4 | $12.9 | 256 |
| New Brunswick | $111.9 | $65.7 | $36.1 | 772 |
| Quebec | $45.3 | $21.1 | $12.6 | 189 |
| Ontario | $608.7 | $382.3 | $217.3 | 3,794 |
| Manitoba | $19.4 | $11.1 | $6.1 | 110 |
| Saskatchewan | $10.1 | $5.3 | $2.6 | 45 |
| Alberta | $49.3 | $27.4 | $14.4 | 236 |
| British Columbia | $53.8 | $33.1 | $19.8 | 378 |
| Yukon | $0.3 | $0.2 | $0.1 | 2 |
| Northwest Territories | $0.4 | $0.2 | $0.1 | 1 |
| Nunavut | $0.1 | $0.0 | $0.0 | 0 |
| Canada | $941.8 | $572.9 | $324.7 | 5,836 |
Source: Customized Statistics Canada expenditure model, based on expenditure profile produced by RKA.
3.2.1.5 Government tax revenue
In this subsection, we further demonstrate the importance of total spending by international students in terms of its contribution to government revenue. In general, government revenues come from personal income taxes, indirect taxes less subsidies, corporate income taxes and natural resource royalties. In this study, we were able to estimate personal income taxes and indirect taxes.
Indirect taxes incurred in the process of producing outputs and services include both indirect taxes on production (such as property taxes) and indirect taxes on products (such as federal and provincial sales taxes) Footnote 9.
Government revenue can be derived using Statistics Canada’s expenditure model to calculate the amount of indirect taxes incurred in the process of producing an industry’s outputs and services. It should be noted that Statistics Canada’s model estimates tax revenue impacts for the combined direct and indirect impacts, and for total (direct, indirect and induced impacts) scenarios only.
In addition to indirect taxes, another type of tax revenue generated is income taxes associated with labour income Footnote 10 . Statistics Canada’s expenditure model does not automatically estimate personal income taxes. Instead, we derived these values by applying the average personal income tax rates in each province and territory to labour income generated in Statistics Canada’s expenditure model.
The following tables present our estimates of the tax revenue impacts, first for all international student spending in a year, followed by annual spending by long-term students and short-term students. The tax revenue impact by francophone students studying outside the province of Quebec is presented in table 12.
| Province or territory | Indirect taxes | Personal income taxes | Total tax revenue |
|---|---|---|---|
| Newfoundland and Labrador | $25.4 | $18.9 | $44.3 |
| Prince Edward Island | $20.0 | $13.4 | $33.4 |
| Nova Scotia | $113.4 | $102.8 | $216.1 |
| New Brunswick | $70.1 | $46.5 | $116.7 |
| Quebec | $821.8 | $642.3 | $1,464.0 |
| Ontario | $2,630.1 | $2,329.1 | $4,959.2 |
| Manitoba | $113.7 | $86.9 | $200.6 |
| Saskatchewan | $61.1 | $56.7 | $117.8 |
| Alberta | $272.3 | $317.7 | $590.0 |
| British Columbia | $853.7 | $780.2 | $1,633.9 |
| Yukon | $0.5 | $0.5 | $1.1 |
| Northwest Territories | $0.2 | $0.5 | $0.7 |
| Nunavut | $0.1 | $0.2 | $0.3 |
| Canada | $4,982.5 | $4,395.5 | $9,378.0 |
Source: Customized Statistics Canada expenditure model, based on expenditure profile produced by RKA.
| Province or territory | Indirect taxes | Personal income taxes | Total tax revenue |
|---|---|---|---|
| Newfoundland and Labrador | $25.4 | $18.7 | $44.1 |
| Prince Edward Island | $19.8 | $13.2 | $33.0 |
| Nova Scotia | $110.6 | $101.0 | $211.6 |
| New Brunswick | $68.2 | $45.5 | $113.7 |
| Quebec | $804.2 | $630.2 | $1,434.4 |
| Ontario | $2,569.5 | $2,290.2 | $4,859.7 |
| Manitoba | $112.4 | $86.0 | $198.4 |
| Saskatchewan | $60.0 | $56.0 | $116.0 |
| Alberta | $265.4 | $311.8 | $577.2 |
| British Columbia | $823.8 | $761.5 | $1,585.3 |
| Yukon | $0.5 | $0.5 | $1.0 |
| Northwest Territories | $0.2 | $0.4 | $0.7 |
| Nunavut | $0.1 | $0.2 | $0.3 |
| Canada | $4,860.1 | $4,315.3 | $9,175.4 |
Source: Customized Statistics Canada expenditure model, based on expenditure profile produced by RKA.
| Province or territory | Indirect taxes | Personal income taxes | Total tax revenue |
|---|---|---|---|
| Newfoundland and Labrador | $0.0 | $0.1 | $0.2 |
| Prince Edward Island | $0.2 | $0.1 | $0.4 |
| Nova Scotia | $2.8 | $1.7 | $4.5 |
| New Brunswick | $2.0 | $1.0 | $3.0 |
| Quebec | $17.6 | $12.1 | $29.6 |
| Ontario | $60.5 | $38.9 | $99.4 |
| Manitoba | $1.3 | $0.9 | $2.2 |
| Saskatchewan | $1.0 | $0.7 | $1.7 |
| Alberta | $6.9 | $6.0 | $12.9 |
| British Columbia | $29.9 | $18.6 | $48.6 |
| Yukon | $0.0 | $0.0 | $0.0 |
| Northwest Territories | $0.0 | $0.0 | $0.0 |
| Nunavut | $0.0 | $0.0 | $0.0 |
| Canada | $122.4 | $80.2 | $202.5 |
Source: Customized Statistics Canada expenditure model, based on expenditure produced by RKA.
The total tax revenue generated by indirect taxes and personal income taxes associated with international student spending in 2024 was estimated to be $9.4 billion, when direct and indirect impacts were combined.
Specific to the component of francophone international students studying in communities outside the province of Quebec, annual spending was estimated to have contributed $139.1 million worth of government revenue.
| Province or territory | Indirect taxes | Personal income taxes | Total tax revenue |
|---|---|---|---|
| Newfoundland and Labrador | $0.2 | $0.2 | $0.4 |
| Prince Edward Island | $0.4 | $0.3 | $0.7 |
| Nova Scotia | $2.5 | $2.6 | $5.1 |
| New Brunswick | $12.4 | $6.5 | $18.9 |
| Quebec | $1.3 | $2.6 | $3.9 |
| Ontario | $50.6 | $44.1 | $94.8 |
| Manitoba | $1.5 | $1.1 | $2.6 |
| Saskatchewan | $0.5 | $0.4 | $0.9 |
| Alberta | $2.0 | $2.7 | $4.8 |
| British Columbia | $3.4 | $3.6 | $7.0 |
| Yukon | $0.0 | $0.0 | $0.0 |
| Northwest Territories | $0.0 | $0.0 | $0.0 |
| Nunavut | $0.0 | $0.0 | $0.0 |
| Canada | $75.0 | $64.2 | $139.1 |
Source: Customized Statistics Canada expenditure model, based on expenditure profile produced by RKA.
- Date modified: